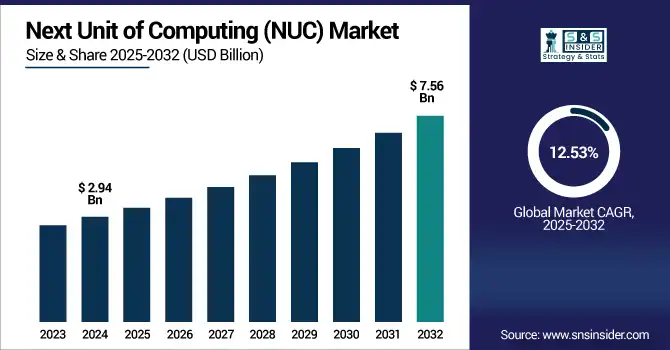
The Next Unit of Computing (NUC) Market size was valued at USD 2.94 Billion in 2024 and is projected to reach USD 7.56 Billion by 2032, growing at a CAGR of 12.53% during 2025-2032.
The Next Unit of Computing (NUC) market is witnessing robust growth globally due to the high demand for compact and power-efficient computing systems that can be used in education, retail, healthcare or small office/home office (SOHO) applications. With a powerful performance, modular design, and space-saving designs, these mini pcs are suitable for digital signage, POS system, and remote working environment. The low-power draw, simple deployment, and growing support for upgraded technologies, such as DDR5 RAM, multi-display output, and high-speed connections are making NUCs popular with end-users as viable replacements for traditional retail desktops. The NUC market is expected to grow steadily over 2024 to 2032 as companies look for scalable and affordable solutions, with improved penetration across developed and developing economies.
ASUS NUC 14 Essential Claims Over 1000 Units Sold in South Africa Since Launch in January 2025 Designed for SMEs and SOHO users, the compact mini PC offers triple-display support, DDR5 memory, and energy-efficient performance.
The U.S Next Unit of Computing (NUC) Market size was valued at USD 0.88 Billion in 2024 and is projected to reach USD 1.87 Billion by 2032, growing at a CAGR of 9.81% during 2025-2032. The U.S. Next Unit of Computing (NUC) market growth is driven by rising demand for compact, energy-efficient, and high-performance computing across education, retail, and SOHO sectors. Businesses increasingly favor NUCs for their reliability, scalability, and minimal space requirements.
The Next Unit of Computing (NUC) market trends include growing adoption of ready-to-go systems among SMEs and schools, integration of DDR5 memory, Wi-Fi 6E, and multi-display capabilities, and expanding use in POS, digital signage, and edge computing. Modular and customizable NUC platforms are also gaining traction to meet evolving user needs.
Drivers:
Rising Demand for Space-Efficient and Low-Power PCs Drives NUC Market Expansion
The increasing need for small, power-efficient, and modular computers systems to meet the demands of the current users/users constitutes one of the major factors driving the growth of the Next Unit of Computing (NUC) market. With the demand for tiny PCs, NUCs are more popular than ever since they can bring high performance in low footprints, which are ideal for space-limited environments Including call centers, retail counters, classrooms, and work-from-home setups. With less power-consuming capabilities, it aids in sustainability goals, along with upgrade options for modular RAM and storage. As hybrid work models undergo more comprehensive adoption, the widening edge computing deployment and the rising digital signage and POS systems significantly contribute to the NUC market growth by acting as the epitome of modern-day computing.
MSI Cubi NUC 1M Eco-friendly mini PC with quiet performance and efficient power use — MTA Tech News It packs workstation-class specifications in a tiny, VESA-mount compatible case with Intel Core 7, DDR5, and Thunderbolt 4.
Restraints:
Costly Prices & Less Upgrade Capital of NUC Makes NUC Systems slower in Adoption
NUC market has very high growth potential but it has some key constraints. One of the drawbacks is the low possibility of upgrading key components, especially the CPU, which turns off hobbyists and techies who want to stay flexible for the long-haul. Also, the higher price points over the traditional desktop alternative can deter at least the cost sensitive buyer out there, which most certainly does include buyers in more emerging economies. Small size is also a thermal management limitation when it comes to extended high-performance use. In addition, availability and cost are susceptible to everything from dependence on a handful of semiconductor vendors and geology to supply-chain disruptions.
In addition, market uncertainty will continue as Intel withdraws from actually building NUCs (although it may well continue altogether to design NUCs that are then built by third-party OEMs), meaning any third-party OEM has work ahead to build brand confidence, but also to ensure reliability and ongoing support. These factors combined serve as speed bumps to broader market penetration, particularly in the most competitive and price-sensitive segments.
Opportunities:
Growth in AI and Edge Workloads Drives Demand for High-Performance Compact NUC Systems
As AI computing continues to scale across industries, there is a growing need for localized, high-efficiency computing solutions that can support intensive workloads at the edge. The reason for this shift is the decentralization of AI infrastructure that needs processing closely at the data source to minimize latency and bandwidth costs. One consequence is the increasing need for high-performance NUC systems with high-FPS single-thread performance with GPUs, multi-view, multi-monitor support, and rich I/O in a small and modular footprint. They are suitable for research environments, smart factories, and enterprise AI testing setups. NUCs combine plenty of performance but contained between two hands and that is why they stand out as an important catalyst for next-generation AI and edge deployments.
Nvidia presented next-gen GB300 systems, RTX Pro Server, and NVLink Fusion, all designed to enhance the ability of AI to compute even more. It will also construct a 10,000-Blackwell-GPU AI supercomputer factory in Taiwan alongside Foxconn.
Challenges:
Hardware Limitations and Competitive Pressure Slow NUC Market Adoption
The Next Unit of Computing (NUC) market faces several key challenges that could limit its broader adoption. A primary concern is the restricted hardware flexibility, particularly the inability to upgrade processors, which deters tech-savvy users and DIY builders. In addition, compact form factors can lead to thermal limits on sustained high-performance workloads, particularly in industrial or AI applications. NUCs are also witnessing increased competition from alternative miniature systems ranging from compact desktops and mini-PCs to ARM-based systems with similar capabilities at lower price points. Also, there is Intel's departure from direct NUC production, which has led to an increased focus on OEMs to prove their worth and credibility. Combined, these constrain penetration in value-constrained and performance-dependent segments, despite the substantial market growth opportunity.
By Product
In 2024, the Barebone NUC segment accounted for approximately 44% of the Next Unit of Computing (NUC) market share, owing to the increasing demand for customizable, cost-effective mini-PCs. It is a popular segment that caters to the needs of both consumers and commercial applications and appeals to those users and system integrators who prefer flexibility to configure RAM, storage, and operating systems.
The Ready-to-Go NUC segment is expected to experience the fastest growth in Next Unit of Computing (NUC) market over 2025-2032 with a CAGR of 16.54%, providing plug-and-play solutions requiring little or no configuration and pre-installed software to serve rapid deployment needs of SMEs, educational institutions, and remote workers.
By Application
In 2024, the Consumer Electronics segment accounted for approximately 35% of the Next Unit of Computing (NUC) market share, making it the largest application segment. This dominance is attributed to the growing adoption of compact PCs for home entertainment, media centers, and general-purpose computing. Increasing consumer preference for energy-efficient, space-saving devices is further fueling demand in this segment across global households.
The Digital Signage segment is expected to experience the fastest growth in Next Unit of Computing (NUC) market over 2025-2032 with a CAGR of 16.77%. This growth is fueled by the increasing requirement for small footprint and high-performance solutions in applications Including retail, transportation, and public venues, where NUCs help deliver content in an efficient way, multi-display support, and 24×7 reliability.
By End-User
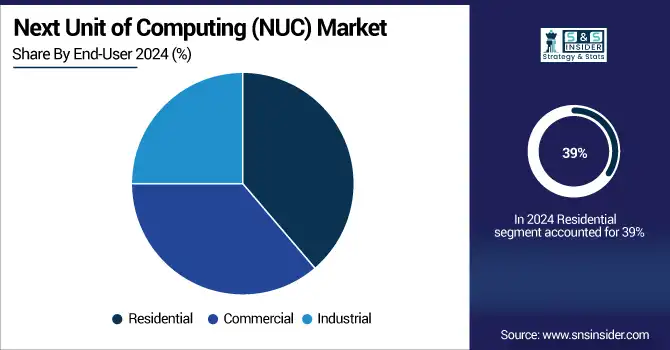
In 2024, the Residential segment accounted for approximately 39% of the Next Unit of Computing (NUC) market share due to increasing demand for compact and highly power-efficient PCs for residential purposes. NUCs are hybrids between a PC and a console, regarding their style, they are small and quiet, a perfect duo for a home office, a media stream, or a light gaming station.
The Commercial segment is expected to experience the fastest growth in Next Unit of Computing (NUC) market over 2025-2032 with a CAGR of 15.17%. This growth is primarily due to the growing inclination of the customers and businesses toward e-commerce platforms for large varieties of NUC models, price differences, and doorstep delivery. The increasing trends in digital purchase and higher global accessibility drives the online NUC sales in each region.
By Distribution Channel
In 2024, the Online Stores segment accounted for approximately 39% of the Next Unit of Computing (NUC) market share and is expected to register the fastest growth over 2025-2032, with a CAGR of 15.07%. This growth is primarily driven by the increasing shift of consumers and businesses toward e-commerce platforms that offer a broad range of NUC models, price comparisons, and convenience of doorstep delivery. The growing trend of digital purchasing and global accessibility further boosts online NUC sales across regions.
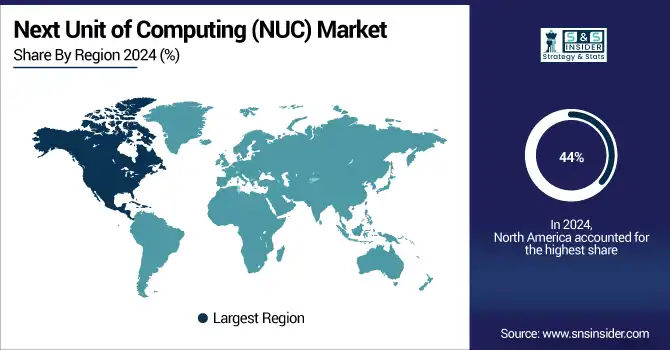
In 2024, North America dominated the Next Unit of Computing (NUC) market and accounted for 44% of revenue share, driven by strong adoption across commercial, residential, and institutional sectors. The region has advanced IT infrastructure, early tech adoption, and growing demand for compact, high-performance computing devices have positioned it as a key contributor to NUC market expansion.
Asia Pacific is expected to witness the fastest growth in the Next Unit of Computing (NUC) market over 2025-2032, with a projected CAGR of 14.29% due to Rapid developments in digital transformation, increasing need for small-scale computing due to urban explosion, and a rise in government smart infrastructure initiatives in the region are some of the major factors that will contribute to the fastest growing Next Unit of Computing (NUC) market. Rising NUC deployments by countries such as China, India, Japan, and South Korea are driven by the presence of major manufacturers of electronics and high SME adoption.
In 2024, Europe emerged as a promising region in the Next Unit of Computing (NUC) market, supported by increasing adoption of energy efficient and compact form factor computing solutions among enterprise, educational and residential users. The deployment of NUC continues to trend due to increasing green technology focus, EU Digital Transformation initiatives, growing adoption of edge computing applications. The regional expansion is being spearheaded by neighboring countries, including GER, the U.K., and FR, with promising infrastructure and tech expenditure.
LATAM and MEA are experiencing steady growth in the Next Unit of Computing (NUC) market, owing to digital transformation, early adoption of compact computing in education and government sectors, and growing internet infrastructure, and as a result LATAM and MEA are projected to witness steady growth in NUC market. Additionally, the gradual penetration of e-commerce along with increasing awareness regarding energy-efficient IT solutions, are also supporting the penetration of NUC in these emerging regions.
The Next Unit of Computing (NUC) companies are Intel, ASRock, Gigabyte, ZOTAC, Shuttle, Acer, ASUS, HP, Dell, Lenovo, MSI, Fujitsu, Panasonic, Apple, Samsung, HPE, Compulab, Minisforum, Beelink, Chuwi. and Others
In July 2025, NovaCustom has unveiled a Meteor Lake-powered NUC Box running on open-source Dasharo/Coreboot firmware, offering a privacy-focused alternative to proprietary BIOS.Set to ship in September 2025, it supports up to 96GB RAM, 2.5G Ethernet, Wi-Fi 7, and starts at €830.
In March 2025, Acer’s gaming PC listing reveals Nvidia RTX 5060 GPU with 8GB GDDR7 memory, hinting at an imminent launch. The leak supports speculation that RTX 5060 will be one of the first consumer GPUs based on Nvidia’s Blackwell architecture.
Report Attributes | Details |
Market Size in 2024 | USD 2.94 Billion |
Market Size by 2032 | USD 7.56 Billion |
CAGR | CAGR of 12.53% From 2024 to 2032 |
Base Year | 2024 |
Forecast Period | 2025-2032 |
Historical Data | 2021-2023 |
Report Scope & Coverage | Market Size, Segments Analysis, Competitive Landscape, Regional Analysis, DROC & SWOT Analysis, Forecast Outlook |
Key Segments | • By Product Type(Barebone NUC, Ready-to-Go NUC, NUC Kits) • By Application(Consumer Electronics, Industrial Automation, Digital Signage, Healthcare, Gaming and Others) • By End-User(Residential, Commercial and Industrial) • By Distribution channel(Online Stores and Offline Retailers) |
Regional Analysis/Coverage | North America (US, Canada), Europe (Germany, UK, France, Italy, Spain, Russia, Poland, Rest of Europe), Asia Pacific (China, India, Japan, South Korea, Australia, ASEAN Countries, Rest of Asia Pacific), Middle East & Africa (UAE, Saudi Arabia, Qatar, South Africa, Rest of Middle East & Africa), Latin America (Brazil, Argentina, Mexico, Colombia, Rest of Latin America). |
Company Profiles | The Next Unit of Computing (NUC) companies are Intel, ASRock, Gigabyte, ZOTAC, Shuttle, Acer, ASUS, HP, Dell, Lenovo, MSI, Fujitsu, Panasonic, Apple, Samsung, HPE, Compulab, Minisforum, Beelink, Chuwi. and Others |
Ans: The Next Unit of Computing (NUC)Market is expected to grow at a CAGR of 12.53% during 2025-2032.
Ans: The Next Unit of Computing (NUC)Market size was valued at USD 2.94 Billion in 2024 and is projected to reach USD 7.56 Billion by 2032
Ans: Key drivers of the NUC market include rising demand for compact, energy-efficient computing solutions across enterprise, gaming, and edge computing applications.
Ans: The “Barebone NUC” segment dominated the Next Unit of Computing (NUC)Market
Ans: North America dominated the Next Unit of Computing (NUC)Market in 2024
Table Of Contents
1. Introduction
1.1 Market Definition & Scope
1.2 Research Assumptions & Abbreviations
1.3 Research Methodology
2. Executive Summary
2.1 Market Snapshot
2.2 Market Absolute $ Opportunity Assessment & Y-o-Y Analysis, 2021–2032
2.3 Market Size & Forecast, By Segmentation, 2021–2032
2.3.1 Market Size by Product
2.3.2 Market Size by Application
2.3.3 Market by End-User
2.3.4 Market By Distribution channel
2.4 Market Share & Bps Analysis by Region, 2024
2.5 Industry Growth Scenarios – Conservative, Likely & Optimistic
2.6 Industry CxO’s Perspective
3. Market Overview
3.1 Market Dynamics
3.1.1 Drivers
3.1.2 Restraints
3.1.3 Opportunities
3.1.4 Key Market Trends
3.2 Industry PESTLE Analysis
3.3 Key Industry Forces (Porter’s) Impacting Market Growth
3.4 Industry Supply Chain Analysis
3.4.1 Raw Material Suppliers
3.4.2 Manufacturers
3.4.3 Distributors/Suppliers
3.4.4 Customers/End-Users
3.5 Industry Life Cycle Assessment
3.6 Parent Market Overview
3.7 Market Risk Assessment
4. Statistical Insights & Trends Reporting
4.1 Overview
4.2 Miniaturization Impact Statistics
4.2.1 Component miniaturization ratio vs. traditional desktops (%)
4.2.2 Reduction in space utilization per NUC deployment (sq. ft.)
4.2.3 Weight reduction trends per unit generation (grams/year)
4.2.4 Average footprint reduction in enterprise deployments (before vs. after NUC)
4.2.5 Share of NUCs used in edge computing vs. central processing (% split)
4.3 Performance-To-Size Efficiency Metrics
4.3.1 Benchmark score per cubic inch (performance density index)
4.3.2 Power draw per unit of computing output (Watt/GFLOP)
4.3.3 Thermal efficiency per cm² of motherboard
4.3.4 Average multitasking capacity by model tier
4.3.5 Boot speed comparison across use cases (media, enterprise, gaming)
4.4 User Experience & Customization Trends
4.4.1 % of users upgrading RAM or storage post-purchase
4.4.2 Average time to full configuration (DIY kits vs. prebuilt)
4.4.3 Heat/noise satisfaction ratings by consumer group
4.4.4 Port usage frequency: HDMI, USB-C, Ethernet, DisplayPort, etc.
4.45 Software compatibility score: OS support diversity index
4.5 Market Expansion & New User Penetration
4.5.1 Share of first-time NUC buyers vs. repeat users (%)
4.5.2 Adoption rate in non-traditional segments (education, art studios, medical labs)
4.5.3 Regional awareness growth index (brand + product awareness %)
4.5.4 Annual conversion rate from laptop to NUC in SME sector
4.5.5 Mobile NUC use cases vs. fixed deployments (ratios & trends)
4.6 Digital Sustainability Indicators
4.6.1 E-waste reduction potential compared to traditional systems
4.6.2 Component reusability rate (%) in modular NUCs
4.6.3 Eco-label adoption among top manufacturers
4.6.4 Mean years to obsolescence (hardware support cycle)
4.6.5 Carbon emissions avoided through remote deployment with NUCs
5. Next Unit of Computing (NUC)Market Segmental Analysis & Forecast, By Product, 2021 – 2032
5.1 Introduction
5.2 Barebone NUC
5.2.1 Key Trends
5.2.2 Market Size & Forecast, 2021 – 2032
5.3 Ready-to-Go NUC
5.3.1 Key Trends
5.3.2 Market Size & Forecast, 2021 – 2032
5.4 NUC Kits
5.4.1 Key Trends
5.4.2 Market Size & Forecast, 2021 – 2032
6. Next Unit of Computing (NUC)Market Segmental Analysis & Forecast, By Application , 2021 – 2032
6.1 Introduction
6.2 Consumer Electronics
6.2.1 Key Trends
6.2.2 Market Size & Forecast, 2021 – 2032
6.3 Industrial Automation
6.3.1 Key Trends
6.3.2 Market Size & Forecast, 2021 – 2032
6.4 Digital Signage
6.4.1 Key Trends
6.4.2 Market Size & Forecast, 2021 – 2032
6.5 Healthcare
6.5.1 Key Trends
6.5.2 Market Size & Forecast, 2021 – 2032
6.6 Gaming
6.6.1 Key Trends
6.6.2 Market Size & Forecast, 2021 – 2032
6.7 Others
6.7.1 Key Trends
6.7.2 Market Size & Forecast, 2021 – 2032
7. Next Unit of Computing (NUC)Market Segmental Analysis & Forecast, By End-User , 2021 – 2032
7.1 Introduction
7.2 Residential
7.2.1 Key Trends
7.2.2 Market Size & Forecast, 2021 – 2032
7.3 Commercial
7.3.1 Key Trends
7.3.2 Market Size & Forecast, 2021 – 2032
7.4 Industrial
7.4.1 Key Trends
7.4.2 Market Size & Forecast, 2021 – 2032
8. Next Unit of Computing (NUC)Market Segmental Analysis & Forecast, By Distribution channel, 2021 – 2032
8.1 Introduction
8.2 Online Stores
8.2.1 Key Trends
8.2.2 Market Size & Forecast, 2021 – 2032
8.3 Offline Retailers
8.3.1 Key Trends
8.3.2 Market Size & Forecast, 2021 – 2032
9. Next Unit of Computing (NUC)Market Segmental Analysis & Forecast By Region, 2021 – 2025
9.1 Introduction
9.2 North America
9.2.1 Key Trends
9.2.2 Next Unit of Computing (NUC)Market Size & Forecast, By Product , 2021 – 2032
9.2.3 Next Unit of Computing (NUC)Market Size & Forecast, By Application , 2021 – 2032
9.2.4 Next Unit of Computing (NUC)Market Size & Forecast, By End-User , 2021 – 2032
9.2.5 Next Unit of Computing (NUC)Market Size & Forecast, By Distribution channel, 2021 – 2032
9.2.6 Next Unit of Computing (NUC)Market Size & Forecast, By Country, 2021 – 2032
9.2.6.1 USA
9.2.6.1.1 Next Unit of Computing (NUC)Market Size & Forecast, By Product , 2021 – 2032
9.2.6.1.2 Next Unit of Computing (NUC)Market Size & Forecast, By Application , 2021 – 2032
9.2.6.1.3 Next Unit of Computing (NUC)Market Size & Forecast, By End-User , 2021 – 2032
9.2.6.1.4 Next Unit of Computing (NUC)Market Size & Forecast, By Distribution channel, 2021 – 2032
9.2.6.2 Canada
9.2.6.2.1 Next Unit of Computing (NUC)Market Size & Forecast, By Product , 2021 – 2032
9.2.6.2.2 Next Unit of Computing (NUC)Market Size & Forecast, By Application , 2021 – 2032
9.2.6.2.3 Next Unit of Computing (NUC)Market Size & Forecast, By End-User , 2021 – 2032
9.2.6.2.4 Next Unit of Computing (NUC)Market Size & Forecast, By Distribution channel, 2021 – 2032
9.3 Europe
9.3.1 Key Trends
9.3.2 Next Unit of Computing (NUC)Market Size & Forecast, By Product , 2021 – 2032
9.3.3 Next Unit of Computing (NUC)Market Size & Forecast, By Application , 2021 – 2032
9.3.4 Next Unit of Computing (NUC)Market Size & Forecast, By End-User , 2021 – 2032
9.3.5 Next Unit of Computing (NUC)Market Size & Forecast, By Distribution channel, 2021 – 2032
9.3.6 Next Unit of Computing (NUC)Market Size & Forecast, By Country, 2021 – 2032
9.3.6.1 Germany
9.3.6.1.1 Next Unit of Computing (NUC)Market Size & Forecast, By Product , 2021 – 2032
9.3.6.1.2 Next Unit of Computing (NUC)Market Size & Forecast, By Application , 2021 – 2032
9.3.6.1.3 Next Unit of Computing (NUC)Market Size & Forecast, By End-User , 2021 – 2032
9.3.6.1.4 Next Unit of Computing (NUC)Market Size & Forecast, By Distribution channel, 2021 – 2032
9.3.6.2 UK
9.3.6.2.1 Next Unit of Computing (NUC)Market Size & Forecast, By Product , 2021 – 2032
9.3.6.2.2 Next Unit of Computing (NUC)Market Size & Forecast, By Application , 2021 – 2032
9.3.6.2.3 Next Unit of Computing (NUC)Market Size & Forecast, By End-User , 2021 – 2032
9.3.6.2.4 Next Unit of Computing (NUC)Market Size & Forecast, By Distribution channel, 2021 – 2032
9.3.6.3 France
9.3.6.3.1 Next Unit of Computing (NUC)Market Size & Forecast, By Product , 2021 – 2032
9.3.6.3.2 Next Unit of Computing (NUC)Market Size & Forecast, By Application , 2021 – 2032
9.3.6.3.3 Next Unit of Computing (NUC)Market Size & Forecast, By End-User , 2021 – 2032
9.3.6.3.4 Next Unit of Computing (NUC)Market Size & Forecast, By Distribution channel, 2021 – 2032
9.3.6.4 Italy
9.3.6.4.1 Next Unit of Computing (NUC)Market Size & Forecast, By Product , 2021 – 2032
9.3.6.4.2 Next Unit of Computing (NUC)Market Size & Forecast, By Application , 2021 – 2032
9.3.6.4.3 Next Unit of Computing (NUC)Market Size & Forecast, By End-User , 2021 – 2032
9.3.6.4.4 Next Unit of Computing (NUC)Market Size & Forecast, By Distribution channel, 2021 – 2032
9.3.6.5 Spain
9.3.6.5.1 Next Unit of Computing (NUC)Market Size & Forecast, By Product , 2021 – 2032
9.3.6.5.2 Next Unit of Computing (NUC)Market Size & Forecast, By Application , 2021 – 2032
9.3.6.5.3 Next Unit of Computing (NUC)Market Size & Forecast, By End-User , 2021 – 2032
9.3.6.5.4 Next Unit of Computing (NUC)Market Size & Forecast, By Distribution channel, 2021 – 2032
9.3.6.6 Russia
9.3.6.6.1 Next Unit of Computing (NUC)Market Size & Forecast, By Product , 2021 – 2032
9.3.6.6.2 Next Unit of Computing (NUC)Market Size & Forecast, By Application , 2021 – 2032
9.3.6.6.3 Next Unit of Computing (NUC)Market Size & Forecast, By End-User , 2021 – 2032
9.3.6.6.4 Next Unit of Computing (NUC)Market Size & Forecast, By Distribution channel, 2021 – 2032
9.3.6.7 Poland
9.3.6.7.1 Next Unit of Computing (NUC)Market Size & Forecast, By Product , 2021 – 2032
9.3.6.7.2 Next Unit of Computing (NUC)Market Size & Forecast, By Application , 2021 – 2032
9.3.6.7.3 Next Unit of Computing (NUC)Market Size & Forecast, By End-User , 2021 – 2032
9.3.6.7.4 Next Unit of Computing (NUC)Market Size & Forecast, By Distribution channel, 2021 – 2032
9.3.6.8 Rest of Europe
9.3.6.8.1 Next Unit of Computing (NUC)Market Size & Forecast, By Product , 2021 – 2032
9.3.6.8.2 Next Unit of Computing (NUC)Market Size & Forecast, By Application , 2021 – 2032
9.3.6.8.3 Next Unit of Computing (NUC)Market Size & Forecast, By End-User , 2021 – 2032
9.3.6.8.4 Next Unit of Computing (NUC)Market Size & Forecast, By Distribution channel, 2021 – 2032
9.4 Asia-Pacific
9.4.1 Key Trends
9.4.2 Next Unit of Computing (NUC)Market Size & Forecast, By Product , 2021 – 2032
9.4.3 Next Unit of Computing (NUC)Market Size & Forecast, By Application , 2021 – 2032
9.4.4 Next Unit of Computing (NUC)Market Size & Forecast, By End-User , 2021 – 2032
9.4.5 Next Unit of Computing (NUC)Market Size & Forecast, By Distribution channel, 2021 – 2032
9.4.6 Next Unit of Computing (NUC)Market Size & Forecast, By Country, 2021 – 2032
9.4.6.1 China
9.4.6.1.1 Next Unit of Computing (NUC)Market Size & Forecast, By Product , 2021 – 2032
9.4.6.1.2 Next Unit of Computing (NUC)Market Size & Forecast, By Application , 2021 – 2032
9.4.6.1.3 Next Unit of Computing (NUC)Market Size & Forecast, By End-User , 2021 – 2032
9.4.6.1.4 Next Unit of Computing (NUC)Market Size & Forecast, By Distribution channel, 2021 – 2032
9.4.6.2 India
9.4.6.2.1 Next Unit of Computing (NUC)Market Size & Forecast, By Product , 2021 – 2032
9.4.6.2.2 Next Unit of Computing (NUC)Market Size & Forecast, By Application , 2021 – 2032
9.4.6.2.3 Next Unit of Computing (NUC)Market Size & Forecast, By End-User , 2021 – 2032
9.4.6.2.4 Next Unit of Computing (NUC)Market Size & Forecast, By Distribution channel, 2021 – 2032
9.4.6.3 Japan
9.4.6.3.1 Next Unit of Computing (NUC)Market Size & Forecast, By Product , 2021 – 2032
9.4.6.3.2 Next Unit of Computing (NUC)Market Size & Forecast, By Application , 2021 – 2032
9.4.6.3.3 Next Unit of Computing (NUC)Market Size & Forecast, By End-User , 2021 – 2032
9.4.6.3.4 Next Unit of Computing (NUC)Market Size & Forecast, By Distribution channel, 2021 – 2032
9.4.6.4 South Korea
9.4.6.4.1 Next Unit of Computing (NUC)Market Size & Forecast, By Product , 2021 – 2032
9.4.6.4.2 Next Unit of Computing (NUC)Market Size & Forecast, By Application , 2021 – 2032
9.4.6.4.3 Next Unit of Computing (NUC)Market Size & Forecast, By End-User , 2021 – 2032
9.4.6.4.4 Next Unit of Computing (NUC)Market Size & Forecast, By Distribution channel, 2021 – 2032
9.4.6.5 Australia
9.4.6.5.1 Next Unit of Computing (NUC)Market Size & Forecast, By Product , 2021 – 2032
9.4.6.5.2 Next Unit of Computing (NUC)Market Size & Forecast, By Application , 2021 – 2032
9.4.6.5.3 Next Unit of Computing (NUC)Market Size & Forecast, By End-User , 2021 – 2032
9.4.6.5.4 Next Unit of Computing (NUC)Market Size & Forecast, By Distribution channel, 2021 – 2032
9.4.6.6 ASEAN Countries
9.4.6.6.1 Next Unit of Computing (NUC)Market Size & Forecast, By Product , 2021 – 2032
9.4.6.6.2 Next Unit of Computing (NUC)Market Size & Forecast, By Application , 2021 – 2032
9.4.6.6.3 Next Unit of Computing (NUC)Market Size & Forecast, By End-User , 2021 – 2032
9.4.6.6.4 Next Unit of Computing (NUC)Market Size & Forecast, By Distribution channel, 2021 – 2032
9.4.6.7 Rest of Asia-Pacific
9.4.6.7.1 Next Unit of Computing (NUC)Market Size & Forecast, By Product , 2021 – 2032
9.4.6.7.2 Next Unit of Computing (NUC)Market Size & Forecast, By Application , 2021 – 2032
9.4.6.7.3 Next Unit of Computing (NUC)Market Size & Forecast, By End-User , 2021 – 2032
9.4.6.7.4 Next Unit of Computing (NUC)Market Size & Forecast, By Distribution channel, 2021 – 2032
9.5 Latin America
9.5.1 Key Trends
9.5.2 Next Unit of Computing (NUC)Market Size & Forecast, By Product , 2021 – 2032
9.5.3 Next Unit of Computing (NUC)Market Size & Forecast, By Application , 2021 – 2032
9.5.4 Next Unit of Computing (NUC)Market Size & Forecast, By End-User , 2021 – 2032
9.5.5 Next Unit of Computing (NUC)Market Size & Forecast, By Distribution channel, 2021 – 2032
9.5.6 Next Unit of Computing (NUC)Market Size & Forecast, By Country, 2021 – 2032
9.5.6.1 Brazil
9.5.6.1.1 Next Unit of Computing (NUC)Market Size & Forecast, By Product , 2021 – 2032
9.5.6.1.2 Next Unit of Computing (NUC)Market Size & Forecast, By Application , 2021 – 2032
9.5.6.1.3 Next Unit of Computing (NUC)Market Size & Forecast, By End-User , 2021 – 2032
9.5.6.1.4 Next Unit of Computing (NUC)Market Size & Forecast, By Distribution channel, 2021 – 2032
9.5.6.2 Argentina
9.5.6.2.1 Next Unit of Computing (NUC)Market Size & Forecast, By Product , 2021 – 2032
9.5.6.2.2 Next Unit of Computing (NUC)Market Size & Forecast, By Application , 2021 – 2032
9.5.6.2.3 Next Unit of Computing (NUC)Market Size & Forecast, By End-User , 2021 – 2032
9.5.6.2.4 Next Unit of Computing (NUC)Market Size & Forecast, By Distribution channel, 2021 – 2032
9.5.6.3 Mexico
9.5.6.3.1 Next Unit of Computing (NUC)Market Size & Forecast, By Product , 2021 – 2032
9.5.6.3.2 Next Unit of Computing (NUC)Market Size & Forecast, By Application , 2021 – 2032
9.5.6.3.3 Next Unit of Computing (NUC)Market Size & Forecast, By End-User , 2021 – 2032
9.5.6.3.4 Next Unit of Computing (NUC)Market Size & Forecast, By Distribution channel, 2021 – 2032
9.5.6.4 Colombia
9.5.6.4.1 Next Unit of Computing (NUC)Market Size & Forecast, By Product , 2021 – 2032
9.5.6.4.2 Next Unit of Computing (NUC)Market Size & Forecast, By Application , 2021 – 2032
9.5.6.4.3 Next Unit of Computing (NUC)Market Size & Forecast, By End-User , 2021 – 2032
9.5.6.4.4 Next Unit of Computing (NUC)Market Size & Forecast, By Distribution channel, 2021 – 2032
9.5.6.5 Rest of Latin America
9.5.6.5.1 Next Unit of Computing (NUC)Market Size & Forecast, By Product , 2021 – 2032
9.5.6.5.2 Next Unit of Computing (NUC)Market Size & Forecast, By Application , 2021 – 2032
9.5.6.5.3 Next Unit of Computing (NUC)Market Size & Forecast, By End-User , 2021 – 2032
9.5.6.5.4 Next Unit of Computing (NUC)Market Size & Forecast, By Distribution channel, 2021 – 2032
9.6 Middle East & Africa
9.6.1 Key Trends
9.6.2 Next Unit of Computing (NUC)Market Size & Forecast, By Product , 2021 – 2032
9.6.3 Next Unit of Computing (NUC)Market Size & Forecast, By Application , 2021 – 2032
9.6.4 Next Unit of Computing (NUC)Market Size & Forecast, By End-User , 2021 – 2032
9.6.5 Next Unit of Computing (NUC)Market Size & Forecast, By Distribution channel, 2021 – 2032
9.6.6 Next Unit of Computing (NUC)Market Size & Forecast, By Country, 2021 – 2032
9.6.6.1 UAE
9.6.6.1.1 Next Unit of Computing (NUC)Market Size & Forecast, By Product , 2021 – 2032
9.6.6.1.2 Next Unit of Computing (NUC)Market Size & Forecast, By Application , 2021 – 2032
9.6.6.1.3 Next Unit of Computing (NUC)Market Size & Forecast, By End-User , 2021 – 2032
9.6.6.1.4 Next Unit of Computing (NUC)Market Size & Forecast, By Distribution channel, 2021 – 2032
9.6.6.2 Saudi Arabia
9.6.6.2.1 Next Unit of Computing (NUC)Market Size & Forecast, By Product , 2021 – 2032
9.6.6.2.2 Next Unit of Computing (NUC)Market Size & Forecast, By Application , 2021 – 2032
9.6.6.2.3 Next Unit of Computing (NUC)Market Size & Forecast, By End-User , 2021 – 2032
9.6.6.2.4 Next Unit of Computing (NUC)Market Size & Forecast, By Distribution channel, 2021 – 2032
9.6.6.3 Qatar
9.6.6.3.1 Next Unit of Computing (NUC)Market Size & Forecast, By Product , 2021 – 2032
9.6.6.3.2 Next Unit of Computing (NUC)Market Size & Forecast, By Application , 2021 – 2032
9.6.6.3.3 Next Unit of Computing (NUC)Market Size & Forecast, By End-User , 2021 – 2032
9.6.6.3.4 Next Unit of Computing (NUC)Market Size & Forecast, By Distribution channel, 2021 – 2032
9.6.6.4 Egypt
9.6.6.4.1 Next Unit of Computing (NUC)Market Size & Forecast, By Product , 2021 – 2032
9.6.6.4.2 Next Unit of Computing (NUC)Market Size & Forecast, By Application , 2021 – 2032
9.6.6.4.3 Next Unit of Computing (NUC)Market Size & Forecast, By End-User , 2021 – 2032
9.6.6.4.4 Next Unit of Computing (NUC)Market Size & Forecast, By Distribution channel, 2021 – 2032
9.6.6.5 South Africa
9.6.6.5.1 Next Unit of Computing (NUC)Market Size & Forecast, By Product , 2021 – 2032
9.6.6.5.2 Next Unit of Computing (NUC)Market Size & Forecast, By Application , 2021 – 2032
9.6.6.5.3 Next Unit of Computing (NUC)Market Size & Forecast, By End-User , 2021 – 2032
9.6.6.5.4 Next Unit of Computing (NUC)Market Size & Forecast, By Distribution channel, 2021 – 2032
9.6.6.6 Rest of Middle East & Africa
9.6.6.6.1 Next Unit of Computing (NUC)Market Size & Forecast, By Product , 2021 – 2032
9.6.6.6.2 Next Unit of Computing (NUC)Market Size & Forecast, By Application , 2021 – 2032
9.6.6.6.3 Next Unit of Computing (NUC)Market Size & Forecast, By End-User , 2021 – 2032
9.6.6.6.4 Next Unit of Computing (NUC)Market Size & Forecast, By Distribution channel, 2021 – 2032
10. Competitive Landscape
10.1 Key Players' Positioning
10.2 Competitive Developments
10.2.1 Key Strategies Adopted (%), By Key Players, 2024
10.2.2 Year-Wise Strategies & Development, 2021 – 2025
10.2.3 Number Of Strategies Adopted By Key Players, 2024
10.3 Market Share Analysis, 2024
10.4 Product /Service & Application Benchmarking
10.4.1 Product /Service Specifications & Features By Key Players
10.4.2 Product /Service Heatmap By Key Players
10.4.3 Application Heatmap By Key Players
10.5 Industry Start-Up & Innovation Landscape
10.6 Key Company Profiles
10.6.1 Intel
10.6.1.1 Company Overview & Snapshot
10.6.1.2 Product /Service Portfolio
10.6.1.3 Key Company Financials
10.6.1.4 SWOT Analysis
10.6.2 ASRock
10.6.2.1 Company Overview & Snapshot
10.6.2.2 Product /Service Portfolio
10.6.2.3 Key Company Financials
10.6.2.4 SWOT Analysis
10.6.3 Gigabyte
10.6.3.1 Company Overview & Snapshot
10.6.3.2 Product /Service Portfolio
10.6.3.3 Key Company Financials
10.6.3.4 SWOT Analysis
10.6.4 ZOTAC
10.6.4.1 Company Overview & Snapshot
10.6.4.2 Product /Service Portfolio
10.6.4.3 Key Company Financials
10.6.4.4 SWOT Analysis
10.6.5 Shuttle
10.6.5.1 Company Overview & Snapshot
10.6.5.2 Product /Service Portfolio
10.6.5.3 Key Company Financials
10.6.5.4 SWOT Analysis
10.6.6 Acer
10.6.6.1 Company Overview & Snapshot
10.6.6.2 Product /Service Portfolio
10.6.6.3 Key Company Financials
10.6.6.4 SWOT Analysis
10.6.7 ASUS
10.6.7.1 Company Overview & Snapshot
10.6.7.2 Product /Service Portfolio
10.6.7.3 Key Company Financials
10.6.7.4 SWOT Analysis
10.6.8 HP
10.6.8.1 Company Overview & Snapshot
10.6.8.2 Product /Service Portfolio
10.6.8.3 Key Company Financials
10.6.8.4 SWOT Analysis
10.6.9 Dell
10.6.9.1 Company Overview & Snapshot
10.6.9.2 Product /Service Portfolio
10.6.9.3 Key Company Financials
10.6.9.4 SWOT Analysis
10.6.10 Lenovo
10.6.10.1 Company Overview & Snapshot
10.6.10.2 Product /Service Portfolio
10.6.10.3 Key Company Financials
10.6.10.4 SWOT Analysis
10.6.11 MSI
10.6.11.1 Company Overview & Snapshot
10.6.11.2 Product /Service Portfolio
10.6.11.3 Key Company Financials
10.6.11.4 SWOT Analysis
10.6.12 Fujitsu
10.6.12.1 Company Overview & Snapshot
10.6.12.2 Product /Service Portfolio
10.6.12.3 Key Company Financials
10.6.12.4 SWOT Analysis
10.6.13 Panasonic
10.6.13.1 Company Overview & Snapshot
10.6.13.2 Product /Service Portfolio
10.6.13.3 Key Company Financials
10.6.13.4 SWOT Analysis
10.6.14 Apple
10.6.14.1 Company Overview & Snapshot
10.6.14.2 Product /Service Portfolio
10.6.14.3 Key Company Financials
10.6.14.4 SWOT Analysis
10.6.15 Samsung
10.6.15.1 Company Overview & Snapshot
10.6.15.2 Product /Service Portfolio
10.6.15.3 Key Company Financials
10.6.15.4 SWOT Analysis
10.6.16 HPE (Hewlett Packard Enterprise)
10.6.16.1 Company Overview & Snapshot
10.6.16.2 Product /Service Portfolio
10.6.16.3 Key Company Financials
10.6.16.4 SWOT Analysis
10.6.17 Compulab
10.6.17.1 Company Overview & Snapshot
10.6.17.2 Product /Service Portfolio
10.6.17.3 Key Company Financials
10.6.17.4 SWOT Analysis
10.6.18 Minisforum
10.6.18.1 Company Overview & Snapshot
10.6.18.2 Product /Service Portfolio
10.6.18.3 Key Company Financials
10.6.18.4 SWOT Analysis
10.6.19 Beelink
10.6.19.1 Company Overview & Snapshot
10.6.19.2 Product /Service Portfolio
10.6.19.3 Key Company Financials
10.6.19.4 SWOT Analysis
10.6.20 Chuwi
10.6.20.1 Company Overview & Snapshot
10.6.20.2 Product /Service Portfolio
10.6.20.3 Key Company Financials
10.6.20.4 SWOT Analysis
11. Analyst Recommendations
11.1 SNS Insider Opportunity Map
11.2 Industry Low-Hanging Fruit Assessment
11.3 Market Entry & Growth Strategy
11.4 Analyst Viewpoint & Suggestions On Market Growth
12. Assumptions
13. Disclaimer
14. Appendix
14.1 List Of Tables
14.2 List Of Figures
An accurate research report requires proper strategizing as well as implementation. There are multiple factors involved in the completion of good and accurate research report and selecting the best methodology to compete the research is the toughest part. Since the research reports we provide play a crucial role in any company’s decision-making process, therefore we at SNS Insider always believe that we should choose the best method which gives us results closer to reality. This allows us to reach at a stage wherein we can provide our clients best and accurate investment to output ratio.
Each report that we prepare takes a timeframe of 350-400 business hours for production. Starting from the selection of titles through a couple of in-depth brain storming session to the final QC process before uploading our titles on our website we dedicate around 350 working hours. The titles are selected based on their current market cap and the foreseen CAGR and growth.
The 5 steps process:
Step 1: Secondary Research:
Secondary Research or Desk Research is as the name suggests is a research process wherein, we collect data through the readily available information. In this process we use various paid and unpaid databases which our team has access to and gather data through the same. This includes examining of listed companies’ annual reports, Journals, SEC filling etc. Apart from this our team has access to various associations across the globe across different industries. Lastly, we have exchange relationships with various university as well as individual libraries.
Step 2: Primary Research
When we talk about primary research, it is a type of study in which the researchers collect relevant data samples directly, rather than relying on previously collected data. This type of research is focused on gaining content specific facts that can be sued to solve specific problems. Since the collected data is fresh and first hand therefore it makes the study more accurate and genuine.
We at SNS Insider have divided Primary Research into 2 parts.
Part 1 wherein we interview the KOLs of major players as well as the upcoming ones across various geographic regions. This allows us to have their view over the market scenario and acts as an important tool to come closer to the accurate market numbers. As many as 45 paid and unpaid primary interviews are taken from both the demand and supply side of the industry to make sure we land at an accurate judgement and analysis of the market.
This step involves the triangulation of data wherein our team analyses the interview transcripts, online survey responses and observation of on filed participants. The below mentioned chart should give a better understanding of the part 1 of the primary interview.
Part 2: In this part of primary research the data collected via secondary research and the part 1 of the primary research is validated with the interviews from individual consultants and subject matter experts.
Consultants are those set of people who have at least 12 years of experience and expertise within the industry whereas Subject Matter Experts are those with at least 15 years of experience behind their back within the same space. The data with the help of two main processes i.e., FGDs (Focused Group Discussions) and IDs (Individual Discussions). This gives us a 3rd party nonbiased primary view of the market scenario making it a more dependable one while collation of the data pointers.
Step 3: Data Bank Validation
Once all the information is collected via primary and secondary sources, we run that information for data validation. At our intelligence centre our research heads track a lot of information related to the market which includes the quarterly reports, the daily stock prices, and other relevant information. Our data bank server gets updated every fortnight and that is how the information which we collected using our primary and secondary information is revalidated in real time.
Step 4: QA/QC Process
After all the data collection and validation our team does a final level of quality check and quality assurance to get rid of any unwanted or undesired mistakes. This might include but not limited to getting rid of the any typos, duplication of numbers or missing of any important information. The people involved in this process include technical content writers, research heads and graphics people. Once this process is completed the title gets uploader on our platform for our clients to read it.
Step 5: Final QC/QA Process:
This is the last process and comes when the client has ordered the study. In this process a final QA/QC is done before the study is emailed to the client. Since we believe in giving our clients a good experience of our research studies, therefore, to make sure that we do not lack at our end in any way humanly possible we do a final round of quality check and then dispatch the study to the client.
Key Segments:
By Product Type
Barebone NUC
Ready-to-Go NUC
NUC Kits
By Application
Consumer Electronics
Industrial Automation
Digital Signage
Healthcare
Gaming
Others
By End-User
Residential
Commercial
Industrial
By Distribution channel
Online Stores
Offline Retailers
Request for Segment Customization as per your Business Requirement: Segment Customization Request
Regional Coverage:
North America
US
Canada
Europe
Germany
UK
France
Italy
Spain
Russia
Poland
Rest of Europe
Asia Pacific
China
India
Japan
South Korea
Australia
ASEAN Countries
Rest of Asia Pacific
Middle East & Africa
UAE
Saudi Arabia
Qatar
South Africa
Rest of Middle East & Africa
Latin America
Brazil
Argentina
Mexico
Colombia
Rest of Latin America
Request for Country Level Research Report: Country Level Customization Request
Available Customization
With the given market data, SNS Insider offers customization as per the company’s specific needs. The following customization options are available for the report:
Detailed Volume Analysis
Criss-Cross segment analysis (e.g. Product X Application)
Competitive Product Benchmarking
Geographic Analysis
Additional countries in any of the regions
Customized Data Representation
Detailed analysis and profiling of additional market players