Delivery Robots Market Size & Trends:
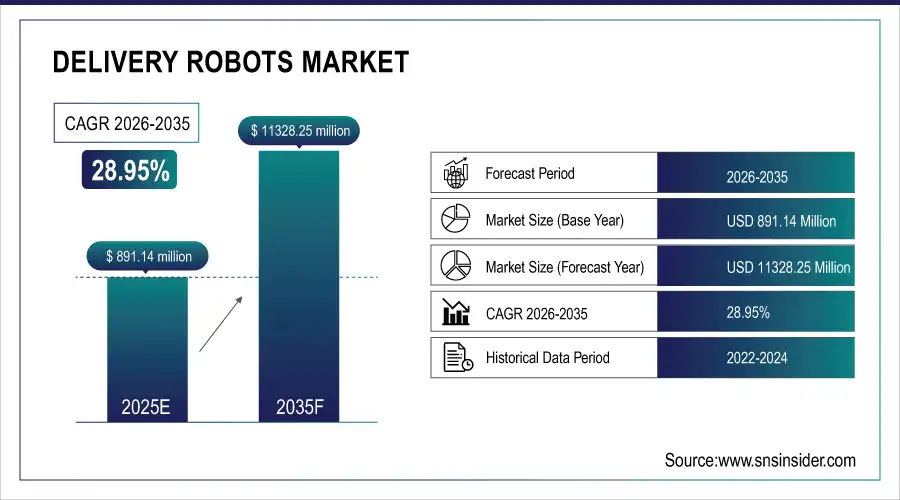
The Delivery Robots Market size was valued at USD 891.14 million in 2025 and is expected to grow at a CAGR of 28.95% to reach USD 11328.25 million by 2035.
Delivery Robots Market trends report the increasing adoption of autonomous last-mile delivery, integration with artificial intelligence (AI) and Internet of Things (IoT) for real-time environment navigation, rising adoption in healthcare and retail sectors for drug and grocery delivery, growth of robot as a service (RAAS) models, and increasing investment in smart cities infrastructure.
Market Size and Growth Projection:
-
Market Size in 2025 USD 891.14 Million
-
Market Size by 2035 USD 11328.25 Million
-
CAGR of 28.95% From 2026 to 2035
-
Base Year 2025
-
Forecast Period 2026-2035
-
Historical Data 2022-2024
To Get more information on Delivery Robots Market- Request Free Sample Report
Key Delivery Robots Market Trends:
-
Rising adoption of autonomous delivery robots driven by urbanization, e-commerce growth, and labor shortages.
-
Increased demand for contactless and timely last-mile delivery across logistics, retail, healthcare, and food sectors.
-
Integration of AI, computer vision, GPS, and sensor fusion for enhanced navigation and reliability in complex urban environments.
-
Growth of emerging markets in Latin America, Middle East, and Southeast Asia, fueled by developing infrastructure and rising delivery needs.
-
Expansion of Robot-as-a-Service (RaaS) models, enabling small and mid-sized businesses to adopt autonomous delivery without heavy capital investment.
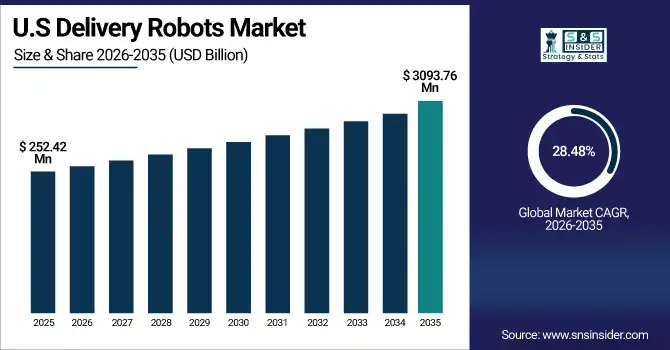
U.S. Delivery Robots Market Size Outlook
The U.S. Delivery Robots Market size was valued at USD 252.42 million in 2025 and is projected to grow at a CAGR of 28.48%, reaching USD 3093.76 million by 2035. The U.S. delivery robots market is witnessing growth due to the growing adoption across universities, hospitals, retail hubs, favorable pilot policies, consumer appetite for speedy deliveries, and increased demand for green logistics solutions replacing short-distance vehicle journeys within urban areas.
Delivery Robots Market Growth Drivers:
-
Urbanization, E-Commerce Growth, and AI Adoption Fuel Rising Demand for Reliable Autonomous Delivery Robot Solutions
Rising need for affordable, contactless, and timely last-mile delivery has been driving the delivery robots market growth. In logistics, labor shortages especially during the peak hours are prompting companies and businesses to go the autonomous delivery way. This demand is further accelerated by rapid urbanization, increased e-commerce penetration, and enhanced consumer expectations for faster delivery. Artificial intelligence, computer vision, GPS, and sensor fusion make navigation accuracy better, thus delivery robots are reliable in highly complex environments of crowded urban areas.
-
Starship Technologies completed over 6 million deliveries across more than 80 global locations by February 2024 covering around 11 million miles and saving nearly 1.8 million kg of CO₂ by replacing car journeys.
Delivery Robots Market Restraints:
-
Lack of Regulations Infrastructure and Weather Challenges Limit Delivery Robot Adoption Across Urban and Rural Areas
The absence of standard regulations and guidelines in developed and developing nations and municipalities is one of the significant restraints in the delivery robots market. Laws are disagreeable, where robots can drive on sidewalks, who will be responsible for accidents, and who will be responsible when a pedestrian is injured, which is hindering large implementation. Moreover, the lack of good infrastructure, including narrow or poorly maintained sidewalks and insufficient signage in most towns and suburbs, prevents the widespread use of delivery robots. Robot performance and reliability are also affected by weather-related challenges, such as rain, snow, and extreme temperatures.
Delivery Robots Market Opportunities:
-
Emerging Markets and RaaS Models Drive Growth of Delivery Robots in Healthcare Retail and Food Sectors
Emerging delivery robot markets gain traction in sectors, such as healthcare, retail, and food delivery, where hygiene and speed are key drivers of opportunity. Latin America and the Middle East and Southeast Asia mostly stir up interest in the smallest markets as the infrastructure is in more of an emerging state. Robot-as-a-Service or RaaS models are also emerging, which allow small and mid-sized businesses to participate in autonomous last-mile delivery without a large capital investment upfront.
-
University and corporate environments launched pilots (Stanford, Berkeley, Naver’s 36-floor "Rookie" bots in Korea), delivering coffee, lunches, and packages across multi-floor buildings.
Delivery Robots Market Segment Analysis:
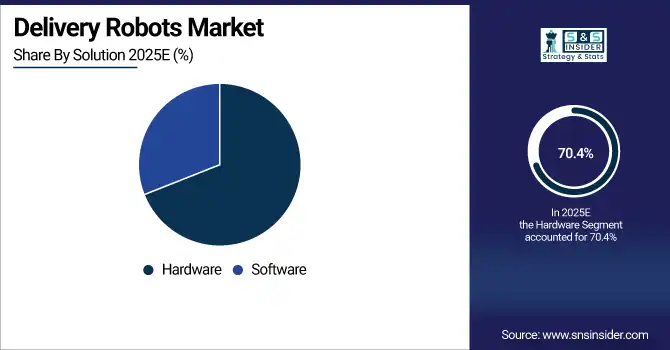
By Solution
The hardware segment led the delivery robots market in 2025, capturing a significant 70.4% share. The sustained dominance is due to the high costs and strategic importance of physical components such as sensors, cameras, wheels, chassis, batteries, and navigation modules. So, these elements comprise the foundation of the operating system of a delivery robot, along with the ability to get to places, the ability to see and avoid things, and the ability to carry a parcel. Manufacturers spent a lot of time making the hardware more durable, versatile across terrains, and economically sound, strengthening its foothold in the market. In the Delivery Robots Market, the software segment is expected to grow at the fastest CAGR from 2026 to 2035. This growth is driven by advancements in AI algorithms, navigation systems, and real-time data analytics that enhance robot autonomy, decision-making, and route optimization. Increasing demand for seamless and intelligent delivery operations is further fueling software adoption.
By Application
In 2025, 4-wheel robots accounted for the largest market share at 41.4%, owing to their optimal balance between stability, speed, and maneuverability. These robots are widely used for urban deliveries due to their ability to navigate sidewalks, ramps, and curbs efficiently while carrying moderate payloads. Their compact design, combined with sufficient load capacity, makes them ideal for food, parcel, and retail deliveries. Companies favor 4-wheel configurations for deployments in cities, university campuses, and commercial zones where smooth terrain allows for consistent and reliable operation. The 6-wheeled robots segment is projected to undergo the fastest CAGR over 2026-2035, owing to the higher surface adaptability and increase in the stability of payload. Such robots are gaining traction in suburbs and semi-urban spaces where the roads are bumpy or unpaved. This also makes them better suited for long-range deliveries, healthcare or industrial use cases by improving their confidence to traverse through difficult environments while becoming more durable.
By Load Capacity
The delivery robots market share in 2025 was led by the Up to 10 Kg segment, which accounted for 45.3% of the market, owing to the broad application in food delivery, small parcel logistics, and document transport. These small robots are suitable for these kind of deliveries over short distances in urban areas as part of campus, residential neighborhoods all the way up to business parks. Their compact size, lower energy usage, and easier deployment makes them very appealing to last-mile delivery solutions. Its inexpensive nature and the growing consumer expectations of fast and contactless delivery, is why businesses and delivery platforms prefer this category. Over the forecast period of 2026-2035, the More than 50 Kg segment is expected to register the fastest CAGR as industries, such as retail warehousing, industrial parks, and healthcare supply chains are looking for higher payload capacity for bulk deliveries. The heavy-duty capabilities of these robots, which carry larger payloads and medical supplies, reduce reliance on human labor and makes delivery in complicated environments and over extended pathways more effective.
By End-User
The delivery robots market was dominated by Food & Beverage segment that accounted for a revenue share of 38.3% in 2025, owing to the increasing demand for non-contact food delivery in urban and campus environments. So, mysterious though it may seem, autonomous delivery robots are now a reality for many restaurants, cafes, and quick-service outlets that have had to implement these robots to accommodate short-distance, time-sensitive orders. The Healthcare segment is expected to grow at the highest CAGR during the projected period of 2026-2035, due to the increasing requirement of safe, reliable, and efficient method of intra-facility transport of medicines, lab samples, and medical supplies. In an effort to reduce reliance on human labor, improve efficiency, and minimize pathogen exposure in critical and sterile areas, more and more hospitals and clinics are taking the principles of autonomous driving and applying them to medical logistics.
Delivery Robots Market Regional Analysis:
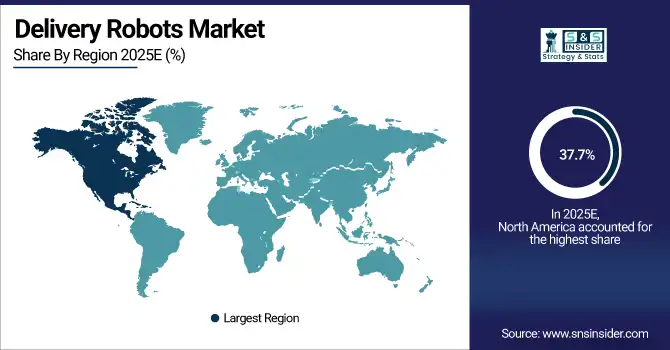
North America Delivery Robots Market Insights
North America holds the largest market for delivery robots, accounting for a whopping share of 37.7% in 2025, attributed to the early adoption of technology, sound infrastructure, and an increased number of key delivery robot developers. High consumer demand for contactless and fast deliveries in sectors, such as food, retail, and healthcare contributes to the opportunity within the region. This growth also supported by deployment of large amount simultaneously in urban and campus and commercial environments. The growing labor shortage in logistics across the region and businesses focusing on automating last-mile delivery are some of the most significant factors contributing to the growth of this industry. The North American delivery robots market was led by the U.S. in 2025, owing to the presence of significant number of pilot programs, solid technological enablement, growing demand for labor automation and supportive regulations for autonomous mobility.
Get Customized Report as per Your Business Requirement - Enquiry Now
Asia Pacific Delivery Robots Market Insights
The delivery robots market in Asia Pacific is projected to grow with the fastest CAGR of 30.05% over 2026-2035, owing to rapid urbanization, high e-commerce penetration, and increasing focus on automation. With many people to deliver to along with a desire for a fast, no-contact delivery, the area is ripe for the pickin' for autonomous delivery. Large investments into smart infrastructure supported by robotics, artificial intelligence and 5G connectivity are expediting deployment in retail, health care and food. Furthermore, increasing acceptance of robotic solutions for last-mile logistics is accelerating commercial rollout in developed and developing cities. Asia pacific delivery robots market was dominated by China owing to rapid tech adoption in urban areas, its strong base for robotics manufacturing, the growth of e-commerce and large-scale deployments across retail and smart logistics sectors in the country.
Europe Delivery Robots Market Insights
Europe had a major role in the delivery robots market in 2025, bolstered by regulatory support, developed urban infrastructure, and growing interest in sustainable last-mile delivery solutions. This has been especially true in pedestrian-oriented cities where pilot programs have been implemented continent-wide in retail, food and healthcare. Active robot deployments, favorable legislation, and high consumer acceptance of autonomous delivery service made the U.K. the key market for the European delivery robot business, serving as an innovation and commercialization hub.
Latin America (LATAM) and Middle East & Africa (MEA) Delivery Robots Market Insights
The Middle East & Africa and Latin America delivery robots markets had received benefit from early development but were not poised for dramatic growth until 2025. Both regions are witnessing pilot deployments driven by increasing urbanization, e-commerce activities and interest in smart logistics.
Leading Delivery Robots Companies are:
-
Amazon Robotics
-
Nuro Inc
-
Kiwibot
-
Refraction AI
-
JD Logistics
-
Robby Technologies
-
Ottonomy.IO
-
TeleRetail
Competitive Landscape for Delivery Robots Market:
Nuro Inc. is a leading developer of autonomous delivery robots focused on last-mile logistics for groceries, food, and retail. Leveraging advanced AI, computer vision, and sensor technologies, Nuro provides contactless, efficient, and reliable delivery solutions. Its innovations and partnerships enable scalable, safe, and cost-effective autonomous operations in urban and suburban environments.
-
In February 2025, Nuro partnered with Arm to integrate Automotive Enhanced silicon into its third-generation delivery robot (“R3”), improving efficiency and doubling cargo capacity.
Starship Technologies is a pioneer in autonomous delivery robots, specializing in last-mile solutions for groceries, food, and parcel delivery. Its robots use AI, computer vision, and GPS navigation to operate safely in urban environments. Starship’s scalable, contactless delivery platform enhances efficiency, reduces labor dependence, and meets growing consumer demand for fast, reliable deliveries.
-
In October 2024, Starship Technologies partnership with Bolt launched in Tallinn, enabling eco-friendly grocery deliveries via Bolt Food app to 180,000 users.
|
Report Attributes |
Details |
|---|---|
| Market Size in 2025 | USD 891.14 Million |
| Market Size by 2035 | USD 11328.25 Million |
| CAGR | CAGR of 28.95% From 2026 to 2035 |
| Base Year | 2025 |
| Forecast Period | 2026-2035 |
| Historical Data | 2022-2024 |
|
Report Scope & Coverage |
Market Size, Segments Analysis, Competitive Landscape, Regional Analysis, DROC & SWOT Analysis, Forecast Outlook |
|
Key Segments |
• By Solution (Hardware and Software) |
|
Regional Analysis/Coverage |
North America (US, Canada), Europe (Germany, UK, France, Italy, Spain, Russia, Poland, Rest of Europe), Asia Pacific (China, India, Japan, South Korea, Australia, ASEAN Countries, Rest of Asia Pacific), Middle East & Africa (UAE, Saudi Arabia, Qatar, South Africa, Rest of Middle East & Africa), Latin America (Brazil, Argentina, Mexico, Colombia, Rest of Latin America). |
|
Company Profiles |
Starship Technologies, Amazon Robotics, Nuro Inc., Kiwibot, BoxBot, Refraction AI, JD Logistics, Robby Technologies, Ottonomy.IO, and TeleRetail (Aito). |
Get in Touch
