Nitrile Gloves Market Size Analysis:

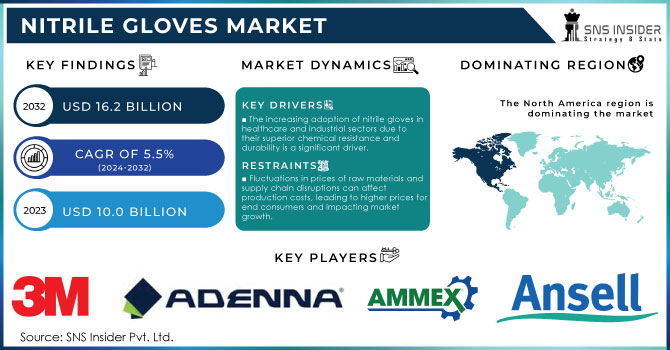
The Nitrile Gloves Market Size was valued at USD 10.55 billion in 2024, and is expected to reach USD 16.19 billion by 2032, and grow at a CAGR of 5.50% over the forecast period 2025-2032.

Nitrile Gloves Market Revenue Analysis

Get More Information on Nitrile Gloves Market - Request Sample Report

The nitrile gloves market is evolving due to rising PPE awareness, strict regulatory standards, and advanced manufacturing technologies. Demand is strong in healthcare, food processing, and industrial applications, as nitrile gloves are hypoallergenic, durable, and more resistant than latex. Competition, particularly from Chinese manufacturers, highlights supply chain challenges for U.S. producers. Innovation is shaping growth, with launches like Kimberly-Clark Europe’s new-generation nitrile gloves in January 2024, offering improved protection and sensitivity. However, supply chain vulnerabilities, raw material price fluctuations, and production downtimes remain key hurdles. Manufacturers are responding through automation, alternative sourcing, and collaborations with governments to strengthen domestic production. Such initiatives, combined with technological advancements, are stabilizing supply while driving the industry toward high-performance, tailored PPE solutions that ensure safety and meet global demand.

Key Nitrile Gloves Market Trends

  • Rising adoption of biodegradable nitrile gloves as sustainability concerns drive eco-friendly alternatives.

  • Increasing use of nitrile gloves in automotive and electronics sectors for protection against oils and solvents.

  • Expansion of powder-free nitrile gloves driven by allergy concerns and stricter regulatory bans on powdered variants.

  • Growing preference for colored nitrile gloves to enable workplace differentiation and compliance in cleanroom settings.

  • Surge in single-use nitrile gloves demand in e-commerce packaging and logistics operations.

  • Rising popularity of textured nitrile gloves offering enhanced grip for industrial and laboratory tasks.

  • Development of lightweight, thinner nitrile gloves improving comfort without compromising strength.

  • Integration of smart glove technologies with sensors for healthcare and industrial monitoring applications.

Nitrile Gloves Market Drivers

  • The increasing adoption of nitrile gloves in healthcare and industrial sectors due to their superior chemical resistance and durability is a significant driver.

The healthcare and industrial sectors are the leading consumers of nitrile gloves due to their need for strong protection against contamination and chemical exposure. In healthcare, nitrile gloves are preferred for their puncture resistance, reducing infection risks in surgeries and intensive care. Industrial use spans chemicals, food processing, and manufacturing, where gloves must resist oils and solvents. Unlike latex, nitrile is hypoallergenic and suitable for prolonged wear. Regulations, such as OSHA standards in the U.S. and the European PPE Directive, mandate nitrile glove use in critical environments to ensure worker safety.

  • Innovations such as enhanced tactile sensitivity, textured fingertips, and ergonomic designs are driving the adoption of nitrile gloves.

Technology has significantly advanced nitrile gloves, enhancing comfort, dexterity, and protection. Material science has enabled ultra-thin gloves that match thicker ones in safety while offering superior tactile sensitivity, vital in healthcare and laboratory precision tasks. Features like textured fingertips and special coatings improve grip for delicate procedures, while ergonomic designs reduce hand fatigue during prolonged use. These innovations highlight the shift toward high-performance gloves that meet both safety and usability standards. Beyond healthcare, advancements are expanding nitrile glove applications into electronics manufacturing, cleanrooms, and other specialized fields, reflecting broader market adoption.

Nitrile Gloves Market Restraints

  • Fluctuations in prices of raw materials and supply chain disruptions can affect production costs, leading to higher prices for end consumers and impacting market growth.

Nitrile glove production relies on acrylonitrile and butadiene, petrochemical derivatives tied to crude oil prices, making the market highly vulnerable to raw material cost fluctuations. Geopolitical tensions, natural disasters, or blockades can disrupt supply chains, causing abrupt price surges. Recent global stresses, including the COVID-19 pandemic and trade disputes, led to shortages and rising costs, directly increasing glove production expenses while squeezing profit margins. Such volatility challenges market growth and stability, as soaring consumer prices may discourage both investment and innovation, creating long-term uncertainty for manufacturers and limiting competitiveness in the global market.

Nitrile Gloves Market Opportunities

  • Growing awareness of hygiene and safety in sectors such as food processing, beauty, and electronics manufacturing presents opportunities for market expansion.

Rising hygiene and safety awareness has expanded nitrile glove use beyond healthcare and industry into food processing, beauty, and electronics. In food handling, nitrile gloves prevent contamination and avoid latex-related allergies, making them ideal for chefs and workers requiring prolonged wear. In beauty and personal care, they protect against chemicals used in hair coloring, bleaching, and nail treatments. Electronics manufacturing also drives demand, requiring low-particulate, ESD-safe gloves for cleanroom environments. By diversifying into these non-traditional sectors, manufacturers can capitalize on growing demand for specialized, high-quality gloves, ensuring broader market expansion and strengthening industry presence across multiple applications.

Nitrile Gloves Market Challenge

  • The disposal of nitrile gloves poses environmental challenges due to their non-biodegradable nature.

Nitrile gloves, though strong and protective, contribute heavily to plastic waste as they do not degrade naturally. The healthcare sector alone disposes of millions daily, straining landfills and endangering ecosystems if mismanaged. Industrial gloves, often contaminated with hazardous substances, require complex disposal methods to prevent environmental harm. Rising global usage has intensified scrutiny from environmental agencies, prompting exploration of biodegradable alternatives and recycling initiatives. However, these solutions remain in early stages, facing challenges of cost, performance, and regulatory approval. Without scalable sustainable practices in manufacturing and disposal, nitrile gloves pose an escalating environmental concern despite their essential role in safety and hygiene.

Nitrile Gloves Market Segment Highlights

  • By Type

In 2023, the powder-free segment dominated and accounted for a market share of around 70% in the nitrile gloves market. The demand for powder-free nitrile gloves is growing mainly because of their applicability in health and food industries that are highly vulnerable to contamination risks. Powder-free gloves avoid allergic reactions due to powder, which acts as a safe factor for medical people and patients. For example, in surgery, where accuracy and asepsis are the utmost concern, hospitals now opt for powder-free gloves to prevent the entry of dust into sterile fields. Powder-free gloves are preferred by food processing industries as well because the products manufactured for consumption require zero tolerance for contamination. The standards of regulation have followed this trend as it will also work towards minimizing the risk of contamination. This is part of the broader shift across sectors looking to safe, comfortable, and regulatory-compliant choices.

  • By Grade

In 2023, the medical-grade segment dominated and accounted for a maximum market share for nitrile gloves, approximately about 60%. This dominance in the market of nitrile gloves has been mainly contributed by the increased demand for high-quality protective equipment due to heightened awareness surrounding infection control and safety protocols among healthcare service providers. These are high-grade nitrile gloves meant for intense barrier protection purposes, mainly in hospitals, clinics, and laboratories. For example, when performing surgeries and conducting medical checkups, the healthcare worker completely relies on these nitrile gloves to avoid contaminating the patients and consequently keep them safe as well. The COVID-19 pandemic also accelerated the need for high-grade medical gloves because health institutions looked forward to achieving maximum safety for their staff and patients. Strict regulations governing the healthcare sector, including medical-grade products and hygiene, remain the biggest value-adding factor to the nitrile gloves market segment with the leading share.

  • By Texture

In 2023, the micro-roughened segment dominated and accounted for a significant market share in the nitrile gloves market, of about 55%. This is because of their ability to match comfort with functionality, making micro-roughened gloves the perfect product for many applications, especially in the health and industrial sectors. A textured surface improves grip and control, which are integral factors when a person is required to handle medical instruments and conduct sensitive procedures. For instance, for surgery, in which gloves should be micro-roughened and possess a very good touch without allowing you to slip, these are the best nitrile gloves because they can provide delicate sensitivity without sacrificing grip. The most favorite in the automotive and manufacturing sectors is this type of glove as people handle oily or wet parts most of the time; such nitrile gloves protect their hands while working. Because of flexibility and performance, these can be termed the most favorite nitrile gloves in the whole world and occupy the first position in the market.

  • By End-use

The medical and healthcare segment dominated the nitrile gloves market, accounting for a market share of approximately 65% in 2023. This is due to a greater need for infection control and safety measures in healthcare centers, especially after the COVID-19 pandemic. Due to enhanced protection against pathogens and chemical substances, nitrile gloves have become the first choice for doctors during surgeries, check-ups, and patient handling. By using nitrile gloves for surgical procedures, for instance, the instances of cross-contamination are significantly reduced while offering a clean environment that ensures the safety to the patient. Protection equipment demands for healthcare facilities are high and adhere to strict regulatory standards, which fuel the demand for high-quality nitrile gloves. Continuous innovation in glove technology, such as enhanced tactile sensitivity and comfort, is also assisting in the strong dominance of the segment, thereby emphasizing the importance of this protection for not just the healthcare workers but also the patients.

Nitrile Gloves Market Regional Analysis

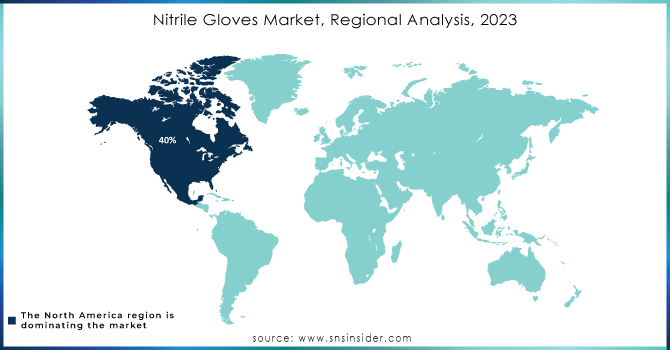
North America Nitrile Gloves Market Insights

In 2023, North America dominated the nitrile gloves market with an approximate market share of around 40%. This is because of the strong healthcare infrastructure present in the region and strict standards related to safety and hygiene. Nitrile gloves have witnessed great growth rates both in the United States and Canada on account of intense infection control awareness among medical settings, laboratories, and food production places. For example, in hospitals and healthcare providers, there was the emphasis on personal protective equipment following the outbreak of the COVID-19 pandemic, which has drawn high demand for procurement. In turn, this demand has propelled the growth of the market. The presence of key manufacturers and suppliers in the region has also made the availability of high-quality nitrile gloves easier, all of which advocate for market supremacy. Advanced healthcare technologies and safety measures taken in advance again advance North America's dominant position in the nitrile gloves market.

Asia Pacific Nitrile Gloves Market Insights

Moreover, in 2023, Asia-Pacific emerged as the fastest-growing region in the nitrile gloves market, projected at around 12% compound annual growth rate. This is mainly driven by industrialization, which is growing more rapidly in the newly developing healthcare Industry, and a growing awareness of hygiene standards in countries such as China, India, and Southeast Asian nations. The region has significant investments in healthcare infrastructure particularly in the aftermath of the global pandemic, which has increased demand for personal protective equipment such as nitrile gloves. For instance, India invested in expanding its capacity to manufacture both local and foreign demand, becoming an important player in the global supply chain of nitrile gloves. Among key factors, growth in the food processing and automotive sectors has led to increased consumption of nitrile gloves in Asia-Pacific, mainly due to a rise in demand from businesses to standardize safety and protect their workforce. All this makes Asia-Pacific a dynamic and highly growing market for nitrile gloves.

Europe Nitrile Gloves Market Insights

The Europe nitrile gloves market is experiencing steady growth, driven by stringent workplace safety regulations, rising healthcare expenditure, and the growing need for hygiene in food processing and pharmaceuticals. The region’s strong emphasis on medical standards, supported by the European Union’s PPE Directive, ensures consistent demand across hospitals, laboratories, and clinics. Additionally, industrial adoption is expanding in automotive, electronics, and chemical sectors, where chemical-resistant gloves are essential. The market is also witnessing a shift toward sustainable and biodegradable glove solutions, as environmental concerns rise. Ongoing innovation, coupled with increasing domestic production capacity, is expected to strengthen Europe’s market position.

Latin America Nitrile Gloves Market Insights

The Latin American nitrile gloves market is expanding due to increased healthcare awareness, public health initiatives, and growth in industries like food processing, chemicals, and manufacturing. Governments are enhancing healthcare infrastructure, which boosts the adoption of medical-grade gloves in hospitals and clinics. Rising concern over hygiene standards in food and beverage sectors also supports demand. However, the region remains import-dependent, making it vulnerable to supply chain fluctuations and global price volatility. With ongoing investments in healthcare and industrial safety, along with gradual expansion of local manufacturing capabilities, the market is expected to grow steadily in the coming years.

Middle East & Africa Nitrile Gloves Market Insights

The Middle East & Africa nitrile gloves market is gaining momentum, fueled by rapid urbanization, expanding healthcare services, and stricter workplace safety regulations in industries such as oil & gas, chemicals, and construction. The healthcare sector remains the leading consumer, with growing demand for infection control and patient safety driving glove adoption. Import reliance is high, but government initiatives to strengthen domestic manufacturing and diversify supply chains are emerging. Additionally, rising awareness of hygiene in food handling and hospitality sectors is creating new opportunities. While cost challenges persist, growing healthcare investments and regulatory support are expected to drive market expansion.

Nitrile-Gloves-Market-Regional-Analysis-2023

Get Customized Report as per Your Business Requirement - Request For Customized Report

Competitive Landscape for Nitrile Gloves Market

Ansell Healthcare, established in 1905 and headquartered in Richmond, Australia, is a global leader in personal protective equipment. The company operates across two main segments: Healthcare and Industrial. Its nitrile glove portfolio is designed for superior puncture resistance, chemical protection, and extended comfort in surgical, laboratory, and industrial environments. Ansell’s products are trusted worldwide for high performance, safety compliance, and innovation. By continuously expanding sustainable and ergonomic designs, the company supports healthcare professionals, first responders, and industrial workers with reliable, protective solutions.

  • In May 2024, Ansell was recognized as an ESG Industry Top-Rated Company by Morningstar Sustainalytics, while its Kovai, India plant received a platinum IGBC rating, highlighting its focus on sustainability and environmentally responsible manufacturing practices.

Kimberly-Clark Corporation was founded in 1872 and is headquartered in Irving, Texas. Kimberly-Clark Corporation is a global leader in personal health and hygiene solutions. Through its professional division, the company delivers high-quality nitrile gloves under the Kimtech brand, designed for laboratories, cleanrooms, and healthcare environments. These gloves are engineered to provide exceptional comfort, ergonomic fit, and reliable chemical resistance while reducing the risk of cross-contamination. Kimberly-Clark emphasizes sustainability through its RightCycle program, offering glove recycling solutions that support its broader environmental and workplace safety initiatives globally.

  • In May 2024, Kimberly-Clark’s Kimtech Polaris Nitrile Exam Gloves became the first PPE product to earn the ACT Environmental Impact Factor Label from My Green Lab, strengthening its position in sustainable laboratory protective equipment.

Top Glove Corporation, established in 1991 and headquartered in Shah Alam, Malaysia, is the world’s largest glove manufacturer. With a vast global presence, the company produces a diverse portfolio of nitrile, latex, and vinyl gloves, serving healthcare, food processing, electronics, and industrial sectors in over 190 countries. Its nitrile gloves are valued for durability, comfort, and allergy-free features, making them highly sought after in medical and industrial settings. Top Glove continues to innovate, focusing on sustainability, capacity expansion, and next-generation protective glove technologies.

  • In July 2025, Top Glove launched three next-generation gloves: chemotherapy-tested nitrile gloves, halogen-free cleanroom gloves, and biodegradable Biogreen gloves, addressing rising demands for safety, contamination control, and sustainability across medical, cleanroom, and industrial markets worldwide.

Nitrile Gloves Market Key Players

  • 3M (3M Glucose Monitoring System, 3M Lancing Device)

  • Adenna LLC (Adenna Glucose Test Strips, Adenna Glucometer)

  • Ammex Corporation (Ammex Glucose Test Strips, Ammex Glucometer)

  • Ansell Healthcare (Ansell Glucose Testing Supplies, Ansell Glucometer)

  • Atrium Medical Care (Atrium Glucose Monitoring Devices, Atrium Blood Glucose Test Strips)

  • Cardinal Health (Cardinal Health Glucose Monitoring System, Cardinal Health Blood Glucose Test Strips)

  • Dynarex Corporation (Dynarex Glucose Test Strips, Dynarex Glucometer)

  • Hartalega Holdings Berhad(Hartalega Glucose Monitoring System, Hartalega Test Strips)

  • Honeywell International Inc (Honeywell Glucose Monitoring Device, Honeywell Test Strips)

  • Kimberly Clark (Kimberly Clark Glucose Test Strips, Kimberly Clark Glucometer)

  • McKesson Corporation (McKesson Glucose Monitoring System, McKesson Blood Glucose Test Strips)

  • Medline Industries (Medline Glucose Monitoring Devices, Medline Test Strips)

  • Mercator Medical S.A (Mercator Glucose Test Strips, Mercator Glucometer)

  • Shield Scientific B.V. (Shield Glucose Monitoring Devices, Shield Blood Glucose Test Strips)

  • Supermax Corporation Berhad (Supermax Glucose Monitoring System, Supermax Test Strips)

  • Supermax Healthcare Limited (Supermax Glucometer, Supermax Blood Glucose Test Strips)

  • Top Glove Corporation (Top Glove Glucose Monitoring System, Top Glove Test Strips)

  • Unigloves Limited (Unigloves Glucose Testing Supplies, Unigloves Glucometer)  

Nitrile Gloves Market Report Scope:

Report Attributes Details
Market Size in 2024 US$ 10.55 Billion
Market Size by 2032 US$ 16.19 Billion
CAGR CAGR of 5.50% From 2024 to 2032
Base Year 2024
Forecast Period 2025-2032
Historical Data 2021-2023
Report Scope & Coverage Market Size, Segments Analysis, Competitive  Landscape, Regional Analysis, DROC & SWOT Analysis, Forecast Outlook
Key Segments •By Type (Powdered, Powder-free)
•By Grade (Medical, Industrial, Food)
•By Texture (Smooth, Micro-roughened, Aggressively Textured)
•By End-use (Medical & Healthcare, Food & Beverage, Automotive, Oil & Gas, Construction, Chemical, Pharmaceutical, Metals & Machinery, Others)
Regional Analysis/Coverage North America (US, Canada, Mexico), Europe (Eastern Europe [Poland, Romania, Hungary, Turkey, Rest of Eastern Europe] Western Europe] Germany, France, UK, Italy, Spain, Netherlands, Switzerland, Austria, Rest of Western Europe]), Asia Pacific (China, India, Japan, South Korea, Vietnam, Singapore, Australia, Rest of Asia Pacific), Middle East & Africa (Middle East [UAE, Egypt, Saudi Arabia, Qatar, Rest of Middle East], Africa [Nigeria, South Africa, Rest of Africa], Latin America (Brazil, Argentina, Colombia, Rest of Latin America)
Company Profiles

3M, Adenna LLC, Ammex Corporation, Ansell Healthcare, Atrium Medical Care, Cardinal Health, Dynarex Corporation, Hartalega Holdings Berhad, Honeywell International Inc, Kimberly Clark, McKesson Corporation, Medline Industries, Mercator Medical S.A, Shield Scientific B.V., Supermax Corporation Berhad, Supermax Healthcare Limited, Top Glove Corporation, and Unigloves Limited

Table Of Contents

1. Introduction

1.1 Market Definition & Scope

 1.2 Research Assumptions & Abbreviations

 1.3 Research Methodology

2. Executive Summary

2.1 Market Snapshot

 2.2 Market Absolute $ Opportunity Assessment & Y-o-Y Analysis, 2021–2032

 2.3 Market Size & Forecast, By Segmentation, 2021–2032

  2.3.1 Market Size By Type

         2.3.2 Market Size By Grade

  2.3.3 Market Size By Texture

         2.3.4 Market Size By End-use

 2.4 Market Share & Bps Analysis By Region, 2024

 2.5 Industry Growth Scenarios – Conservative, Likely & Optimistic

 2.6 Industry CxO’s Perspective

3. Market Overview

3.1 Market Dynamics

  3.1.1 Drivers

  3.1.2 Restraints

  3.1.3 Opportunities

  3.1.4 Key Market Trends

 3.2 Industry PESTLE Analysis

 3.3 Key Industry Forces (Porter’s) Impacting Market Growth

 3.4 Industry Supply Chain Analysis

  3.4.1 Raw Material Suppliers

  3.4.2 Manufacturers

  3.4.3 Distributors/Suppliers

  3.4.4 Customers/End-Users

 3.5 Industry Life Cycle Assessment

 3.6 Parent Market Overview

 3.7 Market Risk Assessment

4. Statistical Insights & Trends Reporting

4.1 Pricing Analysis & Forecast

  4.1.1 Overview

  4.1.2 Pricing Analysis & Forecast By Type, 2021–2032

  4.1.3 Price Benchmarking By Key Players, 2024

 4.2 Regulatory Landscape

  4.2.1 Overview

  4.2.2 Regulatory Trends By Key Countries

  4.2.3 Regulatory Outlook By Type

 4.3 Trade Analysis

  4.3.1 Overview

  4.3.2 Import Analysis (Value & Volume), By Country, 2021–2024

  4.3.3 Export Analysis (Value & Volume), By Country, 2021–2024

  4.3.4 Major Importing Countries

  4.3.5 Major Exporting Countries

5. Nitrile Gloves Market Segmental Analysis & Forecast, By Type, 2021 – 2032, Value (USD Billion) & Volume

5.1 Introduction

 5.2 Powdered

  5.2.1 Key Trends

  5.2.2 Market Size & Forecast, 2021 – 2032

 5.3 Powder-free

  5.3.1 Key Trends

  5.3.2 Market Size & Forecast, 2021 – 2032

6. Nitrile Gloves Market Segmental Analysis & Forecast, By Grade, 2021 – 2032, Value (USD Billion) & Volume

    6.1 Introduction

 6.2 Medical

  6.2.1 Key Trends

  6.2.2 Market Size & Forecast, 2021 – 2032

 6.3 Industrial

  6.3.1 Key Trends

  6.3.2 Market Size & Forecast, 2021 – 2032

 6.4 Food

  6.4.1 Key Trends

  6.4.2 Market Size & Forecast, 2021 – 2032

7. Nitrile Gloves Market Segmental Analysis & Forecast, By Texture, 2021 – 2032, Value (USD Billion) & Volume

    7.1 Introduction

 7.2 Smooth

  7.2.1 Key Trends

  7.2.2 Market Size & Forecast, 2021 – 2032

 7.3 Micro-roughened

  7.3.1 Key Trends

  7.3.2 Market Size & Forecast, 2021 – 2032

 7.4 Aggressively Textured

  7.4.1 Key Trends

  7.4.2 Market Size & Forecast, 2021 – 2032

8. Nitrile Gloves Market Segmental Analysis & Forecast, By End-use, 2021 – 2032, Value (USD Billion) & Volume

    8.1 Introduction

 8.2 Medical & Healthcare

  8.2.1 Key Trends

  8.2.2 Market Size & Forecast, 2021 – 2032

 8.3 Food & Beverage

  8.3.1 Key Trends

  8.3.2 Market Size & Forecast, 2021 – 2032

 8.4 Automotive

  8.4.1 Key Trends

  8.4.2 Market Size & Forecast, 2021 – 2032

 8.5 Oil & Gas

  8.5.1 Key Trends

  8.5.2 Market Size & Forecast, 2021 – 2032

 8.6 Construction

         8.6.1 Key Trends

  8.6.2 Market Size & Forecast, 2021 – 2032

     8.7 Chemical

  8.7.1 Key Trends

  8.7.2 Market Size & Forecast, 2021 – 2032

 8.8 Pharmaceutical

  8.8.1 Key Trends

  8.8.2 Market Size & Forecast, 2021 – 2032

 8.9 Metals & Machinery

  8.9.1 Key Trends

  8.9.2 Market Size & Forecast, 2021 – 2032

 8.10 Others

         8.10.1 Key Trends

  8.10.2 Market Size & Forecast, 2021 – 2032

9. Nitrile Gloves Market Segmental Analysis & Forecast By Region, 2021 – 2025, Value (USD Billion) & Volume

9.1 Introduction

9.2 North America

 9.2.1 Key Trends

 9.2.2 Nitrile Gloves Market Size & Forecast, By Type, 2021 – 2032

 9.2.3 Nitrile Gloves Market Size & Forecast, By Grade, 2021 – 2032

 9.2.4 Nitrile Gloves Market Size & Forecast, By Texture, 2021 – 2032

 9.2.5 Nitrile Gloves Market Size & Forecast, By End-use, 2021 – 2032

 9.2.6 Nitrile Gloves Market Size & Forecast, By Country, 2021 – 2032

  9.2.6.1 USA

   9.2.6.1.1 Nitrile Gloves Market Size & Forecast, By Type, 2021 – 2032

   9.2.6.1.2 Nitrile Gloves Market Size & Forecast, By Grade, 2021 – 2032

   9.2.6.1.3 Nitrile Gloves Market Size & Forecast, By Texture, 2021 – 2032

   9.2.6.1.4 Nitrile Gloves Market Size & Forecast, By End-use, 2021 – 2032

  9.2.6.2 Canada

   9.2.6.2.1 Nitrile Gloves Market Size & Forecast, By Type, 2021 – 2032

   9.2.6.2.2 Nitrile Gloves Market Size & Forecast, By Grade, 2021 – 2032

   9.2.6.2.3 Nitrile Gloves Market Size & Forecast, By Texture, 2021 – 2032

   9.2.6.2.4 Nitrile Gloves Market Size & Forecast, By End-use, 2021 – 2032

9.3 Europe

 9.3.1 Key Trends

 9.3.2 Nitrile Gloves Market Size & Forecast, By Type, 2021 – 2032

 9.3.3 Nitrile Gloves Market Size & Forecast, By Grade, 2021 – 2032

 9.3.4 Nitrile Gloves Market Size & Forecast, By Texture, 2021 – 2032

 9.3.5 Nitrile Gloves Market Size & Forecast, By End-use, 2021 – 2032

 9.3.6 Nitrile Gloves Market Size & Forecast, By Country, 2021 – 2032

  9.3.6.1 Germany

   9.3.6.1.1 Nitrile Gloves Market Size & Forecast, By Type, 2021 – 2032

   9.3.6.1.2 Nitrile Gloves Market Size & Forecast, By Grade, 2021 – 2032

   9.3.6.1.3 Nitrile Gloves Market Size & Forecast, By Texture, 2021 – 2032

   9.3.6.1.4 Nitrile Gloves Market Size & Forecast, By End-use, 2021 – 2032

  9.3.6.2 UK

   9.3.6.2.1 Nitrile Gloves Market Size & Forecast, By Type, 2021 – 2032

   9.3.6.2.2 Nitrile Gloves Market Size & Forecast, By Grade, 2021 – 2032

   9.3.6.2.3 Nitrile Gloves Market Size & Forecast, By Texture, 2021 – 2032

   9.3.6.2.4 Nitrile Gloves Market Size & Forecast, By End-use, 2021 – 2032

  9.3.6.3 France

   9.3.6.3.1 Nitrile Gloves Market Size & Forecast, By Type, 2021 – 2032

   9.3.6.3.2 Nitrile Gloves Market Size & Forecast, By Grade, 2021 – 2032

   9.3.6.3.3 Nitrile Gloves Market Size & Forecast, By Texture, 2021 – 2032

   9.3.6.3.4 Nitrile Gloves Market Size & Forecast, By End-use, 2021 – 2032

  9.3.6.4 Italy

   9.3.6.4.1 Nitrile Gloves Market Size & Forecast, By Type, 2021 – 2032

   9.3.6.4.2 Nitrile Gloves Market Size & Forecast, By Grade, 2021 – 2032

   9.3.6.4.3 Nitrile Gloves Market Size & Forecast, By Texture, 2021 – 2032

   9.3.6.4.4 Nitrile Gloves Market Size & Forecast, By End-use, 2021 – 2032

  9.3.6.5 Spain

   9.3.6.5.1 Nitrile Gloves Market Size & Forecast, By Type, 2021 – 2032

   9.3.6.5.2 Nitrile Gloves Market Size & Forecast, By Grade, 2021 – 2032

   9.3.6.5.3 Nitrile Gloves Market Size & Forecast, By Texture, 2021 – 2032

   9.3.6.5.4 Nitrile Gloves Market Size & Forecast, By End-use, 2021 – 2032

  9.3.6.6 Russia

   9.3.6.6.1 Nitrile Gloves Market Size & Forecast, By Type, 2021 – 2032

   9.3.6.6.2 Nitrile Gloves Market Size & Forecast, By Grade, 2021 – 2032

   9.3.6.6.3 Nitrile Gloves Market Size & Forecast, By Texture, 2021 – 2032

   9.3.6.6.4 Nitrile Gloves Market Size & Forecast, By End-use, 2021 – 2032

  9.3.6.7 Poland

   9.3.6.7.1 Nitrile Gloves Market Size & Forecast, By Type, 2021 – 2032

   9.3.6.7.2 Nitrile Gloves Market Size & Forecast, By Grade, 2021 – 2032

   9.3.6.7.3 Nitrile Gloves Market Size & Forecast, By Texture, 2021 – 2032

   9.3.6.7.4 Nitrile Gloves Market Size & Forecast, By End-use, 2021 – 2032

  9.3.6.8 Rest of Europe

   9.3.6.8.1 Nitrile Gloves Market Size & Forecast, By Type, 2021 – 2032

   9.3.6.8.2 Nitrile Gloves Market Size & Forecast, By Grade, 2021 – 2032

   9.3.6.8.3 Nitrile Gloves Market Size & Forecast, By Texture, 2021 – 2032

   9.3.6.8.4 Nitrile Gloves Market Size & Forecast, By End-use, 2021 – 2032   

9.4 Asia-Pacific

 9.4.1 Key Trends

 9.4.2 Nitrile Gloves Market Size & Forecast, By Type, 2021 – 2032

 9.4.3 Nitrile Gloves Market Size & Forecast, By Grade, 2021 – 2032

 9.4.4 Nitrile Gloves Market Size & Forecast, By Texture, 2021 – 2032

 9.4.5 Nitrile Gloves Market Size & Forecast, By End-use, 2021 – 2032

 9.4.6 Nitrile Gloves Market Size & Forecast, By Country, 2021 – 2032

  9.4.6.1 China

   9.4.6.1.1 Nitrile Gloves Market Size & Forecast, By Type, 2021 – 2032

   9.4.6.1.2 Nitrile Gloves Market Size & Forecast, By Grade, 2021 – 2032

   9.4.6.1.3 Nitrile Gloves Market Size & Forecast, By Texture, 2021 – 2032

   9.4.6.1.4 Nitrile Gloves Market Size & Forecast, By End-use, 2021 – 2032

  9.4.6.2 India

   9.4.6.2.1 Nitrile Gloves Market Size & Forecast, By Type, 2021 – 2032

   9.4.6.2.2 Nitrile Gloves Market Size & Forecast, By Grade, 2021 – 2032

   9.4.6.2.3 Nitrile Gloves Market Size & Forecast, By Texture, 2021 – 2032

   9.4.6.2.4 Nitrile Gloves Market Size & Forecast, By End-use, 2021 – 2032

  9.4.6.3 Japan

   9.4.6.3.1 Nitrile Gloves Market Size & Forecast, By Type, 2021 – 2032

   9.4.6.3.2 Nitrile Gloves Market Size & Forecast, By Grade, 2021 – 2032

   9.4.6.3.3 Nitrile Gloves Market Size & Forecast, By Texture, 2021 – 2032

   9.4.6.3.4 Nitrile Gloves Market Size & Forecast, By End-use, 2021 – 2032

  9.4.6.4 South Korea

   9.4.6.4.1 Nitrile Gloves Market Size & Forecast, By Type, 2021 – 2032

   9.4.6.4.2 Nitrile Gloves Market Size & Forecast, By Grade, 2021 – 2032

   9.4.6.4.3 Nitrile Gloves Market Size & Forecast, By Texture, 2021 – 2032

   9.4.6.4.4 Nitrile Gloves Market Size & Forecast, By End-use, 2021 – 2032

  9.4.6.5 Australia

   9.4.6.5.1 Nitrile Gloves Market Size & Forecast, By Type, 2021 – 2032

   9.4.6.5.2 Nitrile Gloves Market Size & Forecast, By Grade, 2021 – 2032

   9.4.6.5.3 Nitrile Gloves Market Size & Forecast, By Texture, 2021 – 2032

   9.4.6.5.4 Nitrile Gloves Market Size & Forecast, By End-use, 2021 – 2032

  9.4.6.6 ASEAN Countries

   9.4.6.6.1 Nitrile Gloves Market Size & Forecast, By Type, 2021 – 2032

   9.4.6.6.2 Nitrile Gloves Market Size & Forecast, By Grade, 2021 – 2032

   9.4.6.6.3 Nitrile Gloves Market Size & Forecast, By Texture, 2021 – 2032

   9.4.6.6.4 Nitrile Gloves Market Size & Forecast, By End-use, 2021 – 2032

  9.4.6.7 Rest of Asia-Pacific

   9.4.6.7.1 Nitrile Gloves Market Size & Forecast, By Type, 2021 – 2032

   9.4.6.7.2 Nitrile Gloves Market Size & Forecast, By Grade, 2021 – 2032

   9.4.6.7.3 Nitrile Gloves Market Size & Forecast, By Texture, 2021 – 2032

   9.4.6.7.4 Nitrile Gloves Market Size & Forecast, By End-use, 2021 – 2032

9.5 Latin America

 9.5.1 Key Trends

 9.5.2 Nitrile Gloves Market Size & Forecast, By Type, 2021 – 2032

 9.5.3 Nitrile Gloves Market Size & Forecast, By Grade, 2021 – 2032

 9.5.4 Nitrile Gloves Market Size & Forecast, By Texture, 2021 – 2032

 9.5.5 Nitrile Gloves Market Size & Forecast, By End-use, 2021 – 2032

 9.5.6 Nitrile Gloves Market Size & Forecast, By Country, 2021 – 2032

  9.5.6.1 Brazil

   9.5.6.1.1 Nitrile Gloves Market Size & Forecast, By Type, 2021 – 2032

   9.5.6.1.2 Nitrile Gloves Market Size & Forecast, By Grade, 2021 – 2032

   9.5.6.1.3 Nitrile Gloves Market Size & Forecast, By Texture, 2021 – 2032

   9.5.6.1.4 Nitrile Gloves Market Size & Forecast, By End-use, 2021 – 2032

  9.5.6.2 Argentina

   9.5.6.2.1 Nitrile Gloves Market Size & Forecast, By Type, 2021 – 2032

   9.5.6.2.2 Nitrile Gloves Market Size & Forecast, By Grade, 2021 – 2032

   9.5.6.2.3 Nitrile Gloves Market Size & Forecast, By Texture, 2021 – 2032

   9.5.6.2.4 Nitrile Gloves Market Size & Forecast, By End-use, 2021 – 2032

  9.5.6.3 Mexico

   9.5.6.3.1 Nitrile Gloves Market Size & Forecast, By Type, 2021 – 2032

   9.5.6.3.2 Nitrile Gloves Market Size & Forecast, By Grade, 2021 – 2032

   9.5.6.3.3 Nitrile Gloves Market Size & Forecast, By Texture, 2021 – 2032

   9.5.6.3.4 Nitrile Gloves Market Size & Forecast, By End-use, 2021 – 2032

  9.5.6.4 Colombia

   9.5.6.4.1 Nitrile Gloves Market Size & Forecast, By Type, 2021 – 2032

   9.5.6.4.2 Nitrile Gloves Market Size & Forecast, By Grade, 2021 – 2032

   9.5.6.4.3 Nitrile Gloves Market Size & Forecast, By Texture, 2021 – 2032

   9.5.6.4.4 Nitrile Gloves Market Size & Forecast, By End-use, 2021 – 2032

  9.5.6.5 Rest of Latin America

   9.5.6.5.1 Nitrile Gloves Market Size & Forecast, By Type, 2021 – 2032

   9.5.6.5.2 Nitrile Gloves Market Size & Forecast, By Grade, 2021 – 2032

   9.5.6.5.3 Nitrile Gloves Market Size & Forecast, By Texture, 2021 – 2032

   9.5.6.5.4 Nitrile Gloves Market Size & Forecast, By End-use, 2021 – 2032

9.6 Middle East & Africa

 9.6.1 Key Trends

 9.6.2 Nitrile Gloves Market Size & Forecast, By Type, 2021 – 2032

 9.6.3 Nitrile Gloves Market Size & Forecast, By Grade, 2021 – 2032

 9.6.4 Nitrile Gloves Market Size & Forecast, By Texture, 2021 – 2032

 9.6.5 Nitrile Gloves Market Size & Forecast, By End-use, 2021 – 2032

 9.6.6 Nitrile Gloves Market Size & Forecast, By Country, 2021 – 2032

  9.6.6.1 UAE

   9.6.6.1.1 Nitrile Gloves Market Size & Forecast, By Type, 2021 – 2032

   9.6.6.1.2 Nitrile Gloves Market Size & Forecast, By Grade, 2021 – 2032

   9.6.6.1.3 Nitrile Gloves Market Size & Forecast, By Texture, 2021 – 2032

   9.6.6.1.4 Nitrile Gloves Market Size & Forecast, By End-use, 2021 – 2032

  9.6.6.2 Saudi Arabia

   9.6.6.2.1 Nitrile Gloves Market Size & Forecast, By Type, 2021 – 2032

   9.6.6.2.2 Nitrile Gloves Market Size & Forecast, By Grade, 2021 – 2032

   9.6.6.2.3 Nitrile Gloves Market Size & Forecast, By Texture, 2021 – 2032

   9.6.6.2.4 Nitrile Gloves Market Size & Forecast, By End-use, 2021 – 2032

  9.6.6.3 Qatar

   9.6.6.3.1 Nitrile Gloves Market Size & Forecast, By Type, 2021 – 2032

   9.6.6.3.2 Nitrile Gloves Market Size & Forecast, By Grade, 2021 – 2032

   9.6.6.3.3 Nitrile Gloves Market Size & Forecast, By Texture, 2021 – 2032

   9.6.6.3.4 Nitrile Gloves Market Size & Forecast, By End-use, 2021 – 2032

  9.6.6.4 Egypt

   9.6.6.4.1 Nitrile Gloves Market Size & Forecast, By Type, 2021 – 2032

   9.6.6.4.2 Nitrile Gloves Market Size & Forecast, By Grade, 2021 – 2032

   9.6.6.4.3 Nitrile Gloves Market Size & Forecast, By Texture, 2021 – 2032

   9.6.6.4.4 Nitrile Gloves Market Size & Forecast, By End-use, 2021 – 2032

  9.6.6.5 South Africa

   9.6.6.5.1 Nitrile Gloves Market Size & Forecast, By Type, 2021 – 2032

   9.6.6.5.2 Nitrile Gloves Market Size & Forecast, By Grade, 2021 – 2032

   9.6.6.5.3 Nitrile Gloves Market Size & Forecast, By Texture, 2021 – 2032

   9.6.6.5.4 Nitrile Gloves Market Size & Forecast, By End-use, 2021 – 2032

  9.6.6.6 Rest of Middle East & Africa

   9.6.6.6.1 Nitrile Gloves Market Size & Forecast, By Type, 2021 – 2032

   9.6.6.6.2 Nitrile Gloves Market Size & Forecast, By Grade, 2021 – 2032

   9.6.6.6.3 Nitrile Gloves Market Size & Forecast, By Texture, 2021 – 2032

   9.6.6.6.4 Nitrile Gloves Market Size & Forecast, By End-use, 2021 – 2032

10. Competitive Landscape

 10.1 Key Players' Positioning

 10.2 Competitive Developments

  10.2.1 Key Strategies Adopted (%), By Key Players, 2024

  10.2.2 Year-Wise Strategies & Development, 2021 – 2025

  10.2.3 Number Of Strategies Adopted By Key Players, 2024

 10.3 Market Share Analysis, 2024

 10.4 Product/Service & Texture Benchmarking

  10.4.1 Product/Service Specifications & Features By Key Players

  10.4.2 Product/Service Heatmap By Key Players

  10.4.3 Texture Heatmap By Key Players

 10.5 Industry Start-Up & Innovation Landscape

 10.6 Key Company Profiles

10.6 Key Company Profiles

 10.6.1 3M

  10.6.1.1 Company Overview & Snapshot

  10.6.1.2 Product/Service Portfolio

  10.6.1.3 Key Company Financials

  10.6.1.4 SWOT Analysis

 10.6.2 Adenna LLC

  10.6.2.1 Company Overview & Snapshot

  10.6.2.2 Product/Service Portfolio

  10.6.2.3 Key Company Financials

  10.6.2.4 SWOT Analysis

 10.6.3 Ammex Corporation

  10.6.3.1 Company Overview & Snapshot

  10.6.3.2 Product/Service Portfolio

  10.6.3.3 Key Company Financials

  10.6.3.4 SWOT Analysis

 10.6.4 Ansell Healthcare

  10.6.4.1 Company Overview & Snapshot

  10.6.4.2 Product/Service Portfolio

  10.6.4.3 Key Company Financials

  10.6.4.4 SWOT Analysis

 10.6.5 Atrium Medical Care

  10.6.5.1 Company Overview & Snapshot

  10.6.5.2 Product/Service Portfolio

  10.6.5.3 Key Company Financials

  10.6.5.4 SWOT Analysis

 10.6.6 Cardinal Health

  10.6.6.1 Company Overview & Snapshot

  10.6.6.2 Product/Service Portfolio

  10.6.6.3 Key Company Financials

  10.6.6.4 SWOT Analysis

 10.6.7 Dynarex Corporation

  10.6.7.1 Company Overview & Snapshot

  10.6.7.2 Product/Service Portfolio

  10.6.7.3 Key Company Financials

  10.6.7.4 SWOT Analysis

 10.6.8 Hartalega Holdings Berhad

  10.6.8.1 Company Overview & Snapshot

  10.6.8.2 Product/Service Portfolio

  10.6.8.3 Key Company Financials

  10.6.8.4 SWOT Analysis

 10.6.9 Honeywell International Inc

  10.6.9.1 Company Overview & Snapshot

  10.6.9.2 Product/Service Portfolio

  10.6.9.3 Key Company Financials

  10.6.9.4 SWOT Analysis

 10.6.10 Kimberly Clark

  10.6.10.1 Company Overview & Snapshot

  10.6.10.2 Product/Service Portfolio

  10.6.10.3 Key Company Financials

  10.6.10.4 SWOT Analysis

 10.6.11 McKesson Corporation

  10.6.11.1 Company Overview & Snapshot

  10.6.11.2 Product/Service Portfolio

  10.6.11.3 Key Company Financials

  10.6.11.4 SWOT Analysis

 10.6.12 Medline Industries

  10.6.12.1 Company Overview & Snapshot

  10.6.12.2 Product/Service Portfolio

  10.6.12.3 Key Company Financials

  10.6.12.4 SWOT Analysis

 10.6.13 Mercator Medical S.A

  10.6.13.1 Company Overview & Snapshot

  10.6.13.2 Product/Service Portfolio

  10.6.13.3 Key Company Financials

  10.6.13.4 SWOT Analysis

 10.6.14 Shield Scientific B.V.

  10.6.14.1 Company Overview & Snapshot

  10.6.14.2 Product/Service Portfolio

  10.6.14.3 Key Company Financials

  10.6.14.4 SWOT Analysis

 10.6.15 Supermax Corporation Berhad

  10.6.15.1 Company Overview & Snapshot

  10.6.15.2 Product/Service Portfolio

  10.6.15.3 Key Company Financials

  10.6.15.4 SWOT Analysis

 10.6.16 Supermax Healthcare Limited

  10.6.16.1 Company Overview & Snapshot

  10.6.16.2 Product/Service Portfolio

  10.6.16.3 Key Company Financials

  10.6.16.4 SWOT Analysis

 10.6.17 Top Glove Corporation

  10.6.17.1 Company Overview & Snapshot

  10.6.17.2 Product/Service Portfolio

  10.6.17.3 Key Company Financials

  10.6.17.4 SWOT Analysis

 10.6.18 Unigloves Limited

  10.6.18.1 Company Overview & Snapshot

  10.6.18.2 Product/Service Portfolio

  10.6.18.3 Key Company Financials

  10.6.18.4 SWOT Analysis

11. Analyst Recommendations

 11.1 SNS Insider Opportunity Map

 11.2 Industry Low-Hanging Fruit Assessment

 11.3 Market Entry & Growth Strategy

 11.4 Analyst Viewpoint & Suggestions On Market Growth

12. Assumptions

13. Disclaimer

14. Appendix

 14.1 List Of Tables

 14.2 List Of Figures

Key Market Segments:

By Type

  • Powdered

  • Powder-free

By Grade

  • Medical

  • Industrial

  • Food

By Texture

  • Smooth

  • Micro-roughened

  • Aggressively Textured

By End-use

  • Medical & Healthcare

  • Food & Beverage

  • Automotive

  • Oil & Gas

  • Construction

  • Chemical

  • Pharmaceutical

  • Metals & Machinery

  • Others

Request for Segment Customization as per your Business Requirement: Segment Customization Request

Regional Coverage:

North America

  • US

  • Canada

  • Mexico

Europe

  • Eastern Europe

    • Poland

    • Romania

    • Hungary

    • Turkey

    • Rest of Eastern Europe

  • Western Europe

    • Germany

    • France

    • UK

    • Italy

    • Spain

    • Netherlands

    • Switzerland

    • Austria

    • Rest of Western Europe

Asia Pacific

  • China

  • India

  • Japan

  • South Korea

  • Vietnam

  • Singapore

  • Australia

  • Rest of Asia Pacific

Middle East & Africa

  • Middle East

    • UAE

    • Egypt

    • Saudi Arabia

    • Qatar

    • Rest of Middle East

  • Africa

    • Nigeria

    • South Africa

    • Rest of Africa

Latin America

  • Brazil

  • Argentina

  • Colombia

  • Rest of Latin America

Request for Country Level Research Report: Country Level Customization Request

Available Customization

  • With the given market data, SNS Insider offers customization as per the company’s specific needs. The following customization options are available for the report:

  • Product Analysis

  • Criss-Cross segment analysis (e.g. Product X Application)

  • Product Matrix which gives a detailed comparison of product portfolio of each company

  • Geographic Analysis

  • Additional countries in any of the regions

  • Company Information

  • Detailed analysis and profiling of additional market players (Up to five)

An accurate research report requires proper strategizing as well as implementation. There are multiple factors involved in the completion of good and accurate research report and selecting the best methodology to compete the research is the toughest part. Since the research reports we provide play a crucial role in any company’s decision-making process, therefore we at SNS Insider always believe that we should choose the best method which gives us results closer to reality. This allows us to reach at a stage wherein we can provide our clients best and accurate investment to output ratio.

Each report that we prepare takes a timeframe of 350-400 business hours for production. Starting from the selection of titles through a couple of in-depth brain storming session to the final QC process before uploading our titles on our website we dedicate around 350 working hours. The titles are selected based on their current market cap and the foreseen CAGR and growth.


The 5 steps process:

Step 1: Secondary Research:

Secondary Research or Desk Research is as the name suggests is a research process wherein, we collect data through the readily available information. In this process we use various paid and unpaid databases which our team has access to and gather data through the same. This includes examining of listed companies’ annual reports, Journals, SEC filling etc. Apart from this our team has access to various associations across the globe across different industries. Lastly, we have exchange relationships with various university as well as individual libraries.

Secondary Research

Step 2: Primary Research

When we talk about primary research, it is a type of study in which the researchers collect relevant data samples directly, rather than relying on previously collected data.  This type of research is focused on gaining content specific facts that can be sued to solve specific problems. Since the collected data is fresh and first hand therefore it makes the study more accurate and genuine.

We at SNS Insider have divided Primary Research into 2 parts.

Part 1 wherein we interview the KOLs of major players as well as the upcoming ones across various geographic regions. This allows us to have their view over the market scenario and acts as an important tool to come closer to the accurate market numbers. As many as 45 paid and unpaid primary interviews are taken from both the demand and supply side of the industry to make sure we land at an accurate judgement and analysis of the market.

This step involves the triangulation of data wherein our team analyses the interview transcripts, online survey responses and observation of on filed participants. The below mentioned chart should give a better understanding of the part 1 of the primary interview.

Primary Research

Part 2: In this part of primary research the data collected via secondary research and the part 1 of the primary research is validated with the interviews from individual consultants and subject matter experts.

Consultants are those set of people who have at least 12 years of experience and expertise within the industry whereas Subject Matter Experts are those with at least 15 years of experience behind their back within the same space. The data with the help of two main processes i.e., FGDs (Focused Group Discussions) and IDs (Individual Discussions). This gives us a 3rd party nonbiased primary view of the market scenario making it a more dependable one while collation of the data pointers.

Step 3: Data Bank Validation

Once all the information is collected via primary and secondary sources, we run that information for data validation. At our intelligence centre our research heads track a lot of information related to the market which includes the quarterly reports, the daily stock prices, and other relevant information. Our data bank server gets updated every fortnight and that is how the information which we collected using our primary and secondary information is revalidated in real time.

Data Bank Validation

Step 4: QA/QC Process

After all the data collection and validation our team does a final level of quality check and quality assurance to get rid of any unwanted or undesired mistakes. This might include but not limited to getting rid of the any typos, duplication of numbers or missing of any important information. The people involved in this process include technical content writers, research heads and graphics people. Once this process is completed the title gets uploader on our platform for our clients to read it.

Step 5: Final QC/QA Process:

This is the last process and comes when the client has ordered the study. In this process a final QA/QC is done before the study is emailed to the client. Since we believe in giving our clients a good experience of our research studies, therefore, to make sure that we do not lack at our end in any way humanly possible we do a final round of quality check and then dispatch the study to the client.