Waste Recycling Services Market Report Scope & Overview:
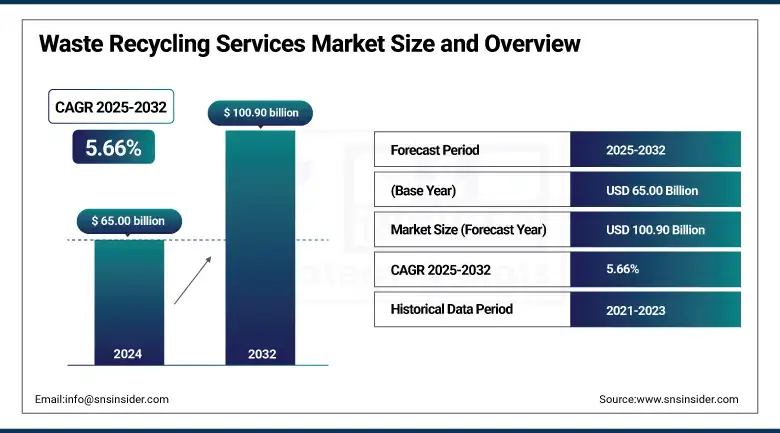
The Waste Recycling Services market size was valued at USD 65.00 billion in 2024 and is expected to reach USD 100.90 billion by 2032, growing at a CAGR of 5.66% over the forecast period of 2025-2032.
Rising demand for industrial recycling services, commercial waste recycling services, and significant development in municipal solid waste recycling have contributed to the growth of the waste recycling services market. Plastic recycling services and e-waste recycling are made more viable by digital technologies, such as AI sorting and IoT-enabled tracking, therefore driving market expansion. Stainless steel recycling systems and recycling construction waste are on the rise for the nation's top waste recyclers as new marketplaces begin to emerge.
To Get more information On Waste Recycling Services Market - Request Free Sample Report
According to the U.S. Environmental Protection Agency (EPA), 94 million tons of municipal solid waste were recycled or composted in 2018, achieving a 32.1% recycling rate, highlighting the size of the market opportunity. Veolia purchased Friedrich Hofmann GmbH for €315 million in March 2024 to enhance its recycling business in Europe. These trends have a significant impact on the waste recycling services market volume and market share, highlighting corporate assets investment in the waste management sector and resulting in prospects for the waste recycling services market.
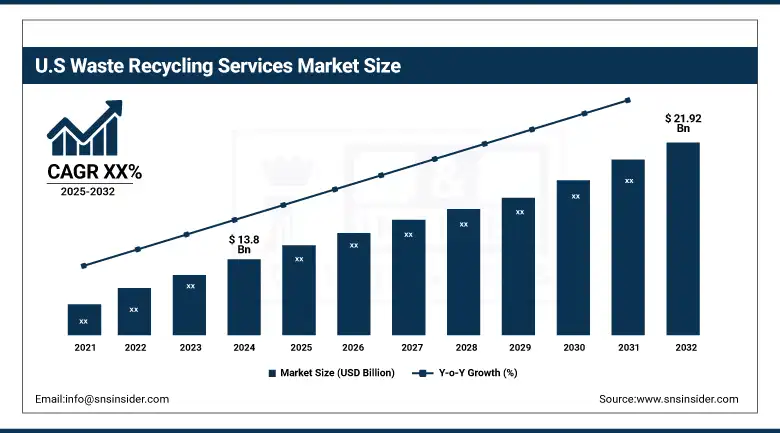
The U.S. dominates North America’s waste recycling services market share of about 80%, with a market size valued at USD 13.8 billion in 2024 and projected to reach a value of USD 21.92 billion by 2032, through large-scale industrial recycling services and innovative e-waste recycling. The U.S. EPA National Recycling Strategy 2024 encourages infrastructure growth and data collection, which align with market trends and progress. Leading companies such as Waste Management, Inc. have spent more than USD 800 million on state-of-the-art plastic recycling and construction waste recycling plants. Collectively, these federal efforts and corporate investments reinforce the U.S. dominance, expanding market opportunity and shaping the larger waste recycling services market overview and competition involving waste recycling services in the waste management industry.
Market Dynamics:
Drivers:
-
Integration of AI and Robotics Accelerates Waste Recycling Services Market Growth and Precision
AI and Robotics are some of the driving factors for the waste recycling services market as they increase Plastic Recycling Services and help improve municipal solid waste recycling accuracy. For instance, AMP Robotics installed more than 275 AI-driven systems in US facilities in 2023 that increased recovery rates. This product reinforces the waste recycling services market size, enhances the waste recycling services market share, and also helps with industrial recycling services. Sophisticated automation additionally complements the green demands, influences the waste recycling services market size, and revolutionizes the waste management industry's competitive landscape.
-
Corporate Zero Waste Targets Expand Commercial Waste Recycling and Industrial Recycling Services
Zero-waste initiatives by major brands are fueling commercial waste recycling and industrial recycling services. Curtailing the amount of waste set for landfills, specifically metal recycling and construction waste recycling, were specialized product areas where Microsoft reported in 2024, it diverted more than 90% of its global operational waste. It reinforces waste recycling services market trends and redefines the waste recycling services market overview. Corporate sustainability policies positively impact the waste recycling services market share, so as to drive long-term waste recycling services market growth and help attain a bigger waste recycling services market size that is bigger.
Restraints:
-
Variability In Recyclate Quality Limits Plastic Recycling Services and Market Share Stability
The market for waste recycling services, especially for plastic recycling services, is faced with contamination of recyclates. The U.S. EPA data for 2022 indicated that just 8.7% of plastic municipal solid waste was being recycled, and even that leaves quality worries. Loss of quality affects the profitability of construction waste recycling and commercial waste recycling, and consequently, recycling service companies. The quality issues limit the market trends and the waste recycling services market growth potential, weaken the size, and virtually eliminate the competitiveness of the waste management industry.
Segmentation Analysis:
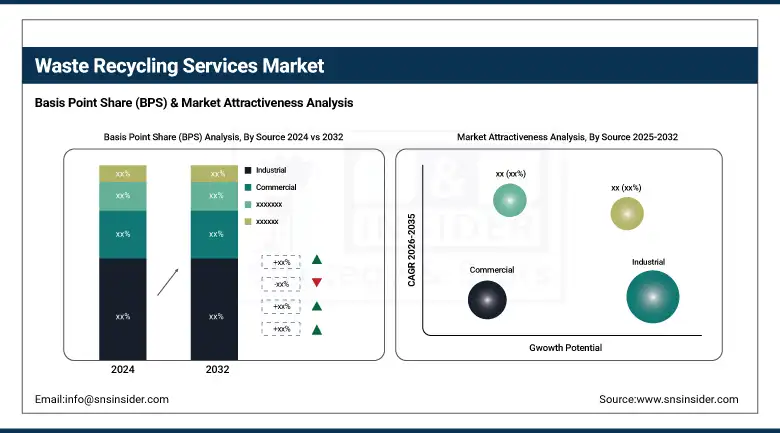
By Source
Industrial segment held a dominant waste recycling services market share of 43.50% in 2024, driven by high product demand in manufacturing scrap and metal recycling. This dominance is reinforced by the U.S. EPA’s program of sustainable materials management, encouraging recycling in industrial sites. Growth and Share are directly influenced by bulk scrap processing and construction waste recycling. Growing investments from major leading companies in the sector support market size through a range of uncertainty and are an indication of dynamic change in the larger waste management industry.
Residential is the fastest-growing waste recycling services market segment, with a 6.06% CAGR over 2025-2032. Increasing involvement in municipal solid waste services and curbside plastic recycling drives segmentation expansion. In line with the national recycling performance, the US EPA national recycling strategy 2024 of the U.S. EPA, household waste diversion has achieved its highest recorded level, which therefore increased the market size and formed the basis for future analysis. This expansion supports those companies’ move into household recycling and solid waste.
By Material Type
Paper & paperboard held a dominant waste recycling services market share of 31.20% in 2024, as the recycling rates are high in corrugated packaging. The American Forest & Paper Association announced a 67% recycling rate for 2022, and it showed a steady increase. Paper packaging continues to be important in industrial and commercial recycling and helps provide for market share. Ongoing investments by businesses are leading trends and reinforcing the overall North America and Europe market volume.
Plastics is the fastest-growing waste recycling services market segment, driven by a 6.49% CAGR over 2025-2032. The market is analyzed based on material type and is divided into four segments, including plastics, paper and cardboard, glass, and metal. Over 100 organizations are signed on to the US Plastics Pact’s goal for 100% of plastic packaging to be recyclable or compostable by 2025, in line with developments. Growing demand from the packaging and automotive industries widens the market size, and the report offers analysis, helping companies to improve their recycling services and increase industry chain exposure.
By Recycling Process
Mechanical recycling held a dominant waste recycling services market share of 53.20% in 2024, as it enables cheap processing of PET and HDPE plastics. Most post-consumer plastic volumes are treated by mechanical methods, which are expanding steadily (US EPA Plastics recycling report). This process maintains market share for packaging and municipal sources of waste. Corporate investments in refineries drive the market size further and add to the capital flows of leading companies in the recycling services industry.
Chemical/advanced recycling is the fastest-growing waste recycling services market segment, driven by a 6.54% CAGR over 2025-2032, with pyrolysis technologies at the forefront. The U.S. Department of Energy’s 2023 funding for new facilities is in line with market trends. Increased capacity for mixed plastic recycling pushes the market ahead into market analysis, increases market size, and prepares for competitive outcompeting within industries.
By End-User Industry
Packaging held a dominant waste recycling services market share of 32.10% in 2024, driven by large volumes generated from the food & beverage sector. According to the U.S. EPA, packaging is over 28% of municipal solid waste and factors into the corner fanatic's recycling list. Robust rates of recycling keep the market share and the growth on track. Market trends are based on consumer spending patterns and industry preferences.
Electrical & electronics is the fastest-growing waste recycling services market segment, driven by a 7.02% CAGR during 2025-2032, with the market of circuit board recycling acting as the key catalyst. The Commission already has data for 2023 of increased e-waste collection rates, encouraging growth. These trends enhance market analysis and widen the market base, thus companies are enabled to play a strategic role in a recycling economy that is in dynamic with new elements.
Regional Analysis:
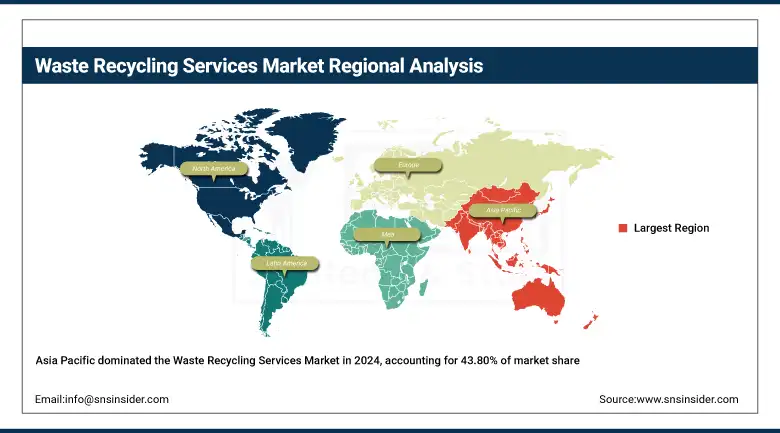
Asia Pacific dominated the waste recycling services market in 2024 with a significant market share of 43.80%, due to the presence of heavy metal recycling solutions in China and state-of-the-art plastic recycling services in Japan. Increasing demand for commercial waste recycling and government initiatives in India continue to uphold the waste recycling services market trends. Robust export markets, burgeoning e-waste recycling, and increasing urbanization bolster regional waste recycling services companies as the waste recycling services market analysis and underpin industrial recycling services and municipal solid waste recycling.
Get Customized Report as per Your Business Requirement - Enquiry Now
North America is the fastest-growing region in the waste recycling services market over 2025-2032, driven by strong policy support and private sector investment. Canada and Mexico adopt national circular economy plans that promote plastic and municipal solid waste recycling services. Zero Plastic Waste in Canada aims to end plastic waste by 2030, and advanced metal recycling solutions in Mexico, also supported by SEMARNAT through modernization projects. These government initiatives are acting as a catalyst for growth and trends in the waste recycling services market, as they allow the waste recycling service market to take market share and interest money salted away from all waste recycling services, industrial, and commercial waste recycling services.
Key Players:
The major waste recycling services market competitors include Waste Management, Inc., Veolia Environnement S.A., Republic Services, Inc., SUEZ, Remondis SE & Co. KG, Stericycle, Inc., Clean Harbors, Inc., Covanta Holding Corporation, Biffa plc, Waste Connections, Inc., GFL Environmental Inc., FCC Environment Ltd, Paprec Group, Renewi plc, Recology, Inc., Sims Limited, Li-Cycle Holdings Corp., Northstar Recycling Company, LLC, Eurokey Recycling Ltd, and Rubicon Global, LLC.
Recent Developments:
-
In July 2025, Veolia revealed plans to build the U.K.’s first closed‑loop plastic recycling facility as part of a £70 million “Plastic Push” and a £1 billion investment programme through 2030.
-
In December 2024, Li‑Cycle and Glencore resumed their collaboration on a pre‑feasibility study for a European recycling hub in Portovesme, Italy, leveraging Spoke & Hub technologies for battery materials recovery.
| Report Attributes | Details |
|---|---|
| Market Size in 2024 | USD 65.00 billion |
| Market Size by 2032 | USD 100.90 billion |
| CAGR | CAGR of 5.66% From 2025 to 2032 |
| Base Year | 2024 |
| Forecast Period | 2025-2032 |
| Historical Data | 2021-2023 |
| Report Scope & Coverage | Market Size, Segments Analysis, Competitive Landscape, Regional Analysis, DROC & SWOT Analysis, Forecast Outlook |
| Key Segments | •By Source (Residential, Commercial, Industrial, Others) •By Material Type (Paper & Paperboard, Metals, Plastics, Glass, Food, Bulbs, Batteries & Electronics, Yard Trimmings, Others) •By Recycling Process (Mechanical Recycling, Chemical / Advanced Recycling, Biological (Composting/Anaerobic Digestion), Thermal (Pyrolysis, Gasification), Others) •By End-User Industry (Packaging, Automotive & Transportation, Electrical & Electronics, Food & Beverage, Construction, Retail, Others) |
| Regional Analysis/Coverage | North America (US, Canada, Mexico), Europe (Germany, France, UK, Italy, Spain, Poland, Turkey, Rest of Europe), Asia Pacific (China, India, Japan, South Korea, Singapore, Australia, Rest of Asia Pacific), Middle East & Africa (UAE, Saudi Arabia, Qatar, South Africa, Rest of Middle East & Africa), Latin America (Brazil, Argentina, Rest of Latin America) |
| Company Profiles | Waste Management, Inc., Veolia Environnement S.A., Republic Services, Inc., SUEZ, Remondis SE & Co. KG, Stericycle, Inc., Clean Harbors, Inc., Covanta Holding Corporation, Biffa plc, Waste Connections, Inc., GFL Environmental Inc., FCC Environment Ltd, Paprec Group, Renewi plc, Recology, Inc., Sims Limited, Li-Cycle Holdings Corp., Northstar Recycling Company, LLC, Eurokey Recycling Ltd, and Rubicon Global, LLC |
Frequently Asked Questions
Highly competitive, led by key players like Waste Management, Veolia, and Remondis, with strategic acquisitions and advanced recycling technologies shaping market share.
Variability in recyclate quality, especially in plastic recycling services, limits profitability and restrains overall waste recycling services market growth and competitiveness.
Rapid urbanization boosts municipal solid waste recycling and commercial waste recycling volumes, increasing market size and trends across the Asia Pacific and North America.
Packaging, electrical & electronics, and construction waste recycling sectors drive the market, supported by large-scale metal recycling solutions and e-waste recycling demand.
The waste recycling services market is growing at a CAGR of 5.66% from 2025 to 2032, supported by industrial recycling services and digital advancements.
Get in Touch
