Cosmetic Preservative Market Report Scope and Overview:
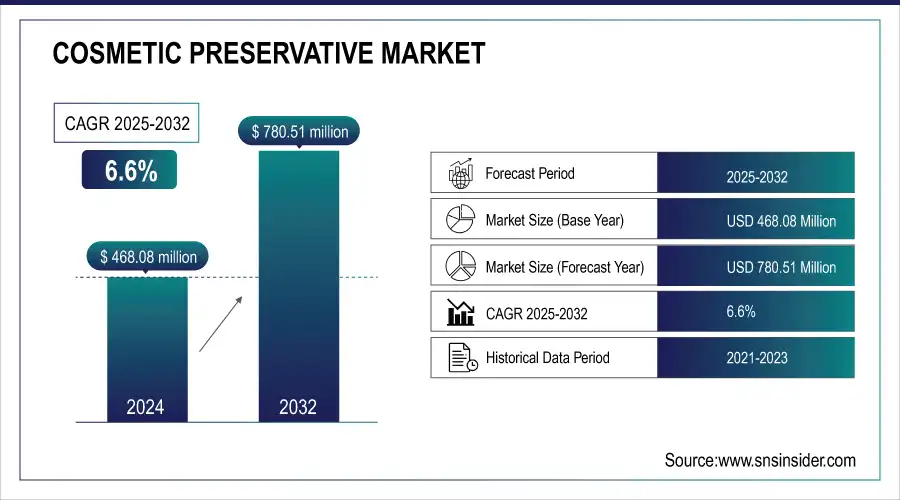
The Cosmetic Preservative Market Size was valued at USD 468.08 Million in 2024 and will hit USD 780.51 Million by 2032 & grow at a CAGR of 6.6% by 2025-2032.
The cosmetic preservative market has experienced growth over the years due to rising consumer awareness regarding the importance of product safety and hygiene. With the increasing demand for natural and organic cosmetic products, the market has witnessed a shift towards the use of preservatives derived from natural sources. The growing preference for eco-friendly and sustainable ingredients drives this trend. Several prominent companies dominate the cosmetic preservative market. These include global players such as Ashland Inc., BASF SE, Lonza Group Ltd., and Symrise AG. These companies invest heavily in research and development to introduce innovative and effective preservatives that meet the evolving needs of the cosmetic industry.
Get More Information on Cosmetic Preservative Market - Request Sample Report
The European Commission reported that over 70% of cosmetics tested in 2020 contained preservatives, but about 25% of these products had insufficient levels to effectively inhibit microbial growth. This statistic highlights the ongoing challenges and the need for effective preservative solutions in the cosmetic industry.
The cosmetic preservative market is witnessing a trend of growing demand for multifunctional preservatives that not only provide antimicrobial properties but also offer additional benefits such as moisturization and antioxidant effects. This trend is driven by the increasing consumer demand for products that offer multiple benefits in a single formulation. Secondly, there is a rising preference for preservatives with broad-spectrum activity, capable of effectively inhibiting the growth of various microorganisms. This is particularly important as cosmetic products are exposed to a wide range of contaminants during their usage, making it crucial to ensure their safety and stability.
Cosmetic Preservative Market Highlights:
-
BASF introduced its Preservative Solutions line in 2023, offering multifunctional preservatives that enhance product stability and provide moisturizing benefits, addressing the growing consumer demand for effective and skin-friendly cosmetics.
-
The clean beauty movement is heavily influencing the cosmetic preservative market, with many brands reformulating products to exclude preservatives that may cause irritation or allergic reactions.
-
Unilever launched its Clean Beauty project in 2021, removing over 1,000 potentially harmful ingredients, including certain preservatives, from its formulations to meet consumer safety expectations.
-
L’Oréal in 2022 emphasized plant-based preservatives in its new product lines, highlighting the importance of clean beauty principles and sustainable alternatives.
-
Procter & Gamble announced in 2023 that it would prioritize the use of non-irritating preservatives across its cosmetic range, reflecting the continued focus on safe and effective preservation.
-
Increasing demand for cosmetic products, driven by social media influencers, e-commerce growth, and heightened awareness of self-care and wellness, is compelling manufacturers to use reliable preservatives to ensure product longevity, safety, and consumer trust.
-
Manufacturers face the challenge of balancing effective microbial preservation with consumer safety and product quality, as some preservatives may cause irritation or interact with other ingredients, while natural alternatives may have limited efficacy.
For instance, BASF introduced its Preservative Solutions line in 2023, which includes multifunctional preservatives designed to enhance product stability while providing moisturizing properties. This innovative range aims to meet the growing consumer demand for products that combine efficacy with additional skin benefits.
The clean beauty movement has been affecting heavily the cosmetic preservative market. A vast number of “free from” labels are being launched, as many brands are reformulating their products to exclude preservatives that have been shown to cause irritation or allergic reactions. Unilever, for example, launched in 2021 its “Clean Beauty” project, which focused on removing from its formulations over 1,000 potentially harmful ingredients, including preservatives.
In turn, L’Oréal launched a new line of products in 2022, in which the plant-based preservative has been positioned as the most important, signalling the commitment to clean beauty principles. In addition, Procter & Gamble announced in 2023 that it would prioritize the use of non-irritating preservatives across its entire cosmetic range, indicating that there is no sign of this market trend dissipating.
Cosmetic Preservative Market Drivers:
-
Increasing demand for cosmetic products drives market growth.
The rapid development of beauty application standards is boosting the demand for skincare, makeup, and personal care products as a whole. This demand is driven by the rise of influencers on social media, the boom of e-commerce, and the increasing awareness of self-care and wellness. However, as consumers are putting more emphasis on the safety of these cosmetics, manufacturers need to use more reliable preservatives to ensure the longevity and stability of their products. According to the Cosmetic Ingredient around 80% of consumers are bothered by questions about cosmetics’ safety and efficiency. Thereby, the ability of cosmetics to be effective leading to purchase is based on a direct correlation: to be efficient, you need to be safe, and to be safe, you need cosmetic preservatives. This has created a direct correlation between product effectiveness and safety, where consumers expect that for cosmetics to be deemed effective, they must also be safe for use. Consequently, manufacturers are compelled to incorporate reliable cosmetic preservatives into their formulations to ensure longevity and stability while meeting regulatory standards and consumer expectations. This necessity not only addresses safety concerns but also fosters consumer trust and loyalty, ultimately driving sales and growth in the cosmetic preservative market.
Cosmetic Preservative Market Restraints:
-
Balancing the need for effective preservation with consumer safety and product quality.
The cosmetic industry relies on preservatives to extend the shelf life of products and prevent the growth of harmful microorganisms. However, the use of preservatives must be carefully managed to ensure they do not compromise consumer safety or product quality. The primary objective of cosmetic preservatives is to inhibit the growth of bacteria, fungi, and other microorganisms that can contaminate products and potentially harm consumers. Without effective preservation, cosmetics could become breeding grounds for harmful pathogens, leading to adverse health effects. On the other hand, consumer safety and product quality are equally crucial considerations. Some preservatives, while effective at preventing microbial growth, may cause skin irritation or allergic reactions in certain individuals. Additionally, preservatives can interact with other ingredients in cosmetics, potentially compromising their stability or efficacy. Finding the delicate balance between effective preservation and consumer safety requires thorough research, testing, and regulatory compliance. This presents an additional challenge, as natural preservatives often have limited efficacy compared to their synthetic counterparts.
Cosmetic Preservative Market Segment Analysis:
By Product
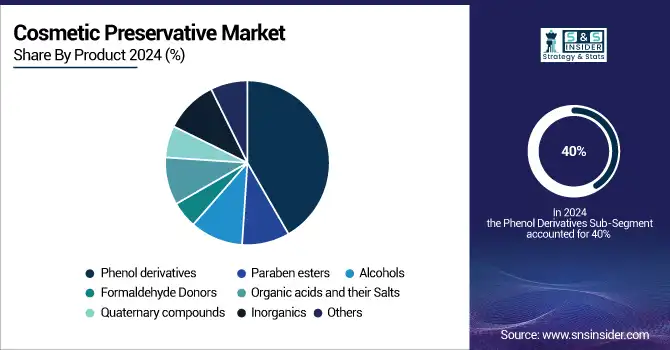
Phenol derivatives dominated the cosmetic preservative market with the largest revenue share of about 40% in 2024. The increasing use of phenol derivatives, especially phenoxyethanol, in the preparation of cosmetics such as skin lighting creams & and lotions, hair coloring solutions, and sunscreens is anticipated to drive the market growth from 2025-2032. Increasing demand for natural ingredients in cosmetics is expected to boost the growth of organic acids and their salt preservatives. The demand for organic preservatives such as clove, cinnamon, tea tree, lavender, rosemary, and other essential oils & and herbs is expected to grow at a high CAGR over the forecast period.
By Application
The hair care application segment dominated the cosmetic preservatives market with the highest revenue share of about 42% in 2024. Manufacturers of these products are extensively employing preservatives to enhance the longevity and quality of their offerings. This practice is expected to be a significant catalyst for the segment's growth in the future. The shift in consumer preferences towards natural skincare products, such as natural antioxidants, plant extracts, organic acids, and essential oils, necessitates a greater use of cosmetic preservatives during the manufacturing process. Consequently, this trend is anticipated to drive the growth and demand for these products in the coming years.
Cosmetic Preservative Market Regional Analysis:
Asia-Pacific Cosmetic Preservative Market Trends:
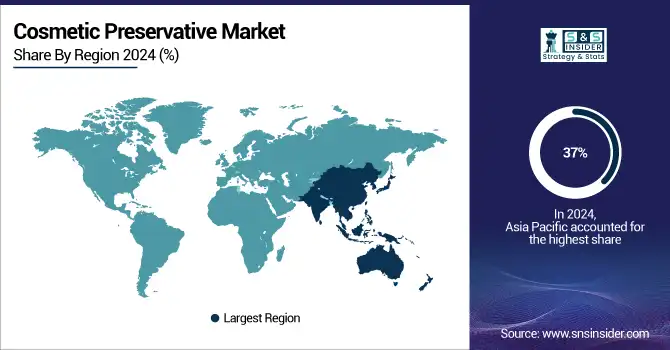
Asia Pacific dominated the Cosmetic Preservative Market with the highest revenue share of about 37% in 2024. This is mainly driven by an increase in the disposable incomes of the citizens of China and a change in the lifestyle leading to an increased demand for skincare and beauty products. Also, there has been an increase in urbanization and the growing power of social media leading to a furthermore increased demand for innovative cosmetic products leading to the cosmetic manufacturers to invest in ensuring their products are safe and stable by use of preservation techniques and chemicals. the region's growing awareness of health and wellness, combined with a shift towards clean beauty trends, has resulted in a higher demand for safe and effective cosmetic products, further boosting the need for reliable preservatives. The strong presence of major beauty brands and local manufacturers in the Asia-Pacific market, along with supportive government initiatives and favorable trade policies, also contribute to the region's dominance in the cosmetic preservative market. These factors combined create a robust environment for growth, making Asia-Pacific a leader in the global cosmetics landscape.
Get Customized Report as per Your Business Requirement - Enquiry Now
North America Cosmetic Preservative Market Trends:
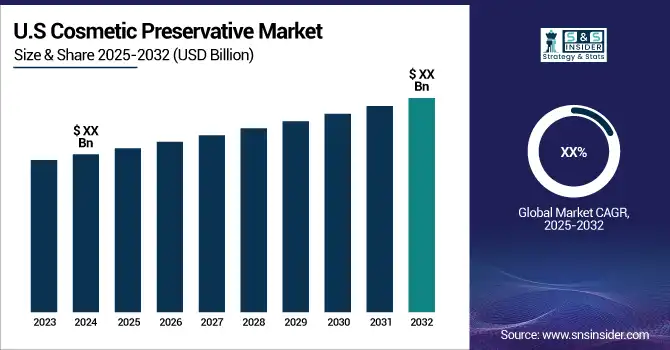
North America held a significant revenue share of the Cosmetic Preservative Market and is expected to grow with a CAGR of about 7% during the forecast period. The market for cosmetic preservatives in North America is expanding due to increasing disposable incomes and evolving consumer habits. There is a growing regional demand for natural cosmetic preservatives, driven by the high preference for organic beauty products that can counteract the harmful effects of sun, dust, and other environmental factors. The sales of toiletries are being propelled by changing consumer lifestyles and the expanding Fast-Moving Consumer Goods (FMCG) market in North America, which creates a positive business environment. Furthermore, the region's growing research and development efforts have resulted in a wide range of soaps and other toiletry products, contributing to an increase in the regional market share.
Europe Cosmetic Preservative Market Trends:
Europe dominated the cosmetic preservative market with a notable revenue share in 2024, driven by increasing consumer awareness about product safety and a strong preference for high-quality skincare and beauty products. The region’s well-established cosmetic industry, coupled with stringent regulations ensuring product stability and safety, encourages manufacturers to adopt effective preservation techniques. Rising demand for natural and clean beauty products, innovation in formulations, and the presence of leading cosmetic brands further contribute to Europe’s steady growth in the market.
Latin America Cosmetic Preservative Market Trends:
Latin America held a moderate share in the cosmetic preservative market in 2024, supported by increasing urbanization, rising disposable incomes, and growing interest in personal care and beauty products. The region is witnessing a shift towards international cosmetic brands and innovative products, which drives the demand for reliable preservatives. Government initiatives promoting health and wellness, along with expanding retail networks and e-commerce platforms, further strengthen the growth prospects of the cosmetic preservative market in Latin America.
Middle East & Africa Cosmetic Preservative Market Trends:
Middle East & Africa accounted for a smaller but steadily growing share in the cosmetic preservative market in 2024. The growth is fueled by rising awareness of personal grooming, increasing adoption of skincare and beauty products, and a gradual shift towards premium and international cosmetic brands. Investment in research and development, coupled with initiatives supporting the cosmetics industry, enhances product safety standards, boosting the demand for effective preservatives across the region.
Cosmetic Preservative Market Key Players:
-
BASF SE (Preservative Euxyl K 100)
-
The Dow Chemical Company (DOWSIL™ 9040)
-
Clariant AG (Ethanol 99.9% - Preservative)
-
Ashland Inc. (Parabens-Free Preservatives)
-
Symrise AG (SymGuard)
-
Salicylates & Chemicals Pvt. Ltd. (Salicylates)
-
Evonik Industries (TEGO® Cosmo C 100)
-
Chemipol (Chemipol Preservative)
-
Akema Fine Chemicals (Akema Preservative)
-
Brenntag AG (Brenntag Preservatives)
-
Lonza Group Ltd. (Lonza Givaudan)
-
Mitsubishi Chemical Corporation (Preservative MCT)
-
Seppic (a subsidiary of Air Liquide) (Sepimax Zen)
-
Kraton Corporation (Kraton Polymers)
-
Hawkins Inc. (Hawkins Preservatives)
-
SABIC (SABIC Preservative Solutions)
-
Rahn AG (Rahn Preservative)
-
Kahl GmbH & Co. KG (Kahl Preservative)
-
Inolex (Preservative Lexgard)
-
Mitsui Chemicals (Preservative Epinone)
Cosmetic Preservative Market Competitive Landscape:
Symrise AG is a global leader in the fragrance and flavor industry, headquartered in Holzminden, Germany. Formed in 2003 through the merger of Haarmann & Reimer and Dragoco, the company offers over 35,000 products across fragrances, flavors, cosmetic ingredients, and functional solutions. With a presence in over 100 countries and approximately 12,000 employees, Symrise serves over 6,000 customers worldwide. In 2024, it reported revenues of €4.999 billion, solidifying its position among the top players in the sector.
-
In May 2023, Symrise introduced two new products SymDiol 68T and SymOcide PT, both of which are tropolone-based. SymDiol 68T is a multifunctional antioxidant that effectively prevents the growth of yeast, bacteria, and mold, while also stabilizing emulsions. It is suitable for use in various skincare, sun care, hair care, personal care, and color cosmetic products. On the other hand, SymOcide PT offers both antioxidant and antimicrobial properties, effectively combating bacteria and fungi.
Brenntag SE is a global leader in chemical and ingredients distribution, headquartered in Essen, Germany. Founded in 1874, the company operates over 600 locations across more than 70 countries. With approximately 18,100 employees, Brenntag offers a comprehensive portfolio of industrial and specialty chemicals, providing tailored supply chain solutions to a diverse range of industries.
-
In August 2022, Brenntag, the global leader in chemicals and ingredients distribution, announced an expanded distribution agreement with ISCA, a renowned manufacturer and distributor of specialty chemicals. This partnership was formed to focus on providing preservatives for the cosmetics industry in several European markets.
Chemipol S.A., established in 1979 and headquartered in Terrassa, Spain, specializes in developing, manufacturing, and distributing biocides, additives, and specialty chemicals. Serving industries such as water treatment, coatings, cosmetics, and industrial processes, Chemipol operates globally through a network of international representatives. The company emphasizes innovation, sustainability, and quality, holding ISO 9001:2015 and ISO 14001:2015 certifications.
-
In September 2021, the Chemipol technical sales department launched COSMOPOL®, an innovative software application designed to support the selection process of preservation systems for cosmetic and personal care products.
| Report Attributes | Details |
| Market Size in 2024 | USD 468.08 Million |
| Market Size by 2032 | USD 780.51 Million |
| CAGR | CAGR of 6.6% from 2025 to 2032 |
| Base Year | 2024 |
| Forecast Period | 2025-2032 |
| Historical Data | 2021-2022 |
| Report Scope & Coverage | Market Size, Segments Analysis, Competitive Landscape, Regional Analysis, DROC & SWOT Analysis, Forecast Outlook |
| Key Segments | • By Product (Paraben esters, Phenol derivatives, Alcohols, Formaldehyde donors, Organic acids and their Salts, Quaternary compounds, Inorganics, and Others) • By Application (Skin and Sun Care, Hair Care, Baby Products, Fragrances & Perfumes, Makeup & Color, Mouthwash and Toothpaste, Toiletries, and Others) |
| Regional Analysis/Coverage | North America (US, Canada), Europe (Germany, UK, France, Italy, Spain, Russia, Poland, Rest of Europe), Asia Pacific (China, India, Japan, South Korea, Australia, ASEAN Countries, Rest of Asia Pacific), Middle East & Africa (UAE, Saudi Arabia, Qatar, South Africa, Rest of Middle East & Africa), Latin America (Brazil, Argentina, Mexico, Colombia, Rest of Latin America). |
| Company Profiles | BASF SE, The Dow Chemical Company, Clariant AG, Ashland Inc., Symrise AG, Salicylates & Chemicals Pvt. Ltd., Evonik Industries, Chemipol, Akema Fine Chemicals, Brenntag AG, Lonza Group Ltd., Mitsubishi Chemical Corporation, Seppic (Air Liquide), Kraton Corporation, Hawkins Inc., SABIC, Rahn AG, Kahl GmbH & Co. KG, Inolex, Mitsui Chemicals |
Frequently Asked Questions
Yes, you can ask for the customization as per your business requirement.
The expanding automotive industry and demand for thermal comfort drives the market growth.
The Construction application segment dominated the Cosmetic Preservative Market with the highest revenue share in 2024.
The projected market size for the Cosmetic Preservative Market is USD 780.51 Million by 2032.
The Compound Annual Growth rate for the Cosmetic Preservative Market over the forecast period is 6.6%.
Get in Touch
