image

Oil Condition Monitoring Market Report Scope & Overview:

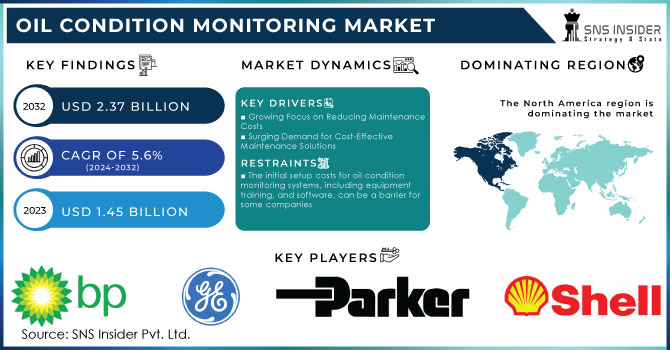
The Oil Condition Monitoring Market Size was valued at USD 1.45 billion in 2023 and is expected to reach USD 2.24 billion by 2031 and grow at a CAGR of 5.6% over the forecast period 2024-2031.

The oil condition monitoring market is experiencing growth driven by two main forces the growing need for cost-effective maintenance solutions and growing industry awareness of its benefits. Manufacturing, power generation and transportation companies recognize the power of oil analysis. Early detection of equipment problems through oil condition monitoring can prevent catastrophic failures, and studies show an 80% reduction in downtime. This means significant savings. In addition, the integration of big data analytics into oil condition monitoring unlocks a new level of insight that enables predictive maintenance and further optimizes equipment performance. As the industry strives for efficiency and adopts advanced technologies, the oil condition monitoring market offers significant opportunity for growth and savings.

Oil-Condition-Monitoring-Market Revenue Analysis

Get more information on Oil Condition Monitoring Market - Request Sample Report

MARKET DYNAMICS:

KEY DRIVERS:

  • Growing Focus on Reducing Maintenance Costs

  • Surging Demand for Cost-Effective Maintenance Solutions

Businesses are increasingly focused on optimizing maintenance costs. Oil condition monitoring allows for preventive maintenance, reducing the risk of unexpected equipment failures and costly repairs.

RESTRAINTS:

  • The initial setup costs for oil condition monitoring systems, including equipment, training, and software, can be a barrier for some companies

  • Lack of Skilled Personnel can be barrier for the market growth.

Implementing and interpreting oil condition monitoring data requires skilled personnel trained in oil analysis techniques. A shortage of such skilled workers can hinder the wider adoption of this technology. Research suggests this lack of skilled personnel could potentially hamper 10% of the market's growth.

OPPORTUNITIES:

  • Integration of oil condition monitoring systems with IIoT allows for real-time data collection and remote monitoring.

  • The Growing Adoption of Big Data Analytics

The increasing use of big data analytics in conjunction with oil condition monitoring allows for deeper insights into machine health. This enables predictive maintenance, leading to improved efficiency and reduced downtime.

CHALLENGES:

  • Integration with Existing Systems can be a Challenging task.

Integrating oil condition monitoring systems with existing maintenance and asset management software can be a complex task, requiring technical expertise and potentially delaying implementation.

IMPACT OF RUSSIA-UKRAINE WAR

The war is causing disruptions in the supply chains of oil analysis equipment and sensors, which is leading to delays and high prices. Due to  this supply chains disruption of the  new equipment, it extending the useful life of existing machinery which becomes crucial. Monitoring the condition of the oil enables preventive maintenance, extends the service life of the equipment and reduces dependence on possible infrequent changes. Rising oil prices may also force companies to prioritize immediate operating costs. Investments in new technologies such as oil condition monitoring could be halted. The impact of war on energy costs underscores the need for operational efficiency. Monitoring the oil condition helps prevent equipment breakdowns and unplanned downtime, which ultimately saves money in the long run.

IMPACT OF ECONOMIC SLOWDOWN

Economic slowdown leads to reduce budgets. Companies might delay or reduce investments in new technologies like oil condition monitoring, especially for high-cost, high-tech segments like continuous online monitoring systems. On the other hand, Maximizing equipment performance becomes crucial during economic slowdowns. Oil condition monitoring allows for preventive maintenance, ensuring equipment operates efficiently and avoids costly breakdowns that disrupt production and lead to lost revenue. However, the economic slowdown could also lead to an increased adoption of the more affordable segment offline analysis with periodic sampling. This offers a cost-effective way to reap the benefits of oil condition monitoring without a significant upfront investment.

KEY MARKET SEGMENTS:

By Product Type

  • Compressor

  • Turbine

  • Engine

  • Hydraulic System

  • Other

Based on Product Type, the Oil Condition Monitoring Market is sub divided into Compressor, Turbine, Engine, Hydraulic System and Other. The Turbine segment is expected to respond with the largest market share of oil conditioning monitoring by 2030. Turbine oil analysis is one of the most commonly used methods of adjustment forecasting technology. Turbines are used in a variety of applications, which require systematic testing in order to function properly. Turbines used in industries such as power generation and transport operate under very high pressure. In addition, there is a need to constantly monitor oil quality to ensure the efficiency of turbines.

By Sampling Type

  • On-Site

    • Portable Kit

    • Fixed Continuous Monitoring

  • Off-Site

By Industry Vertical

  • Industrial

  • Mining

  • Transportation

  • Oil & Gas

  • Power Generation

Based on Industry Vertical, the Oil Condition Monitoring Market is sub divided into Industrial, Mining, Transportation, Oil & Gas and Power Generation. Power generation is one of the few emerging industries that is experiencing the rapid adoption of oil conditioning monitoring. The power generating sector employs a variety of machinery, equipment, and components. Appliances such as engines, wind turbines, gearboxes, and compressors operate at high temperatures and pressures, thus reducing the quality of the oil used in the equipment. Monitoring the oil condition helps to identify minor problems inside the equipment before any catastrophic failure.
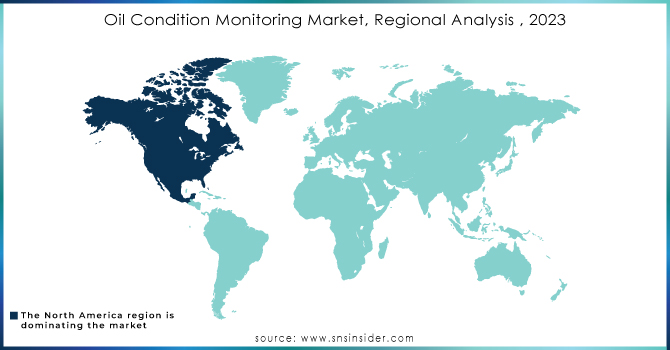
REGIONAL ANALYSES

North America held the largest market share in 2023, and is estimated to continue to do so during the forecast period. 2024- 2031. This dominance can be attributed to several key factors that drive a strong demand for these systems and solutions. There is  a growing emphasis on optimizing asset utilization. Businesses across various sectors are striving to get the most out of their equipment, and oil condition monitoring empowers them to achieve this by identifying potential issues early on, preventing costly breakdowns and maximizing uptime. Secondly, stringent government regulations play a crucial role. North American governments prioritize workplace and personnel safety, and oil condition monitoring helps ensure compliance with these regulations by proactively detecting equipment malfunctions that could pose safety risks. Finally, industries like oil and gas, transportation, and manufacturing operate under strict quality control measures. Oil condition monitoring becomes a vital tool in these sectors, enabling them to maintain the highest quality standards in their operations by ensuring optimal equipment performance. As these factors continue to hold significant weight, North America is poised to remain a leading force in the Oil Condition Monitoring Market in the future.

The Asia Pacific (APAC) region is expected fastest growth in the Oil Condition Monitoring Market during the forecasted period 2024-2031. The booming manufacturing sector in countries like China, India, and South Korea necessitates efficient equipment maintenance practices. Oil condition monitoring offers a proactive approach to ensure optimal equipment performance and avoid costly downtime. Investments in infrastructure development across APAC create a demand for reliable equipment in sectors like construction, power generation, and transportation. Oil condition monitoring helps maintain this equipment and ensure project timelines are met. also, Some APAC governments are actively promoting the adoption of advanced technologies for industrial maintenance. This can include subsidies or tax breaks for companies implementing oil condition monitoring systems.

Oil-Condition-Monitoring-Market-By-Region

Get Customized Report as per your Business Requirement - Request For Customized Report

REGIONAL COVERAGE:

North America

  • US

  • Canada

  • Mexico

Europe

  • Eastern Europe

    • Poland

    • Romania

    • Hungary

    • Turkey

    • Rest of Eastern Europe

  • Western Europe

    • Germany

    • France

    • UK

    • Italy

    • Spain

    • Netherlands

    • Switzerland

    • Austria

    • Rest of Western Europe

Asia Pacific

  • China

  • India

  • Japan

  • South Korea

  • Vietnam

  • Singapore

  • Australia

  • Rest of Asia Pacific

Middle East & Africa

  • Middle East

    • UAE

    • Egypt

    • Saudi Arabia

    • Qatar

    • Rest of the Middle East

  • Africa

    • Nigeria

    • South Africa

    • Rest of Africa

Latin America

  • Brazil

  • Argentina

  • Colombia

  • Rest of Latin America

KEY PLAYERS:

The key player in the  Oil Condition Monitoring Market are General Electric, BP plc, Parker-Hannifin Corporation, Shell plc, Bureau Veritas, Intertek Group plc, Eaton Corporation, Chevron Corporation, SGS SA, TotalEnergies & Other Players.

Intertek Group plc-Company Financial Analysis

Company Landscape Analysis


RECENT DEVELOPMENT

  • In 18 August 2021, Shell launched VitalyX in . This smart service uses advanced data analysis to monitor oil condition and machine health in ships. It combines Shell's oil expertise with Bently Nevada's monitoring technology.

  • In June 2021, a significant development occurred in the industrial verification and certification landscape. Bureau Veritas, a French leader in testing, inspection, and certification, signed a three-year framework agreement with Veolia, a global environmental solutions powerhouse.

Oil Condition Monitoring Market Report Scope:

Report Attributes Details
Market Size in 2023 US$ 1.45 Bn
Market Size by 2031 US$ 2.24 Bn
CAGR CAGR of 5.6 % From 2024 to 2031
Base Year 2023
Forecast Period 2024-2031
Historical Data 2020-2022
Report Scope & Coverage Market Size, Segments Analysis, Competitive  Landscape, Regional Analysis, DROC & SWOT Analysis, Forecast Outlook
Key Segments • By Product Type (Compressor, Turbine, Engine, Hydraulic System, Other)
• By Sampling Type (On-Site, Off-Site)
• By Industry Vertical (Industrial, Mining, Transportation, Oil & Gas, Power Generation)
Regional Analysis/Coverage North America (US, Canada, Mexico), Europe (Eastern Europe [Poland, Romania, Hungary, Turkey, Rest of Eastern Europe] Western Europe] Germany, France, UK, Italy, Spain, Netherlands, Switzerland, Austria, Rest of Western Europe]), Asia Pacific (China, India, Japan, South Korea, Vietnam, Singapore, Australia, Rest of Asia Pacific), Middle East & Africa (Middle East [UAE, Egypt, Saudi Arabia, Qatar, Rest of Middle East], Africa [Nigeria, South Africa, Rest of Africa], Latin America (Brazil, Argentina, Colombia, Rest of Latin America)
Company Profiles General Electric, BP plc, Parker-Hannifin Corporation, Shell plc, Bureau Veritas, Intertek Group plc, Eaton Corporation, Chevron Corporation, SGS SA and TotalEnergies
Key Drivers • Growing Focus on Reducing Maintenance Costs
• Surging Demand for Cost-Effective Maintenance Solutions 
Restraints • The initial setup costs for oil condition monitoring systems, including equipment, training, and software, can be a barrier for some companies
• Lack of Skilled Personnel can be barrier for the market growth.

Frequently Asked Questions

Ans: The Oil Condition Monitoring Market is expected to grow at a CAGR of 5.6%.

Ans: Oil Condition Monitoring Market size was USD 1.45  billion in 2023 and is expected to Reach USD 2.24 billion by 2031.

Ans: The market has been segmented with respect to product type, sampling type and industry vertical.

Ans: The North America region, contributes the largest market share in Oil Condition Monitoring Services market during the forecast period 2024-2031

Ans: The Industrial Internet of Things (IIoT) and the Industry 4.0 revolution bring great value to the development of oil condition monitoring services. Services are expected to shape the market in the coming years.

TABLE OF CONTENTS

1. Introduction
1.1 Market Definition
1.2 Scope
1.3 Research Assumptions

2. Industry Flowchart

3. Research Methodology

4. Market Dynamics
4.1 Drivers
4.2 Restraints
4.3 Opportunities
4.4 Challenges

5. Impact Analysis
5.1 Impact of Russia-Ukraine Crisis
5.2 Impact of Economic Slowdown on Major Countries
5.2.1 Introduction
5.2.2 United States
5.2.3 Canada
5.2.4 Germany
5.2.5 France
5.2.6 UK
5.2.7 China
5.2.8 Japan
5.2.9 South Korea
5.2.10 India

6. Value Chain Analysis

7. Porter’s 5 Forces Model

8. Pest Analysis

9. Oil Condition Monitoring Market Segmentation, By Product Type
9.1 Introduction
9.2 Trend Analysis
9.3 Compressor
9.4 Turbine
9.5 Engine
9.6 Hydraulic System
9.7 Other

10. Oil Condition Monitoring Market Segmentation, By Sampling Type
10.1 Introduction
10.2 Trend Analysis
10.3 On-Site
10.3.1 Portable Kit
10.3.2 Fixed Continuous Monitoring
10.4 Off-Site

11. Oil Condition Monitoring Market Segmentation, By Industry Vertical
11.1 Introduction
11.2 Trend Analysis
11.3Industrial
11.4 Mining
11.5 Transportation
11.6 Oil & Gas
11.7 Power Generation

12. Regional Analysis
12.1 Introduction
12.2 North America
12.2.1 Trend Analysis
12.2.2 North America Oil Condition Monitoring Market by Country
12.2.3 North America Oil Condition Monitoring Market By Product Type
12.2.4 North America Oil Condition Monitoring Market By Sampling Type
12.2.5 North America Oil Condition Monitoring Market By Industry Vertical
12.2.6 USA
12.2.6.1 USA Oil Condition Monitoring Market By Product Type
12.2.6.2 USA Oil Condition Monitoring Market By Sampling Type
12.2.6.3 USA Oil Condition Monitoring Market By Industry Vertical
12.2.7 Canada
12.2.7.1 Canada Oil Condition Monitoring Market By Product Type
12.2.7.2 Canada Oil Condition Monitoring Market By Sampling Type
12.2.7.3 Canada Oil Condition Monitoring Market By Industry Vertical
12.2.8 Mexico
12.2.8.1 Mexico Oil Condition Monitoring Market By Product Type
12.2.8.2 Mexico Oil Condition Monitoring Market By Sampling Type
12.2.8.3 Mexico Oil Condition Monitoring Market By Industry Vertical
12.3 Europe
12.3.1 Trend Analysis
12.3.2 Eastern Europe
12.3.2.1 Eastern Europe Oil Condition Monitoring Market by Country
12.3.2.2 Eastern Europe Oil Condition Monitoring Market By Product Type
12.3.2.3 Eastern Europe Oil Condition Monitoring Market By Sampling Type
12.3.2.4 Eastern Europe Oil Condition Monitoring Market By Industry Vertical
12.3.2.5 Poland
12.3.2.5.1 Poland Oil Condition Monitoring Market By Product Type
12.3.2.5.2 Poland Oil Condition Monitoring Market By Sampling Type
12.3.2.5.3 Poland Oil Condition Monitoring Market By Industry Vertical
12.3.2.6 Romania
12.3.2.6.1 Romania Oil Condition Monitoring Market By Product Type
12.3.2.6.2 Romania Oil Condition Monitoring Market By Sampling Type
12.3.2.6.4 Romania Oil Condition Monitoring Market By Industry Vertical
12.3.2.7 Hungary
12.3.2.7.1 Hungary Oil Condition Monitoring Market By Product Type
12.3.2.7.2 Hungary Oil Condition Monitoring Market By Sampling Type
12.3.2.7.3 Hungary Oil Condition Monitoring Market By Industry Vertical
12.3.2.8 Turkey
12.3.2.8.1 Turkey Oil Condition Monitoring Market By Product Type
12.3.2.8.2 Turkey Oil Condition Monitoring Market By Sampling Type
12.3.2.8.3 Turkey Oil Condition Monitoring Market By Industry Vertical
12.3.2.9 Rest of Eastern Europe
12.3.2.9.1 Rest of Eastern Europe Oil Condition Monitoring Market By Product Type
12.3.2.9.2 Rest of Eastern Europe Oil Condition Monitoring Market By Sampling Type
12.3.2.9.3 Rest of Eastern Europe Oil Condition Monitoring Market By Industry Vertical
12.3.3 Western Europe
12.3.3.1 Western Europe Oil Condition Monitoring Market by Country
12.3.3.2 Western Europe Oil Condition Monitoring Market By Product Type
12.3.3.3 Western Europe Oil Condition Monitoring Market By Sampling Type
12.3.3.4 Western Europe Oil Condition Monitoring Market By Industry Vertical
12.3.3.5 Germany
12.3.3.5.1 Germany Oil Condition Monitoring Market By Product Type
12.3.3.5.2 Germany Oil Condition Monitoring Market By Sampling Type
12.3.3.5.3 Germany Oil Condition Monitoring Market By Industry Vertical
12.3.3.6 France
12.3.3.6.1 France Oil Condition Monitoring Market By Product Type
12.3.3.6.2 France Oil Condition Monitoring Market By Sampling Type
12.3.3.6.3 France Oil Condition Monitoring Market By Industry Vertical
12.3.3.7 UK
12.3.3.7.1 UK Oil Condition Monitoring Market By Product Type
12.3.3.7.2 UK Oil Condition Monitoring Market By Sampling Type
12.3.3.7.3 UK Oil Condition Monitoring Market By Industry Vertical
12.3.3.8 Italy
12.3.3.8.1 Italy Oil Condition Monitoring Market By Product Type
12.3.3.8.2 Italy Oil Condition Monitoring Market By Sampling Type
12.3.3.8.3 Italy Oil Condition Monitoring Market By Industry Vertical
12.3.3.9 Spain
12.3.3.9.1 Spain Oil Condition Monitoring Market By Product Type
12.3.3.9.2 Spain Oil Condition Monitoring Market By Sampling Type
12.3.3.9.3 Spain Oil Condition Monitoring Market By Industry Vertical
12.3.3.10 Netherlands
12.3.3.10.1 Netherlands Oil Condition Monitoring Market By Product Type
12.3.3.10.2 Netherlands Oil Condition Monitoring Market By Sampling Type
12.3.3.10.3 Netherlands Oil Condition Monitoring Market By Industry Vertical
12.3.3.11 Switzerland
12.3.3.11.1 Switzerland Oil Condition Monitoring Market By Product Type
12.3.3.11.2 Switzerland Oil Condition Monitoring Market By Sampling Type
12.3.3.11.3 Switzerland Oil Condition Monitoring Market By Industry Vertical
12.3.3.1.12 Austria
12.3.3.12.1 Austria Oil Condition Monitoring Market By Product Type
12.3.3.12.2 Austria Oil Condition Monitoring Market By Sampling Type
12.3.3.12.3 Austria Oil Condition Monitoring Market By Industry Vertical
12.3.3.13 Rest of Western Europe
12.3.3.13.1 Rest of Western Europe Oil Condition Monitoring Market By Product Type
12.3.3.13.2 Rest of Western Europe Oil Condition Monitoring Market By Sampling Type
12.3.3.13.3 Rest of Western Europe Oil Condition Monitoring Market By Industry Vertical
12.4 Asia-Pacific
12.4.1 Trend Analysis
12.4.2 Asia-Pacific Oil Condition Monitoring Market by Country
12.4.3 Asia-Pacific Oil Condition Monitoring Market By Product Type
12.4.4 Asia-Pacific Oil Condition Monitoring Market By Sampling Type
12.4.5 Asia-Pacific Oil Condition Monitoring Market By Industry Vertical
12.4.6 China
12.4.6.1 China Oil Condition Monitoring Market By Product Type
12.4.6.2 China Oil Condition Monitoring Market By Sampling Type
12.4.6.3 China Oil Condition Monitoring Market By Industry Vertical
12.4.7 India
12.4.7.1 India Oil Condition Monitoring Market By Product Type
12.4.7.2 India Oil Condition Monitoring Market By Sampling Type
12.4.7.3 India Oil Condition Monitoring Market By Industry Vertical
12.4.8 Japan
12.4.8.1 Japan Oil Condition Monitoring Market By Product Type
12.4.8.2 Japan Oil Condition Monitoring Market By Sampling Type
12.4.8.3 Japan Oil Condition Monitoring Market By Industry Vertical
12.4.9 South Korea
12.4.9.1 South Korea Oil Condition Monitoring Market By Product Type
12.4.9.2 South Korea Oil Condition Monitoring Market By Sampling Type
12.4.9.3 South Korea Oil Condition Monitoring Market By Industry Vertical
12.4.10 Vietnam
12.4.10.1 Vietnam Oil Condition Monitoring Market By Product Type
12.4.10.2 Vietnam Oil Condition Monitoring Market By Sampling Type
12.4.10.3 Vietnam Oil Condition Monitoring Market By Industry Vertical
12.4.11 Singapore
12.4.11.1 Singapore Oil Condition Monitoring Market By Product Type
12.4.11.2 Singapore Oil Condition Monitoring Market By Sampling Type
12.4.11.3 Singapore Oil Condition Monitoring Market By Industry Vertical
12.4.12 Australia
12.4.12.1 Australia Oil Condition Monitoring Market By Product Type
12.4.12.2 Australia Oil Condition Monitoring Market By Sampling Type
12.4.12.3 Australia Oil Condition Monitoring Market By Industry Vertical
12.4.13 Rest of Asia-Pacific
12.4.13.1 Rest of Asia-Pacific Oil Condition Monitoring Market By Product Type
12.4.13.2 Rest of Asia-Pacific Oil Condition Monitoring Market By Sampling Type
12.4.13.3 Rest of Asia-Pacific Oil Condition Monitoring Market By Industry Vertical
12.5 Middle East & Africa
12.5.1 Trend Analysis
12.5.2 Middle East
12.5.2.1 Middle East Oil Condition Monitoring Market by Country
12.5.2.2 Middle East Oil Condition Monitoring Market By Product Type
12.5.2.3 Middle East Oil Condition Monitoring Market By Sampling Type
12.5.2.4 Middle East Oil Condition Monitoring Market By Industry Vertical
12.5.2.5 UAE
12.5.2.5.1 UAE Oil Condition Monitoring Market By Product Type
12.5.2.5.2 UAE Oil Condition Monitoring Market By Sampling Type
12.5.2.5.3 UAE Oil Condition Monitoring Market By Industry Vertical
12.5.2.6 Egypt
12.5.2.6.1 Egypt Oil Condition Monitoring Market By Product Type
12.5.2.6.2 Egypt Oil Condition Monitoring Market By Sampling Type
12.5.2.6.3 Egypt Oil Condition Monitoring Market By Industry Vertical
12.5.2.7 Saudi Arabia
12.5.2.7.1 Saudi Arabia Oil Condition Monitoring Market By Product Type
12.5.2.7.2 Saudi Arabia Oil Condition Monitoring Market By Sampling Type
12.5.2.7.3 Saudi Arabia Oil Condition Monitoring Market By Industry Vertical
12.5.2.8 Qatar
12.5.2.8.1 Qatar Oil Condition Monitoring Market By Product Type
12.5.2.8.2 Qatar Oil Condition Monitoring Market By Sampling Type
12.5.2.8.3 Qatar Oil Condition Monitoring Market By Industry Vertical
12.5.2.9 Rest of Middle East
12.5.2.9.1 Rest of Middle East Oil Condition Monitoring Market By Product Type
12.5.2.9.2 Rest of Middle East Oil Condition Monitoring Market By Sampling Type
12.5.2.9.3 Rest of Middle East Oil Condition Monitoring Market By Industry Vertical
12.5.3 Africa
12.5.3.1 Africa Oil Condition Monitoring Market by Country
12.5.3.2 Africa Oil Condition Monitoring Market By Product Type
12.5.3.3 Africa Oil Condition Monitoring Market By Sampling Type
12.5.3.4 Africa Oil Condition Monitoring Market By Industry Vertical
12.5.3.5 Nigeria
12.5.3.5.1 Nigeria Oil Condition Monitoring Market By Product Type
12.5.3.5.2 Nigeria Oil Condition Monitoring Market By Sampling Type
12.5.3.5.3 Nigeria Oil Condition Monitoring Market By Industry Vertical
12.5.3.6 South Africa
12.5.3.6.1 South Africa Oil Condition Monitoring Market By Product Type
12.5.3.6.2 South Africa Oil Condition Monitoring Market By Sampling Type
12.5.3.6.3 South Africa Oil Condition Monitoring Market By Industry Vertical
12.5.3.7 Rest of Africa
12.5.3.7.1 Rest of Africa Oil Condition Monitoring Market By Product Type
12.5.3.7.2 Rest of Africa Oil Condition Monitoring Market By Sampling Type
12.5.3.7.3 Rest of Africa Oil Condition Monitoring Market By Industry Vertical
12.6 Latin America
12.6.1 Trend Analysis
12.6.2 Latin America Oil Condition Monitoring Market by country
12.6.3 Latin America Oil Condition Monitoring Market By Product Type
12.6.4 Latin America Oil Condition Monitoring Market By Sampling Type
12.6.5 Latin America Oil Condition Monitoring Market By Industry Vertical
12.6.6 Brazil
12.6.6.1 Brazil Oil Condition Monitoring Market By Product Type
12.6.6.2 Brazil Oil Condition Monitoring Market By Sampling Type
12.6.6.3 Brazil Oil Condition Monitoring Market By Industry Vertical
12.6.7 Argentina
12.6.7.1 Argentina Oil Condition Monitoring Market By Product Type
12.6.7.2 Argentina Oil Condition Monitoring Market By Sampling Type
12.6.7.3 Argentina Oil Condition Monitoring Market By Industry Vertical
12.6.8 Colombia
12.6.8.1 Colombia Oil Condition Monitoring Market By Product Type
12.6.8.2 Colombia Oil Condition Monitoring Market By Sampling Type
12.6.8.3 Colombia Oil Condition Monitoring Market By Industry Vertical
12.6.9 Rest of Latin America
12.6.9.1 Rest of Latin America Oil Condition Monitoring Market By Product Type
12.6.9.2 Rest of Latin America Oil Condition Monitoring Market By Sampling Type
12.6.9.3 Rest of Latin America Oil Condition Monitoring Market By Industry Vertical

13. Company Profiles
13.1 Parker-Hannifin Corporation (US)
13.1.1 Company Overview
13.1.2 Financial
13.1.3 Products/ Services Offered
13.1.4 SWOT Analysis
13.1.5 The SNS View
13.2 General Electric (US)
13.2.1 Company Overview
13.2.2 Financial
13.2.3 Products/ Services Offered
13.2.4 SWOT Analysis
13.2.5 The SNS View
13.3 Shell plc (Netherlands)
13.3.1 Company Overview
13.3.2 Financial
13.3.3 Products/ Services Offered
13.3.4 SWOT Analysis
13.3.5 The SNS View
13.4  BP plc (UK)
13.4.1 Company Overview
13.4.2 Financial
13.4.3 Products/ Services Offered
13.4.4 SWOT Analysis
13.4.5 The SNS View
13.5 Bureau Veritas (France)
13.5.1 Company Overview
13.5.2 Financial
13.5.3 Products/ Services Offered
13.5.4 SWOT Analysis
13.5.5 The SNS View
13.6 Chevron Corporation (Switzerland)
13.6.1 Company Overview
13.6.2 Financial
13.6.3 Products/ Services Offered
13.6.4 SWOT Analysis
13.6.5 The SNS View
13.7 Intertek Group plc (UK)
13.7.1 Company Overview
13.7.2 Financial
13.7.3 Products/ Services Offered
13.7.4 SWOT Analysis
13.7.5 The SNS View
13.8 SGS SA (France)
13.8.1 Company Overview
13.8.2 Financial
13.8.3 Products/ Services Offered
13.8.4 SWOT Analysis
13.8.5 The SNS View
13.9 Eaton Corporation (Ireland)
13.9.1 Company Overview
13.9.2 Financial
13.9.3 Products/ Services Offered
13.9.4 SWOT Analysis
13.9.5 The SNS View
13.10 TotalEnergies (France)
13.10.1 Company Overview
13.10.2 Financial
13.10.3 Products/ Services Offered
13.10.4 SWOT Analysis
13.10.5 The SNS View

14. Competitive Landscape
14.1 Competitive Benchmarking
14.2 Market Share Analysis
14.3 Recent Developments
14.3.1 Industry News
14.3.2 Company News
14.3.3 Mergers & Acquisitions

15. Use Case and Best Practices

16. Conclusion

An accurate research report requires proper strategizing as well as implementation. There are multiple factors involved in the completion of good and accurate research report and selecting the best methodology to compete the research is the toughest part. Since the research reports we provide play a crucial role in any company’s decision-making process, therefore we at SNS Insider always believe that we should choose the best method which gives us results closer to reality. This allows us to reach at a stage wherein we can provide our clients best and accurate investment to output ratio.

Each report that we prepare takes a timeframe of 350-400 business hours for production. Starting from the selection of titles through a couple of in-depth brain storming session to the final QC process before uploading our titles on our website we dedicate around 350 working hours. The titles are selected based on their current market cap and the foreseen CAGR and growth.


The 5 steps process:

Step 1: Secondary Research:

Secondary Research or Desk Research is as the name suggests is a research process wherein, we collect data through the readily available information. In this process we use various paid and unpaid databases which our team has access to and gather data through the same. This includes examining of listed companies’ annual reports, Journals, SEC filling etc. Apart from this our team has access to various associations across the globe across different industries. Lastly, we have exchange relationships with various university as well as individual libraries.

Secondary Research

Step 2: Primary Research

When we talk about primary research, it is a type of study in which the researchers collect relevant data samples directly, rather than relying on previously collected data.  This type of research is focused on gaining content specific facts that can be sued to solve specific problems. Since the collected data is fresh and first hand therefore it makes the study more accurate and genuine.

We at SNS Insider have divided Primary Research into 2 parts.

Part 1 wherein we interview the KOLs of major players as well as the upcoming ones across various geographic regions. This allows us to have their view over the market scenario and acts as an important tool to come closer to the accurate market numbers. As many as 45 paid and unpaid primary interviews are taken from both the demand and supply side of the industry to make sure we land at an accurate judgement and analysis of the market.

This step involves the triangulation of data wherein our team analyses the interview transcripts, online survey responses and observation of on filed participants. The below mentioned chart should give a better understanding of the part 1 of the primary interview.

Primary Research

Part 2: In this part of primary research the data collected via secondary research and the part 1 of the primary research is validated with the interviews from individual consultants and subject matter experts.

Consultants are those set of people who have at least 12 years of experience and expertise within the industry whereas Subject Matter Experts are those with at least 15 years of experience behind their back within the same space. The data with the help of two main processes i.e., FGDs (Focused Group Discussions) and IDs (Individual Discussions). This gives us a 3rd party nonbiased primary view of the market scenario making it a more dependable one while collation of the data pointers.

Step 3: Data Bank Validation

Once all the information is collected via primary and secondary sources, we run that information for data validation. At our intelligence centre our research heads track a lot of information related to the market which includes the quarterly reports, the daily stock prices, and other relevant information. Our data bank server gets updated every fortnight and that is how the information which we collected using our primary and secondary information is revalidated in real time.

Data Bank Validation

Step 4: QA/QC Process

After all the data collection and validation our team does a final level of quality check and quality assurance to get rid of any unwanted or undesired mistakes. This might include but not limited to getting rid of the any typos, duplication of numbers or missing of any important information. The people involved in this process include technical content writers, research heads and graphics people. Once this process is completed the title gets uploader on our platform for our clients to read it.

Step 5: Final QC/QA Process:

This is the last process and comes when the client has ordered the study. In this process a final QA/QC is done before the study is emailed to the client. Since we believe in giving our clients a good experience of our research studies, therefore, to make sure that we do not lack at our end in any way humanly possible we do a final round of quality check and then dispatch the study to the client.


  •            5000 (33% Discount)


  •            8950 (40% Discount)


  •            3050 (23% Discount)

Start a Conversation

Hi! Click one of our member below to chat on Phone