Oil Country Tubular Goods Market Report Scope & Overview:

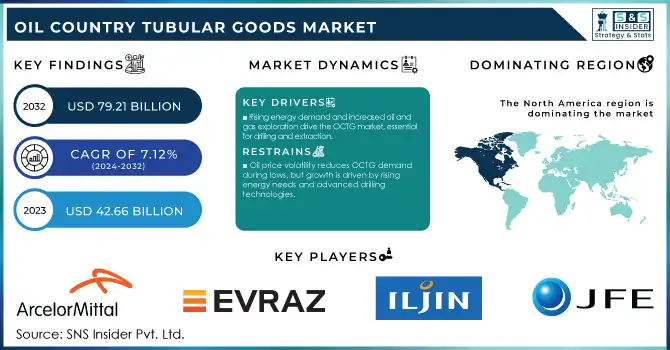
The Oil Country Tubular Goods Market size was valued at USD 45.70 billion in 2024 and is projected to reach USD 79.22 billion by 2032, growing at a CAGR of 7.12% during 2025-2032. The Oil Country Tubular Goods (OCTG) market is primarily driven by the growing demand for oil and gas exploration and production activities, especially in offshore and unconventional reserves. These products, which include drill pipes, casing, tubing, and other steel pipes, are essential for the drilling and extraction of petroleum and natural gas. The increasing energy demand, combined with technological advancements in drilling methods like hydraulic fracturing and horizontal drilling, has significantly boosted the demand for OCTG products.

One of the key growth drivers for the OCTG market is the resurgence of global oil prices, which has incentivized oil and gas companies to increase production activities. This has led to higher investment in exploration and production (E&P), further stimulating the need for durable and high-performance OCTG products that can withstand extreme pressure and harsh environments. The market is also benefiting from innovations in material science, with the development of more corrosion-resistant, high-strength steel grades that enhance the performance of OCTG products in challenging drilling conditions.

Oil Country Tubular Goods Market Revenue Analysis

To Get More Information on Oil Country Tubular Goods Market - Request Sample Report

Key Oil Country Tubular Goods Market Trends

  • Smart monitoring frameworks are utilized to strengthen fault recognition, allow rapid issue discovery, and enhance preventive servicing in drilling activities.

  • Energy-efficient process innovations are embraced to minimize costs while maintaining sustainable production efficiency.

  • Next-generation safety architectures are progressing to reinforce worker-machine interaction, elevating protection during testing and operational workflows.

  • Modular equipment designs are favored, enabling expansion, faster alignment, and industry-specific versatility across various applications.

  • Integrated digital ecosystems are advancing, supporting offsite oversight, resource analytics, and foresight-driven evaluations to maximize tubular reliability.

Oil Country Tubular Goods Market Growth Drivers:

  • The growth in global oil and gas exploration activities, driven by rising demand for energy, is fueling the OCTG market as these products are crucial for drilling and extraction processes.

The growing global demand for oil and natural gas is a key factor driving the Oil Country Tubular Goods (OCTG) market. As countries and companies continue to expand exploration and production activities to meet energy needs, the demand for OCTG products, which are crucial for drilling and extraction processes, has significantly increased. Exploration activities, particularly in offshore and deep-water fields, require specialized OCTG products that can withstand extreme conditions such as high pressure and corrosive environments. This trend is further amplified by the rise in unconventional oil and gas extraction techniques like hydraulic fracturing and horizontal drilling, which demand high-performance OCTG materials.

In addition to the ongoing exploration, technological advancements in drilling and extraction techniques have made it more feasible to tap into previously inaccessible reserves, thereby fueling the growth of the OCTG market. The expansion of the oil and gas sector, especially in emerging economies, is also contributing to market growth. As energy demand rises globally, the oil and gas industry's efforts to increase production capacity and optimize extraction processes drive continued demand for OCTG products, making them an essential part of the industry's infrastructure. This dynamic is expected to further accelerate the growth of the OCTG market in the coming years.

Oil Country Tubular Goods Market Restraints:

  • Volatility in oil prices can lead to reduced demand for OCTG products during low-price periods, though the market is expected to grow as global energy demand increases and new drilling technologies emerge.

Volatility in oil prices significantly impacts the Oil Country Tubular Goods (OCTG) market, as fluctuations in prices can influence the overall profitability of oil and gas companies. When oil prices are high, companies have higher margins, allowing them to invest more in exploration, drilling, and production activities. This increased spending on exploration, particularly in unconventional and offshore reserves, drives demand for OCTG products, which are critical for drilling and completing wells. However, during periods of low oil prices, profitability drops, leading to tighter budgets for exploration and production. As a result, oil companies often scale back on drilling projects, delay new investments, and focus on more cost-efficient operations. This cautious approach reduces the demand for OCTG, directly impacting manufacturers of these goods. Despite these challenges, the market is expected to grow as the global energy demand rises and new drilling technologies continue to emerge. Companies are also adapting by developing more cost-effective and durable OCTG products suited for low-price environments. Additionally, the oil and gas industry is showing signs of recovery in certain regions, suggesting that the OCTG market will see gradual growth in the coming years, especially with a focus on high-performance and specialized products.

Oil Country Tubular Goods Market Segment Outlook

By Product

Well casing segment dominated with the market share over 48% in 2024, primarily due to its critical role in maintaining the structural integrity of oil and gas wells. It prevents wellbore collapse, ensures the safe extraction of hydrocarbons, and protects surrounding environments from contamination. As exploration and production activities increase, particularly in complex and deeper reservoirs, the demand for well casing remains strong. The growth of unconventional oil and gas resources, including shale oil and gas, further fuels the need for robust and durable well-casing solutions. Additionally, well casing plays a crucial role in isolating different layers within a well, ensuring the efficiency and safety of the drilling and production process. Given its importance in the well construction process, well casing continues to drive growth and is expected to maintain its dominant position in the OCTG market, especially in the face of increasing global oil and gas production activities.

Oil Country Tubular Goods Market Regional Analysis

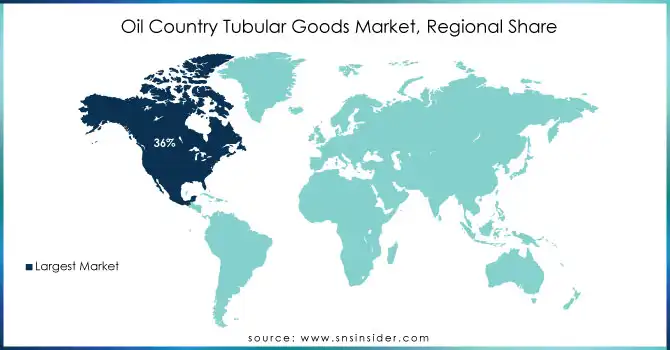
North America Oil Country Tubular Goods Market Insights

North America region dominated with a market share of over 36% in 2024, primarily due to its substantial oil and gas production, particularly from shale reserves. The United States has experienced a significant increase in drilling activities, driven by the development of unconventional resources like shale oil and gas. This surge in exploration and production directly fuels the demand for OCTG products, such as well casing, drill pipes, and production tubing, which are essential for drilling and maintaining well integrity. North America's strong oil and gas industry, combined with advancements in drilling technologies, ensures a continuous need for OCTG products. The region's dominance is also supported by large-scale investments in infrastructure and exploration projects, alongside the increasing focus on energy independence.

Asia-Pacific Oil Country Tubular Goods Market Insights

The Asia-Pacific region is the fastest-growing in the Oil Country Tubular Goods (OCTG) market, driven by the increasing energy demand in countries like China, India, and Indonesia. As these nations experience rapid industrialization and urbanization, the need for oil and gas to support their growing economies is escalating. This has spurred more exploration and production activities, particularly in offshore oil and gas fields. The expansion of deepwater and subsea oil reserves in the region has significantly contributed to the demand for OCTG products, such as well casing, drill pipes, and production tubing. Furthermore, governments and energy companies in Asia-Pacific are investing heavily in advanced drilling technologies and infrastructure to meet energy needs, further boosting the market.

Europe Oil Country Tubular Goods Market Insights

Europe holds a significant share in the OCTG market, driven by mature oil and gas industries in countries like the U.K., Norway, and the Netherlands. Offshore drilling in the North Sea remains a key revenue source, necessitating high-quality well casing, drill pipes, and tubing. Stringent environmental and safety regulations influence product specifications and promote the adoption of advanced, corrosion-resistant tubular goods. Additionally, investments in technological upgrades for exploration and production operations enhance market demand, particularly for specialized OCTG solutions that ensure operational efficiency and longevity.

Middle East & Africa Oil Country Tubular Goods Market Insights

The Middle East & Africa region is characterized by vast conventional oil reserves, especially in countries such as Saudi Arabia, UAE, and Nigeria. High-volume drilling and production operations fuel consistent demand for OCTG products. Infrastructure expansion, coupled with government initiatives to modernize oilfield operations, drives the adoption of advanced tubular goods. Additionally, Africa’s emerging oil-producing nations are contributing to regional growth, with a focus on deepwater and onshore exploration projects that require robust and durable OCTG solutions.

Latin America Oil Country Tubular Goods Market Insights

Latin America is witnessing growing demand for OCTG products due to increased offshore and onshore exploration activities in Brazil, Argentina, and Mexico. Investment in unconventional resources, such as shale and tight oil, is boosting drilling operations, thereby increasing the need for well casing, drill pipes, and production tubing. Technological modernization, including deepwater drilling and enhanced oil recovery methods, further supports market expansion. Regulatory reforms and collaboration between multinational oil companies and local governments are also driving OCTG adoption in the region.

Oil-Country-Tubular-Goods-Market-Regional-Share

Do You Need any Customization Research on Oil Country Tubular Goods Market - Inquire Now

Oil Country Tubular Goods Companies:

  • ArcelorMittal SA 

  • Evraz North America plc 

  • Iljin Steel Corporation 

  • JFE Steel Corporation 

  • NOV Inc. 

  • Oil Country Tubular Limited 

  • Sumitomo Corporation 

  • Tenaris 

  • TMK Inc.

  • U.S. Steel Corporation

  • ArcelorMittal Tubular Products

  • Valourec

  • Vallourec Star

  • Wheatland Tube

  • Baosteel Group

  • Hyundai Steel Company

  • TMK IPSCO

  • Pioneer Pipe

  • Maverick Tube Corporation

  • Masteel 

Competitive Landscape for Oil Country Tubular Goods Market:

Nippon Steel Corporation is a leading Japanese steel producer headquartered in Tokyo, Japan, and founded in 1950. It is one of the world’s largest steel manufacturers, known for producing high-grade steel products for industries such as automotive, construction, energy, and infrastructure. Nippon Steel emphasizes advanced technology, sustainable manufacturing, and global expansion, operating in multiple countries with a strong focus on innovation and eco-friendly steelmaking. Its diverse portfolio includes flat products, long products, pipes, and specialty steels, serving as a critical supplier in global industrial value chains.

  • In November 2023, Nippon Steel Corporation received EcoLeaf Environmental Product Declarations for three types of high-alloy OCTG and line pipe products, based on the Japan EPD Program managed by the Sustainable Management Promotion Organization (SuMPO). These are the first EPDs for stainless steel products produced in Japan.

Vallourec is a French multinational specializing in premium tubular solutions, headquartered in Meudon, France, and founded in 1957. The company is a global leader in producing seamless steel tubes and related solutions for the energy, oil & gas, power generation, and industrial sectors. Vallourec focuses on innovation, digitalization, and sustainability to deliver high-performance products that meet demanding industry standards. With a strong international presence across Europe, the Americas, Asia, and the Middle East, Vallourec plays a vital role in enabling safe and efficient operations in critical sectors such as offshore drilling, pipelines, and advanced engineering applications.

  • In September 2024, Vallourec, a global leader in premium seamless tubular solutions, announced the signing of a major contract with Petrobras, a key player in the global energy sector, following a competitive bidding process. The contract includes the supply of premium Oil Country Tubular Goods (OCTG) and accessories for the advanced Sepia 2 and Atapu 2 projects. In addition, Vallourec will offer a full range of supporting services, including Tubular Management Services, VAM Field Service, and the complete suite of its digital solutions.

Oil Country Tubular Goods Market Report Scope:

Report Attributes Details
Market Size in 2024 USD 42.66 Billion 
Market Size by 2032 USD 79.21 Billion 
CAGR CAGR of 17.12% From 2025 to 2032
Base Year 2024
Forecast Period 2025-2032
Historical Data 2021-2023
Report Scope & Coverage Market Size, Segments Analysis, Competitive  Landscape, Regional Analysis, DROC & SWOT Analysis, Forecast Outlook
Key Segments • By Process (Seamless, Welded)
• By Product (Well Casing, Production Tubing, Drill Pipe, Others)
• By Application (Onshore, Offshore)
Regional Analysis/Coverage

North America (US, Canada), Europe (Germany, France, UK, Italy, Spain, Poland, Russsia, Rest of Europe), Asia Pacific (China, India, Japan, South Korea, Australia, ASEAN Countries, Rest of Asia Pacific), Middle East & Africa (UAE, Saudi Arabia, Qatar, Egypt, South Africa, Rest of Middle East & Africa), Latin America (Brazil, Argentina,     Mexico, Colombia Rest of Latin America)

Company Profiles

ArcelorMittal SA, Evraz North America plc, Iljin Steel Corporation, JFE Steel Corporation, NOV Inc., Oil Country Tubular Limited, Sumitomo Corporation, Tenaris, TMK Inc., U.S. Steel Corporation, ArcelorMittal Tubular Products, Vallourec, Vallourec Star, Wheatland Tube, Baosteel Group, Hyundai Steel Company, TMK IPSCO, Pioneer Pipe, Maverick Tube Corporation, Masteel.

Table Of Contents

1. Introduction

1.1 Market Definition & Scope

 1.2 Research Assumptions & Abbreviations

 1.3 Research Methodology

2. Executive Summary

2.1 Market Snapshot

 2.2 Market Absolute $ Opportunity Assessment & Y-o-Y Analysis, 2021–2032

 2.3 Market Size & Forecast, By Segmentation, 2021–2032

  2.3.1 Market Size By Process

  2.3.2 Market Size By Product

  2.3.3 Market Size By Application

 2.4 Market Share & Bps Analysis By Region, 2024

 2.5 Industry Growth Scenarios – Conservative, Likely & Optimistic

 2.6 Industry CxO’s Perspective

3. Market Overview

3.1 Market Dynamics

  3.1.1 Drivers

  3.1.2 Restraints

  3.1.3 Opportunities

  3.1.4 Key Market Trends

 3.2 Industry PESTLE Analysis

 3.3 Key Industry Forces (Porter’s) Impacting Market Growth

 3.4 Industry Supply Chain Analysis

  3.4.1 Raw Material Suppliers

  3.4.2 Manufacturers

  3.4.3 Distributors/Suppliers

  3.4.4 Customers/End-Users

 3.5 Industry Life Cycle Assessment

 3.6 Parent Market Overview

 3.7 Market Risk Assessment

4. Statistical Insights & Trends Reporting

4.1 Eco-Friendly Practices & Compliance Standards

4.2 Novel Extraction Techniques & Advanced Blending Approaches

4.3 Risk Mapping of Distribution Pathways & Raw Material Dependence

4.4 Smart Processing Technologies & Adaptive Wrapping Methods

4.5 Strategic Partnerships, Mergers & Global Reach Enhancement

5. Oil Country Tubular Goods Market Segmental Analysis & Forecast, By Process, 2021 – 2032, Value (USD Billion)

5.1 Introduction

 5.2 Seamless

  5.2.1 Key Trends

  5.2.2 Market Size & Forecast, 2021 – 2032

 5.3 Welded

  5.3.1 Key Trends

  5.3.2 Market Size & Forecast, 2021 – 2032

6. Oil Country Tubular Goods Market Segmental Analysis & Forecast, By Product, 2021 – 2032, Value (USD Billion)

    6.1 Introduction

 6.2 Well Casing

  6.2.1 Key Trends

  6.2.2 Market Size & Forecast, 2021 – 2032

 6.3 Production Tubing

  6.3.1 Key Trends

  6.3.2 Market Size & Forecast, 2021 – 2032

 6.4 Drill Pipe

  6.4.1 Key Trends

  6.4.2 Market Size & Forecast, 2021 – 2032

 6.5 Others

  6.5.1 Key Trends

  6.5.2 Market Size & Forecast, 2021 – 2032

7. Oil Country Tubular Goods Market Segmental Analysis & Forecast, By Application, 2021 – 2032, Value (USD Billion)

    7.1 Introduction

 7.2 Onshore

  7.2.1 Key Trends

  7.2.2 Market Size & Forecast, 2021 – 2032

 7.3 Offshore

  7.3.1 Key Trends

  7.3.2 Market Size & Forecast, 2021 – 2032

8. Oil Country Tubular Goods Market Segmental Analysis & Forecast By Region, 2021 – 2025, Value (USD Billion)

8.1 Introduction

8.2 North America

 8.2.1 Key Trends

 8.2.2 Oil Country Tubular Goods Market Size & Forecast, By Process, 2021 – 2032

 8.2.3 Oil Country Tubular Goods Market Size & Forecast, By Product, 2021 – 2032

 8.2.4 Oil Country Tubular Goods Market Size & Forecast, By Application, 2021 – 2032

 8.2.5 Oil Country Tubular Goods Market Size & Forecast, By Country, 2021 – 2032

  8.2.5.1 USA

   8.2.5.1.1 Oil Country Tubular Goods Market Size & Forecast, By Process, 2021 – 2032

   8.2.5.1.2 Oil Country Tubular Goods Market Size & Forecast, By Product, 2021 – 2032

   8.2.5.1.3 Oil Country Tubular Goods Market Size & Forecast, By Application, 2021 – 2032

  8.2.5.2 Canada

   8.2.5.2.1 Oil Country Tubular Goods Market Size & Forecast, By Process, 2021 – 2032

   8.2.5.2.2 Oil Country Tubular Goods Market Size & Forecast, By Product, 2021 – 2032

   8.2.5.2.3 Oil Country Tubular Goods Market Size & Forecast, By Application, 2021 – 2032

8.3 Europe

 8.3.1 Key Trends

 8.3.2 Oil Country Tubular Goods Market Size & Forecast, By Process, 2021 – 2032

 8.3.3 Oil Country Tubular Goods Market Size & Forecast, By Product, 2021 – 2032

 8.3.4 Oil Country Tubular Goods Market Size & Forecast, By Application, 2021 – 2032

 8.3.5 Oil Country Tubular Goods Market Size & Forecast, By Country, 2021 – 2032

  8.3.5.1 Germany

   8.3.5.1.1 Oil Country Tubular Goods Market Size & Forecast, By Process, 2021 – 2032

   8.3.5.1.2 Oil Country Tubular Goods Market Size & Forecast, By Product, 2021 – 2032

   8.3.5.1.3 Oil Country Tubular Goods Market Size & Forecast, By Application, 2021 – 2032

  8.3.5.2 UK

   8.3.5.2.1 Oil Country Tubular Goods Market Size & Forecast, By Process, 2021 – 2032

   8.3.5.2.2 Oil Country Tubular Goods Market Size & Forecast, By Product, 2021 – 2032

   8.3.5.2.3 Oil Country Tubular Goods Market Size & Forecast, By Application, 2021 – 2032

  8.3.5.3 France

   8.3.5.3.1 Oil Country Tubular Goods Market Size & Forecast, By Process, 2021 – 2032

   8.3.5.3.2 Oil Country Tubular Goods Market Size & Forecast, By Product, 2021 – 2032

   8.3.5.3.3 Oil Country Tubular Goods Market Size & Forecast, By Application, 2021 – 2032

  8.3.5.4 Italy

   8.3.5.4.1 Oil Country Tubular Goods Market Size & Forecast, By Process, 2021 – 2032

   8.3.5.4.2 Oil Country Tubular Goods Market Size & Forecast, By Product, 2021 – 2032

   8.3.5.4.3 Oil Country Tubular Goods Market Size & Forecast, By Application, 2021 – 2032

  8.3.5.5 Spain

   8.3.5.5.1 Oil Country Tubular Goods Market Size & Forecast, By Process, 2021 – 2032

   8.3.5.5.2 Oil Country Tubular Goods Market Size & Forecast, By Product, 2021 – 2032

   8.3.5.5.3 Oil Country Tubular Goods Market Size & Forecast, By Application, 2021 – 2032

  8.3.5.6 Russia

   8.3.5.6.1 Oil Country Tubular Goods Market Size & Forecast, By Process, 2021 – 2032

   8.3.5.6.2 Oil Country Tubular Goods Market Size & Forecast, By Product, 2021 – 2032

   8.3.5.6.3 Oil Country Tubular Goods Market Size & Forecast, By Application, 2021 – 2032

  8.3.5.7 Poland

   8.3.5.7.1 Oil Country Tubular Goods Market Size & Forecast, By Process, 2021 – 2032

   8.3.5.7.2 Oil Country Tubular Goods Market Size & Forecast, By Product, 2021 – 2032

   8.3.5.7.3 Oil Country Tubular Goods Market Size & Forecast, By Application, 2021 – 2032

  8.3.5.8 Rest of Europe

   8.3.5.8.1 Oil Country Tubular Goods Market Size & Forecast, By Process, 2021 – 2032

   8.3.5.8.2 Oil Country Tubular Goods Market Size & Forecast, By Product, 2021 – 2032

   8.3.5.8.3 Oil Country Tubular Goods Market Size & Forecast, By Application, 2021 – 2032

8.4 Asia-Pacific

 8.4.1 Key Trends

 8.4.2 Oil Country Tubular Goods Market Size & Forecast, By Process, 2021 – 2032

 8.4.3 Oil Country Tubular Goods Market Size & Forecast, By Product, 2021 – 2032

 8.4.4 Oil Country Tubular Goods Market Size & Forecast, By Application, 2021 – 2032

 8.4.5 Oil Country Tubular Goods Market Size & Forecast, By Country, 2021 – 2032

  8.4.5.1 China

   8.4.5.1.1 Oil Country Tubular Goods Market Size & Forecast, By Process, 2021 – 2032

   8.4.5.1.2 Oil Country Tubular Goods Market Size & Forecast, By Product, 2021 – 2032

   8.4.5.1.3 Oil Country Tubular Goods Market Size & Forecast, By Application, 2021 – 2032

  8.4.5.2 India

   8.4.5.2.1 Oil Country Tubular Goods Market Size & Forecast, By Process, 2021 – 2032

   8.4.5.2.2 Oil Country Tubular Goods Market Size & Forecast, By Product, 2021 – 2032

   8.4.5.2.3 Oil Country Tubular Goods Market Size & Forecast, By Application, 2021 – 2032

  8.4.5.3 Japan

   8.4.5.3.1 Oil Country Tubular Goods Market Size & Forecast, By Process, 2021 – 2032

   8.4.5.3.2 Oil Country Tubular Goods Market Size & Forecast, By Product, 2021 – 2032

   8.4.5.3.3 Oil Country Tubular Goods Market Size & Forecast, By Application, 2021 – 2032

  8.4.5.4 South Korea

   8.4.5.4.1 Oil Country Tubular Goods Market Size & Forecast, By Process, 2021 – 2032

   8.4.5.4.2 Oil Country Tubular Goods Market Size & Forecast, By Product, 2021 – 2032

   8.4.5.4.3 Oil Country Tubular Goods Market Size & Forecast, By Application, 2021 – 2032

  8.4.5.5 Australia

   8.4.5.5.1 Oil Country Tubular Goods Market Size & Forecast, By Process, 2021 – 2032

   8.4.5.5.2 Oil Country Tubular Goods Market Size & Forecast, By Product, 2021 – 2032

   8.4.5.5.3 Oil Country Tubular Goods Market Size & Forecast, By Application, 2021 – 2032

  8.4.5.6 ASEAN Countries

   8.4.5.6.1 Oil Country Tubular Goods Market Size & Forecast, By Process, 2021 – 2032

   8.4.5.6.2 Oil Country Tubular Goods Market Size & Forecast, By Product, 2021 – 2032

   8.4.5.6.3 Oil Country Tubular Goods Market Size & Forecast, By Application, 2021 – 2032

  8.4.5.7 Rest of Asia-Pacific

   8.4.5.7.1 Oil Country Tubular Goods Market Size & Forecast, By Process, 2021 – 2032

   8.4.5.7.2 Oil Country Tubular Goods Market Size & Forecast, By Product, 2021 – 2032

   8.4.5.7.3 Oil Country Tubular Goods Market Size & Forecast, By Application, 2021 – 2032

8.5 Latin America

 8.5.1 Key Trends

 8.5.2 Oil Country Tubular Goods Market Size & Forecast, By Process, 2021 – 2032

 8.5.3 Oil Country Tubular Goods Market Size & Forecast, By Product, 2021 – 2032

 8.5.4 Oil Country Tubular Goods Market Size & Forecast, By Application, 2021 – 2032

 8.5.5 Oil Country Tubular Goods Market Size & Forecast, By Country, 2021 – 2032

  8.5.5.1 Brazil

   8.5.5.1.1 Oil Country Tubular Goods Market Size & Forecast, By Process, 2021 – 2032

   8.5.5.1.2 Oil Country Tubular Goods Market Size & Forecast, By Product, 2021 – 2032

   8.5.5.1.3 Oil Country Tubular Goods Market Size & Forecast, By Application, 2021 – 2032

  8.5.5.2 Argentina

   8.5.5.2.1 Oil Country Tubular Goods Market Size & Forecast, By Process, 2021 – 2032

   8.5.5.2.2 Oil Country Tubular Goods Market Size & Forecast, By Product, 2021 – 2032

   8.5.5.2.3 Oil Country Tubular Goods Market Size & Forecast, By Application, 2021 – 2032

  8.5.5.3 Mexico

   8.5.5.3.1 Oil Country Tubular Goods Market Size & Forecast, By Process, 2021 – 2032

   8.5.5.3.2 Oil Country Tubular Goods Market Size & Forecast, By Product, 2021 – 2032

   8.5.5.3.3 Oil Country Tubular Goods Market Size & Forecast, By Application, 2021 – 2032

  8.5.5.4 Colombia

   8.5.5.4.1 Oil Country Tubular Goods Market Size & Forecast, By Process, 2021 – 2032

   8.5.5.4.2 Oil Country Tubular Goods Market Size & Forecast, By Product, 2021 – 2032

   8.5.5.4.3 Oil Country Tubular Goods Market Size & Forecast, By Application, 2021 – 2032

  8.5.5.5 Rest of Latin America

   8.5.5.5.1 Oil Country Tubular Goods Market Size & Forecast, By Process, 2021 – 2032

   8.5.5.5.2 Oil Country Tubular Goods Market Size & Forecast, By Product, 2021 – 2032

   8.5.5.5.3 Oil Country Tubular Goods Market Size & Forecast, By Application, 2021 – 2032

8.6 Middle East & Africa

 8.6.1 Key Trends

 8.6.2 Oil Country Tubular Goods Market Size & Forecast, By Process, 2021 – 2032

 8.6.3 Oil Country Tubular Goods Market Size & Forecast, By Product, 2021 – 2032

 8.6.4 Oil Country Tubular Goods Market Size & Forecast, By Application, 2021 – 2032

 8.6.5 Oil Country Tubular Goods Market Size & Forecast, By Country, 2021 – 2032

  8.6.5.1 UAE

   8.6.5.1.1 Oil Country Tubular Goods Market Size & Forecast, By Process, 2021 – 2032

   8.6.5.1.2 Oil Country Tubular Goods Market Size & Forecast, By Product, 2021 – 2032

   8.6.5.1.3 Oil Country Tubular Goods Market Size & Forecast, By Application, 2021 – 2032

  8.6.5.2 Saudi Arabia

   8.6.5.2.1 Oil Country Tubular Goods Market Size & Forecast, By Process, 2021 – 2032

   8.6.5.2.2 Oil Country Tubular Goods Market Size & Forecast, By Product, 2021 – 2032

   8.6.5.2.3 Oil Country Tubular Goods Market Size & Forecast, By Application, 2021 – 2032

  8.6.5.3 Qatar

   8.6.5.3.1 Oil Country Tubular Goods Market Size & Forecast, By Process, 2021 – 2032

   8.6.5.3.2 Oil Country Tubular Goods Market Size & Forecast, By Product, 2021 – 2032

   8.6.5.3.3 Oil Country Tubular Goods Market Size & Forecast, By Application, 2021 – 2032

  8.6.5.4 Egypt

   8.6.5.4.1 Oil Country Tubular Goods Market Size & Forecast, By Process, 2021 – 2032

   8.6.5.4.2 Oil Country Tubular Goods Market Size & Forecast, By Product, 2021 – 2032

   8.6.5.4.3 Oil Country Tubular Goods Market Size & Forecast, By Application, 2021 – 2032

  8.6.5.5 South Africa

   8.6.5.5.1 Oil Country Tubular Goods Market Size & Forecast, By Process, 2021 – 2032

   8.6.5.5.2 Oil Country Tubular Goods Market Size & Forecast, By Product, 2021 – 2032

   8.6.5.5.3 Oil Country Tubular Goods Market Size & Forecast, By Application, 2021 – 2032

  8.6.5.6 Rest of Middle East & Africa

   8.6.5.6.1 Oil Country Tubular Goods Market Size & Forecast, By Process, 2021 – 2032

   8.6.5.6.2 Oil Country Tubular Goods Market Size & Forecast, By Product, 2021 – 2032

   8.6.5.6.3 Oil Country Tubular Goods Market Size & Forecast, By Application, 2021 – 2032

9. Competitive Landscape

 9.1 Key Players' Positioning

 9.2 Competitive Developments

  9.2.1 Key Strategies Adopted (%), By Key Players, 2024

  9.2.2 Year-Wise Strategies & Development, 2021 – 2025

  9.2.3 Number Of Strategies Adopted By Key Players, 2024

 9.3 Market Share Analysis, 2024

 9.4 Product/Service & Application Benchmarking

  9.4.1 Product/Service Specifications & Features By Key Players

  9.4.2 Product/Service Heatmap By Key Players

  9.4.3 Application Heatmap By Key Players

 9.5 Industry Start-Up & Innovation Landscape

9.6 Key Company Profiles

 9.6.1 ArcelorMittal SA

  9.6.1.1 Company Overview & Snapshot

  9.6.1.2 Product/Service Portfolio

  9.6.1.3 Key Company Financials

  9.6.1.4 SWOT Analysis

 9.6.2 Evraz North America plc

  9.6.2.1 Company Overview & Snapshot

  9.6.2.2 Product/Service Portfolio

  9.6.2.3 Key Company Financials

  9.6.2.4 SWOT Analysis

 9.6.3 Iljin Steel Corporation

  9.6.3.1 Company Overview & Snapshot

  9.6.3.2 Product/Service Portfolio

  9.6.3.3 Key Company Financials

  9.6.3.4 SWOT Analysis

 9.6.4 JFE Steel Corporation

  9.6.4.1 Company Overview & Snapshot

  9.6.4.2 Product/Service Portfolio

  9.6.4.3 Key Company Financials

  9.6.4.4 SWOT Analysis

 9.6.5 NOV Inc.

  9.6.5.1 Company Overview & Snapshot

  9.6.5.2 Product/Service Portfolio

  9.6.5.3 Key Company Financials

  9.6.5.4 SWOT Analysis

 9.6.6 Oil Country Tubular Limited

  9.6.6.1 Company Overview & Snapshot

  9.6.6.2 Product/Service Portfolio

  9.6.6.3 Key Company Financials

  9.6.6.4 SWOT Analysis

 9.6.7 Sumitomo Corporation

  9.6.7.1 Company Overview & Snapshot

  9.6.7.2 Product/Service Portfolio

  9.6.7.3 Key Company Financials

  9.6.7.4 SWOT Analysis

 9.6.8 Tenaris

  9.6.8.1 Company Overview & Snapshot

  9.6.8.2 Product/Service Portfolio

  9.6.8.3 Key Company Financials

  9.6.8.4 SWOT Analysis

 9.6.9 TMK Inc.

  9.6.9.1 Company Overview & Snapshot

  9.6.9.2 Product/Service Portfolio

  9.6.9.3 Key Company Financials

  9.6.9.4 SWOT Analysis

 9.6.10 U.S. Steel Corporation

  9.6.10.1 Company Overview & Snapshot

  9.6.10.2 Product/Service Portfolio

  9.6.10.3 Key Company Financials

  9.6.10.4 SWOT Analysis

 9.6.11 ArcelorMittal Tubular Products

  9.6.11.1 Company Overview & Snapshot

  9.6.11.2 Product/Service Portfolio

  9.6.11.3 Key Company Financials

  9.6.11.4 SWOT Analysis

 9.6.12 Vallourec

  9.6.12.1 Company Overview & Snapshot

  9.6.12.2 Product/Service Portfolio

  9.6.12.3 Key Company Financials

  9.6.12.4 SWOT Analysis

 9.6.13 Vallourec Star

  9.6.13.1 Company Overview & Snapshot

  9.6.13.2 Product/Service Portfolio

  9.6.13.3 Key Company Financials

  9.6.13.4 SWOT Analysis

 9.6.14 Wheatland Tube

  9.6.14.1 Company Overview & Snapshot

  9.6.14.2 Product/Service Portfolio

  9.6.14.3 Key Company Financials

  9.6.14.4 SWOT Analysis

 9.6.15 Baosteel Group

  9.6.15.1 Company Overview & Snapshot

  9.6.15.2 Product/Service Portfolio

  9.6.15.3 Key Company Financials

  9.6.15.4 SWOT Analysis

 9.6.16 Hyundai Steel Company

  9.6.16.1 Company Overview & Snapshot

  9.6.16.2 Product/Service Portfolio

  9.6.16.3 Key Company Financials

  9.6.16.4 SWOT Analysis

 9.6.17 TMK IPSCO

  9.6.17.1 Company Overview & Snapshot

  9.6.17.2 Product/Service Portfolio

  9.6.17.3 Key Company Financials

  9.6.17.4 SWOT Analysis

 9.6.18 Pioneer Pipe

  9.6.18.1 Company Overview & Snapshot

  9.6.18.2 Product/Service Portfolio

  9.6.18.3 Key Company Financials

  9.6.18.4 SWOT Analysis

 9.6.19 Maverick Tube Corporation

  9.6.19.1 Company Overview & Snapshot

  9.6.19.2 Product/Service Portfolio

  9.6.19.3 Key Company Financials

  9.6.19.4 SWOT Analysis

 9.6.20 Masteel

  9.6.20.1 Company Overview & Snapshot

  9.6.20.2 Product/Service Portfolio

  9.6.20.3 Key Company Financials

  9.6.20.4 SWOT Analysis

10. Analyst Recommendations

 10.1 SNS Insider Opportunity Map

 10.2 Industry Low-Hanging Fruit Assessment

 10.3 Market Entry & Growth Strategy

 10.4 Analyst Viewpoint & Suggestions On Market Growth

11. Assumptions

12. Disclaimer

13. Appendix

 13.1 List Of Tables

 13.2 List Of Figures

Key Segmentation

By Process

  • Seamless

  • Welded

By Product

  • Well Casing

  • Production Tubing

  • Drill Pipe

  • Others

By Application

  • Onshore

  • Offshore

Request for Segment Customization as per your Business Requirement: Segment Customization Request

Regional Coverage

North America

  • US

  • Canada

Europe

  • Germany

  • UK

  • France

  • Italy

  • Spain

  • Russia

  • Poland

  • Rest of Europe

Asia Pacific

  • China

  • India

  • Japan

  • South Korea

  • ASEAN Countries

  • Australia

  • Rest of Asia Pacific

Latin America

  • Brazil

  • Argentina

  • Mexico

  • Colombia

  • Rest of Latin America

Middle East & Africa

  • UAE

  • Saudi Arabia

  • Qatar

  • Egypt

  • South Africa

  • Rest of Middle East & Africa

Request for Country Level Research Report: Country Level Customization Request

Available Customization

With the given market data, SNS Insider offers customization as per the company’s specific needs. The following customization options are available for the report:

  • Detailed Volume Analysis

  • Criss-Cross segment analysis (e.g. Product X Application)

  • Competitive Product Benchmarking

  • Geographic Analysis

  • Additional countries in any of the regions

  • Customized Data Representation

  • Detailed analysis and profiling of additional market players

An accurate research report requires proper strategizing as well as implementation. There are multiple factors involved in the completion of good and accurate research report and selecting the best methodology to compete the research is the toughest part. Since the research reports we provide play a crucial role in any company’s decision-making process, therefore we at SNS Insider always believe that we should choose the best method which gives us results closer to reality. This allows us to reach at a stage wherein we can provide our clients best and accurate investment to output ratio.

Each report that we prepare takes a timeframe of 350-400 business hours for production. Starting from the selection of titles through a couple of in-depth brain storming session to the final QC process before uploading our titles on our website we dedicate around 350 working hours. The titles are selected based on their current market cap and the foreseen CAGR and growth.


The 5 steps process:

Step 1: Secondary Research:

Secondary Research or Desk Research is as the name suggests is a research process wherein, we collect data through the readily available information. In this process we use various paid and unpaid databases which our team has access to and gather data through the same. This includes examining of listed companies’ annual reports, Journals, SEC filling etc. Apart from this our team has access to various associations across the globe across different industries. Lastly, we have exchange relationships with various university as well as individual libraries.

Secondary Research

Step 2: Primary Research

When we talk about primary research, it is a type of study in which the researchers collect relevant data samples directly, rather than relying on previously collected data.  This type of research is focused on gaining content specific facts that can be sued to solve specific problems. Since the collected data is fresh and first hand therefore it makes the study more accurate and genuine.

We at SNS Insider have divided Primary Research into 2 parts.

Part 1 wherein we interview the KOLs of major players as well as the upcoming ones across various geographic regions. This allows us to have their view over the market scenario and acts as an important tool to come closer to the accurate market numbers. As many as 45 paid and unpaid primary interviews are taken from both the demand and supply side of the industry to make sure we land at an accurate judgement and analysis of the market.

This step involves the triangulation of data wherein our team analyses the interview transcripts, online survey responses and observation of on filed participants. The below mentioned chart should give a better understanding of the part 1 of the primary interview.

Primary Research

Part 2: In this part of primary research the data collected via secondary research and the part 1 of the primary research is validated with the interviews from individual consultants and subject matter experts.

Consultants are those set of people who have at least 12 years of experience and expertise within the industry whereas Subject Matter Experts are those with at least 15 years of experience behind their back within the same space. The data with the help of two main processes i.e., FGDs (Focused Group Discussions) and IDs (Individual Discussions). This gives us a 3rd party nonbiased primary view of the market scenario making it a more dependable one while collation of the data pointers.

Step 3: Data Bank Validation

Once all the information is collected via primary and secondary sources, we run that information for data validation. At our intelligence centre our research heads track a lot of information related to the market which includes the quarterly reports, the daily stock prices, and other relevant information. Our data bank server gets updated every fortnight and that is how the information which we collected using our primary and secondary information is revalidated in real time.

Data Bank Validation

Step 4: QA/QC Process

After all the data collection and validation our team does a final level of quality check and quality assurance to get rid of any unwanted or undesired mistakes. This might include but not limited to getting rid of the any typos, duplication of numbers or missing of any important information. The people involved in this process include technical content writers, research heads and graphics people. Once this process is completed the title gets uploader on our platform for our clients to read it.

Step 5: Final QC/QA Process:

This is the last process and comes when the client has ordered the study. In this process a final QA/QC is done before the study is emailed to the client. Since we believe in giving our clients a good experience of our research studies, therefore, to make sure that we do not lack at our end in any way humanly possible we do a final round of quality check and then dispatch the study to the client.