image

Online Poker Market Size, Share & Segmentation By Game Type (Texas Hold’em, Omaha, 7-Card Stud, Others), Device (Desktop (PC), Smartphone), Game Format (Cash Games, Tournaments, Fast-Fold Poker), Payment Mode (Credit/Debit Cards, E-Wallets, Cryptocurrencies, Bank Transfers), Region | Global Forecast 2025-2032

Date: August 2025 Report Code: SNS/ICT/8074 Page 320

Online Poker Market Report Scope & Overview:

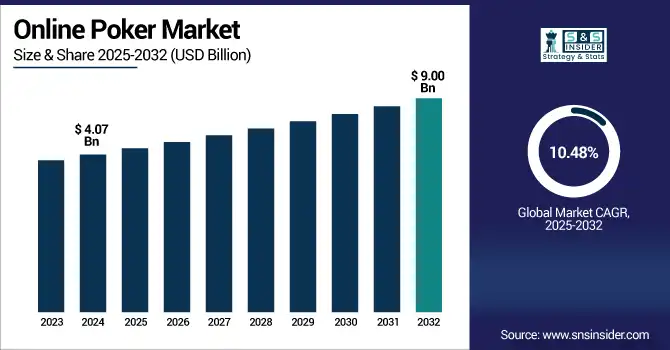
Online Poker Market was valued at USD 4.07 billion in 2024 and is expected to reach USD 9.00 billion by 2032, growing at a CAGR of 10.48% from 2025-2032. 

The growth of the online poker market is driven by increasing internet penetration 67.1% globally as of 2024, according to the International Telecommunication Union (ITU) and widespread smartphone usage. The rising popularity of real-money gaming platforms has further accelerated adoption. Technological advancements such as secure payment gateways, AI-based fraud detection, and immersive user interfaces have enhanced player experience and trust. Additionally, the legalization and regulation of online poker in regions such as Michigan, Pennsylvania, and New Jersey, as recognized by the Michigan Gaming Control Board, have expanded the player base significantly. Social gaming trends and the rise of live poker tournaments on digital platforms evident from millions of hours watched on Twitch's Poker streams and collaborations like GGPoker’s partnership with the World Series of Poker (WSOP) have further fueled engagement. Strategic marketing, celebrity endorsements, and integration with streaming platforms continue to boost visibility and user acquisition, contributing to sustained market expansion.

U.S. Online Poker Market was valued at USD 0.85 billion in 2024 and is expected to reach USD 1.85 billion by 2032, growing at a CAGR of 10.25% from 2025-2032. 

The U.S. online poker market is growing due to increasing state-level legalization, improved regulatory frameworks, and a surge in digital payment adoption. Rising mobile gaming participation, enhanced cybersecurity, and the popularity of televised and live-streamed tournaments are also attracting a broader audience, driving consistent market expansion across the country.

Market Dynamics

Drivers

  • Increased popularity of skill-based gaming is attracting competitive players and legitimizing poker as a strategic and rewarding activity.

The growing public perception of poker as a game of skill rather than chance is redefining its appeal. Competitive players are increasingly drawn to poker because it rewards strategy, probability analysis, and decision-making under pressure. This perception shift is further supported by online tournaments, leaderboards, and live-streamed gameplay that highlight player expertise. Skill-based engagement also fosters community-building and player retention, as users are motivated to improve performance over time. As consumers seek intellectually stimulating and financially rewarding games, online poker benefits from this transition toward skill-centric gaming behaviors and platforms.

  • In the 2024 WSOP Main Event, held live in Las Vegas, the poker championship attracted a record 10,112 entries, setting a new all-time high for participation.

  • According to SullyGnome’s analytics, poker content on Twitch has amassed over 14.1 million viewing hours this year, with an average of ~2,735 concurrent poker viewers and peak live viewers reaching ~22,043.

Restraints

  • Stringent gambling regulations across jurisdictions create operational barriers and legal uncertainties for online poker platforms.

Inconsistent and evolving gambling laws across countries—and even within states—pose significant limitations for market expansion. Regulatory frameworks often classify poker under general gambling laws, resulting in licensing hurdles, advertising restrictions, and even platform bans. Operators face uncertainty while entering new regions, leading to increased legal compliance costs and cautious market approaches. In some jurisdictions, online poker is still deemed illegal or morally contentious, which affects user trust and market growth. As regulatory clarity lags behind technology, online poker platforms struggle to standardize operations and scale globally without encountering legal obstacles.

Opportunities

  • Expansion into emerging markets with rising digital infrastructure creates strong growth potential for online poker providers.

Countries in Asia, Latin America, and Africa are witnessing rapid digitization, growing middle-class populations, and increasing mobile penetration—making them prime targets for online poker. These regions offer untapped user bases eager for entertainment and digital financial tools. As cultural acceptance of online gaming grows and governments explore regulated markets, poker providers can localize content, integrate regional payment systems, and build strong communities. Language support, local tournaments, and influencer marketing can help gain traction in these new markets, opening significant revenue opportunities for global and regional poker platforms.

Challenges

  • High player churn and low retention rates reduce lifetime value and profitability for online poker platforms.

Despite large user acquisition numbers, retaining casual and first-time poker players remains a major challenge. Many users quit after initial losses or become inactive due to lack of personalized engagement or motivation. This leads to high marketing spend to reacquire users, impacting ROI. Poor onboarding, generic content, and insufficient reward systems contribute to weak loyalty. Additionally, competition from other online games and entertainment options diverts attention. Platforms must continually innovate user experiences, loyalty programs, and training content to improve retention rates and enhance long-term player lifetime value.

Segment Analysis

By Device

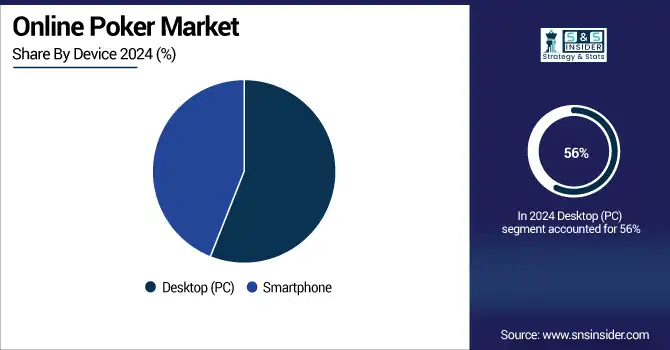
Desktop (PC) usage dominated the online poker market in 2024 with the highest revenue share of 56% due to its superior processing power, larger screens, and stable connectivity. These features offer a more immersive and controlled gaming experience, especially for professional and high-stakes players. Desktops also support multi-table play and advanced tracking software, which are crucial for strategic decisions, contributing to their continued preference among serious online poker users.

Smartphone adoption is projected to grow fastest at a CAGR of 11.51% from 2025–2032 due to increasing mobile internet penetration, affordable smartphones, and user-friendly poker apps. The convenience of playing anytime, anywhere appeals to casual and younger users. Enhanced mobile UI/UX design, real-time updates, and in-app social features further attract a broader audience, positioning smartphones as the most rapidly expanding segment in the online poker ecosystem.

By Payment Mode

Credit/Debit Cards dominated the online poker market in 2024 with the highest revenue share of 36% due to their wide acceptance, user familiarity, and instant processing capabilities. Players prefer card payments because of the trust associated with major banks and card providers. Additionally, minimal setup and seamless integration into platforms help maintain transactional efficiency, especially for users less inclined toward digital wallets or cryptocurrency-based alternatives, securing their dominance in payment preferences.

E-Wallets are expected to grow at the fastest CAGR of 12.11% from 2025–2032 owing to their convenience, speed, and strong appeal among tech-savvy users. These digital payment tools allow instant deposits and withdrawals, often with enhanced security features like encryption and two-factor authentication. The growing popularity of mobile gaming pairs well with mobile-friendly wallet apps, fueling their usage in emerging markets and driving rapid adoption across the online poker ecosystem.

By Game Type

Texas Hold’em led the online poker market in 2024 with a dominant revenue share of 55% due to its global popularity, simple rules, and widespread presence in tournaments and online platforms. Its accessibility attracts beginners, while strategic depth appeals to professionals. Major televised events and influencer-led promotions have further boosted its visibility. The consistent presence of Texas Hold’em in free-play and real-money formats continues to sustain its leadership across player segments.

Omaha is projected to grow at the fastest CAGR of 12.87% from 2025–2032 as more players seek variety and increased complexity in gameplay. Omaha offers higher variance and deeper strategic opportunities, attracting experienced players transitioning from Texas Hold’em. Online platforms are promoting Omaha with dedicated tables, tutorials, and tournaments, enhancing its appeal. The evolving poker community’s appetite for challenging variants is a key driver of Omaha’s accelerated growth trajectory.

By Game Format

Cash Games dominated the online poker market in 2024 with the highest revenue share of 48% as they offer flexibility in entry, no fixed durations, and immediate withdrawal of winnings. Players can join or leave tables at will, making them appealing for both casual users and professionals. These games run 24/7, maintaining high traffic and liquidity. Their steady revenue stream and broad appeal ensure consistent performance over tournament-based alternatives.

Fast-Fold Poker is anticipated to grow at the fastest CAGR of 12.96% from 2025–2032 as users increasingly demand quicker gameplay and reduced downtime. This format allows players to switch tables instantly after folding, significantly increasing hand volume per session. It appeals to mobile and short-session users seeking speed and action. Platforms are leveraging this trend by integrating fast-fold options prominently, drawing both recreational and volume-focused players to the format.

Regional Analysis

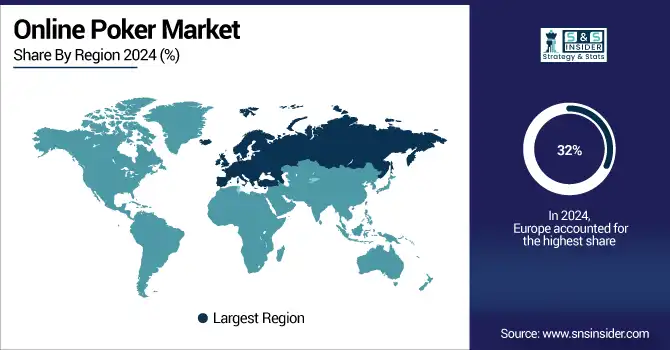
Europe dominated the online poker market in 2024 with the highest revenue share of 32% due to a well-established gambling culture, robust regulatory frameworks, and widespread internet access. Countries like the UK, France, and Germany have mature markets with legal clarity and strong user bases. High disposable income, secure payment infrastructure, and longstanding popularity of poker games contribute to Europe’s continued dominance in terms of both player activity and platform revenues.

The United Kingdom is dominating the online poker market in Europe, driven by a regulated environment, high internet penetration, and a strong gaming culture.

Asia Pacific is projected to grow at the fastest CAGR of 12.65% from 2025–2032 due to expanding internet penetration, rising smartphone adoption, and a growing young population interested in skill-based games. Markets like India, China, and Southeast Asia are witnessing increased acceptance of digital gaming. As governments gradually ease regulations and platforms localize offerings, the region offers immense untapped potential, driving rapid growth in the online poker ecosystem.

India is dominating the Asia Pacific online poker market due to rapid smartphone adoption, youthful demographics, and growing interest in real-money skill-based gaming.

North America holds a significant position in the online poker market, driven by the United States’ legalized state markets and Canada’s growing digital gaming adoption. High consumer spending, robust infrastructure, and professional tournaments continue to fuel regional growth and engagement.

The United States is dominating the online poker market due to high player volume, legalized state-level platforms, and strong consumer spending on digital entertainment.

In the online poker market, Latin America and the Middle East & Africa are emerging regions, driven by increasing mobile penetration, youthful populations, and rising interest in online gaming, though limited regulatory frameworks and payment access remain key growth barriers.

Key Players

Online Poker Market Companies Are Americas Cardroom, Baazi Games, BetOnline, BLITZ POKER, Ignition, MPL, Playtika, Pocket52, PokerStars, Tencent, True Poker, Zynga Inc., 888 Holdings, Entain, Caesars Entertainment, GG Poker, Winning Poker Network, PokerBaazi, Adda52, Kindred Group, Natural8, Bodog Poker.

Recent Developments:

  • 2024: ACR Poker announced Tom Dwan (Durrrr) as a new Team Pro in March 2024, marking a high‑profile sponsorship move and enhanced brand visibility via poker legend’s global reputation.

  • 2024: PokerStars announced the launch of the PokerStars Open tour set to debut in March 2025, replacing UKIPT, Eureka, Estrellas and FPS tours, featuring USD 1,100 Main Events with USD 1 M guarantees.

Online Poker Market Report Scope:

Report Attributes Details
Market Size in 2024 USD 4.07 Billion 
Market Size by 2032 USD 9.00 Billion 
CAGR CAGR of 10.48% From 2025 to 2032
Base Year 2024
Forecast Period 2025-2032
Historical Data 2021-2023
Report Scope & Coverage Market Size, Segments Analysis, Competitive Landscape, Regional Analysis, DROC & SWOT Analysis, Forecast Outlook
Key Segments • By Game Type (Texas Hold’em, Omaha, 7-Card Stud, Others)
• By Device (Desktop (PC), Smartphone)
• By Game Format (Cash Games, Tournaments, Fast-Fold Poker)
• By Payment Mode (Credit/Debit Cards, E-Wallets, Cryptocurrencies, Bank Transfers)
Regional Analysis/Coverage North America (US, Canada), Europe (Germany, UK, France, Italy, Spain, Russia, Poland, Rest of Europe), Asia Pacific (China, India, Japan, South Korea, Australia, ASEAN Countries, Rest of Asia Pacific), Middle East & Africa (UAE, Saudi Arabia, Qatar, South Africa, Rest of Middle East & Africa), Latin America (Brazil, Argentina, Mexico, Colombia, Rest of Latin America).
Company Profiles Americas Cardroom, Baazi Games, BetOnline, BLITZ POKER, Ignition, MPL, Playtika, Pocket52, PokerStars, Tencent, True Poker, Zynga Inc., 888 Holdings, Entain, Caesars Entertainment, GG Poker, Winning Poker Network, PokerBaazi, Adda52, Kindred Group, Natural8, Bodog Poker

Frequently Asked Questions

Ans: The Online Poker Market is expected to grow at a CAGR of 10.48% from 2025 to 2032, reaching USD 9.00 billion by 2032.

Ans: The Online Poker Market was valued at USD 4.07 billion in 2024, driven by rising smartphone usage and real-money gaming adoption.

Ans: The major growth driver is the increased popularity of skill-based gaming supported by digital platforms, tournaments, and real-money gaming environments.

Ans: Texas Hold’em dominated the market by game type in 2024, holding a 55% revenue share due to global popularity and tournament presence.

Ans: Europe led the Online Poker Market with a 32% revenue share in 2024, supported by legal clarity and a mature player base.

Table Of Contents

1. Introduction

1.1 Market Definition & Scope

 1.2 Research Assumptions & Abbreviations

 1.3 Research Methodology

2. Executive Summary

2.1 Market Snapshot

 2.2 Market Absolute $ Opportunity Assessment & Y-o-Y Analysis, 2021–2032

 2.3 Market Size & Forecast, By Segmentation, 2021–2032

  2.3.1 Market Size By Game Type

  2.3.2 Market Size By Device

  2.3.3 Market Size By Game Format

  2.3.4 Market Size Payment Mode

 2.4 Market Share & Bps Analysis By Region, 2024

 2.5 Industry Growth Scenarios – Conservative, Likely & Optimistic

 2.6 Industry CxO’s Perspective

3. Market Overview

3.1 Market Dynamics

  3.1.1 Drivers

  3.1.2 Restraints

  3.1.3 Opportunities

  3.1.4 Key Market Trends

 3.2 Industry PESTLE Analysis

 3.3 Key Industry Forces (Porter’s) Impacting Market Growth

 3.4 Industry Supply Chain Analysis

  3.4.1 Raw Material Suppliers

  3.4.2 Manufacturers

  3.4.3 Distributors/Suppliers

  3.4.4 Customers/End-Users

 3.5 Industry Life Cycle Assessment

 3.6 Parent Market Overview

 3.7 Market Risk Assessment

4. Statistical Insights & Trends Reporting

4.1 User Base & Demographics

4.1.1 Total Number of Online Poker Players (Global & by Region)
4.1.2 Active Monthly Users (MAU) / Daily Active Users (DAU)
4.1.3 Player Demographics (Age, Gender, Income Brackets)
4.1.4 Player Retention Rate (%)
4.1.5 Average Time Spent Per Session (Minutes)

4.2 Platform & Gameplay Metrics

4.2.1 Most Popular Poker Variants by User Share (e.g., Texas Hold’em, Omaha, 7-Card Stud)
4.2.2 Average Table Size and Game Duration
4.2.3 Percentage of Players Using Mobile vs. Desktop
4.2.4 Average Buy-in Amounts per Game Type (USD)
4.2.5 Peak Traffic Hours and Player Volume

4.3 Revenue & Monetization

4.3.1 Average Revenue Per User (ARPU)
4.3.2 Share of Revenue from Rake vs. Tournament Fees vs. Subscriptions
4.3.3 Conversion Rate of Freemium to Paying Users (%)
4.3.4 Growth in In-Game Purchases or Virtual Chips Revenue (YoY %)
4.3.5 Player Winnings Distribution – % of Players Earning Profits

4.4 Marketing & Acquisition Metrics

4.4.1 Average Customer Acquisition Cost (CAC)
4.4.2 Lifetime Value (LTV) of Online Poker Players
4.4.3 Churn Rate of New Users (%)
4.4.4 Top Marketing Channels by ROI (Affiliate, Ads, Sponsorships)
4.4.5 Average Signup-to-Deposit Conversion Rate (%)

4.5 Technology & Security

4.5.1 Percentage of Platforms Offering Multi-Table Play or Real-Time Tournaments
4.5.2 Share of Platforms Using Blockchain or Provably Fair Systems
4.5.3 Incidence Rate of Fraud, Bots, or Collusion (%)
4.5.4 Share of Platforms Offering Responsible Gaming Features
4.5.5 Downtime or Server Crash Rate During Peak Usage (%)

4.6 Legal & Regulatory Insights

4.6.1 Number of Regulated Jurisdictions Allowing Real-Money Online Poker
4.6.2 Share of Licensed vs. Unlicensed Platforms Globally
4.6.3 Regulatory Compliance Rate of Top 20 Platforms (%)
4.6.4 Penalties or Fines Issued for Regulatory Breaches (Past 3 Years)
4.6.5 Share of Revenue Lost Due to Geo-Blocking or Legal Restrictions

5. Online Poker Market Segmental Analysis & Forecast, By Game Type, 2021 – 2032, Value (Usd Billion)

5.1 Introduction

 5.2 Texas Hold’em

  5.2.1 Key Trends

  5.2.2 Market Size & Forecast, 2021 – 2032

 5.3 Omaha

  5.3.1 Key Trends

  5.3.2 Market Size & Forecast, 2021 – 2032

 5.4 7-Card Stud

  5.4.1 Key Trends

  5.4.2 Market Size & Forecast, 2021 – 2032

 5.5 Others

  5.5.1 Key Trends

  5.5.2 Market Size & Forecast, 2021 – 2032

6. Online Poker Market Segmental Analysis & Forecast, By Device, 2021 – 2032, Value (Usd Billion)

    6.1 Introduction

 6.2 Desktop (PC)

  6.2.1 Key Trends

  6.2.2 Market Size & Forecast, 2021 – 2032

 6.3 Smartphone

  6.3.1 Key Trends

  6.3.2 Market Size & Forecast, 2021 – 2032

7. Online Poker Market Segmental Analysis & Forecast, By Game Format, 2021 – 2032, Value (Usd Billion)

    7.1 Introduction

 7.2 Cash Games

  7.2.1 Key Trends

  7.2.2 Market Size & Forecast, 2021 – 2032

 7.3 Tournaments

  7.3.1 Key Trends

  7.3.2 Market Size & Forecast, 2021 – 2032

 7.4 Fast-Fold Poker

  7.4.1 Key Trends

  7.4.2 Market Size & Forecast, 2021 – 2032

8. Online Poker Market Segmental Analysis & Forecast, Payment Mode, 2021 – 2032, Value (Usd Billion)

    8.1 Introduction

 8.2 Credit/Debit Cards

  8.2.1 Key Trends

  8.2.2 Market Size & Forecast, 2021 – 2032

 8.3 E-Wallets

  8.3.1 Key Trends

  8.3.2 Market Size & Forecast, 2021 – 2032

 8.4 Cryptocurrencies

  8.4.1 Key Trends

  8.4.2 Market Size & Forecast, 2021 – 2032

 8.5 Bank Transfers

  8.5.1 Key Trends

  8.5.2 Market Size & Forecast, 2021 – 2032

9. Online Poker Market Segmental Analysis & Forecast By Region, 2021 – 2025, Value (Usd Billion)

9.1 Introduction

9.2 North America

 9.2.1 Key Trends

 9.2.2 Online Poker Market Size & Forecast, By Game Type, 2021 – 2032

 9.2.3 Online Poker Market Size & Forecast, By Device, 2021 – 2032

 9.2.4 Online Poker Market Size & Forecast, By Game Format, 2021 – 2032

 9.2.5 Online Poker Market Size & Forecast, Payment Mode, 2021 – 2032

 9.2.6 Online Poker Market Size & Forecast, By Country, 2021 – 2032

  9.2.6.1 USA

   9.2.6.1.1 Online Poker Market Size & Forecast, By Game Type, 2021 – 2032

   9.2.6.1.2 Online Poker Market Size & Forecast, By Device, 2021 – 2032

   9.2.6.1.3 Online Poker Market Size & Forecast, By Game Format, 2021 – 2032

   9.2.6.1.4 Online Poker Market Size & Forecast, Payment Mode, 2021 – 2032

  9.2.6.2 Canada

   9.2.6.2.1 Online Poker Market Size & Forecast, By Game Type, 2021 – 2032

   9.2.6.2.2 Online Poker Market Size & Forecast, By Device, 2021 – 2032

   9.2.6.2.3 Online Poker Market Size & Forecast, By Game Format, 2021 – 2032

   9.2.6.2.4 Online Poker Market Size & Forecast, Payment Mode, 2021 – 2032

9.3 Europe

 9.3.1 Key Trends

 9.3.2 Online Poker Market Size & Forecast, By Game Type, 2021 – 2032

 9.3.3 Online Poker Market Size & Forecast, By Device, 2021 – 2032

 9.3.4 Online Poker Market Size & Forecast, By Game Format, 2021 – 2032

 9.3.5 Online Poker Market Size & Forecast, Payment Mode, 2021 – 2032

 9.3.6 Online Poker Market Size & Forecast, By Country, 2021 – 2032

  9.3.6.1 Germany

   9.3.6.1.1 Online Poker Market Size & Forecast, By Game Type, 2021 – 2032

   9.3.6.1.2 Online Poker Market Size & Forecast, By Device, 2021 – 2032

   9.3.6.1.3 Online Poker Market Size & Forecast, By Game Format, 2021 – 2032

   9.3.6.1.4 Online Poker Market Size & Forecast, Payment Mode, 2021 – 2032

  9.3.6.2 UK

   9.3.6.2.1 Online Poker Market Size & Forecast, By Game Type, 2021 – 2032

   9.3.6.2.2 Online Poker Market Size & Forecast, By Device, 2021 – 2032

   9.3.6.2.3 Online Poker Market Size & Forecast, By Game Format, 2021 – 2032

   9.3.6.2.4 Online Poker Market Size & Forecast, Payment Mode, 2021 – 2032

  9.3.6.3 France

   9.3.6.3.1 Online Poker Market Size & Forecast, By Game Type, 2021 – 2032

   9.3.6.3.2 Online Poker Market Size & Forecast, By Device, 2021 – 2032

   9.3.6.3.3 Online Poker Market Size & Forecast, By Game Format, 2021 – 2032

   9.3.6.3.4 Online Poker Market Size & Forecast, Payment Mode, 2021 – 2032

  9.3.6.4 Italy

   9.3.6.4.1 Online Poker Market Size & Forecast, By Game Type, 2021 – 2032

   9.3.6.4.2 Online Poker Market Size & Forecast, By Device, 2021 – 2032

   9.3.6.4.3 Online Poker Market Size & Forecast, By Game Format, 2021 – 2032

   9.3.6.4.4 Online Poker Market Size & Forecast, Payment Mode, 2021 – 2032

  9.3.6.5 Spain

   9.3.6.5.1 Online Poker Market Size & Forecast, By Game Type, 2021 – 2032

   9.3.6.5.2 Online Poker Market Size & Forecast, By Device, 2021 – 2032

   9.3.6.5.3 Online Poker Market Size & Forecast, By Game Format, 2021 – 2032

   9.3.6.5.4 Online Poker Market Size & Forecast, Payment Mode, 2021 – 2032

  9.3.6.6 Russia

   9.3.6.6.1 Online Poker Market Size & Forecast, By Game Type, 2021 – 2032

   9.3.6.6.2 Online Poker Market Size & Forecast, By Device, 2021 – 2032

   9.3.6.6.3 Online Poker Market Size & Forecast, By Game Format, 2021 – 2032

   9.3.6.6.4 Online Poker Market Size & Forecast, Payment Mode, 2021 – 2032

  9.3.6.7 Poland

   9.3.6.7.1 Online Poker Market Size & Forecast, By Game Type, 2021 – 2032

   9.3.6.7.2 Online Poker Market Size & Forecast, By Device, 2021 – 2032

   9.3.6.7.3 Online Poker Market Size & Forecast, By Game Format, 2021 – 2032

   9.3.6.7.4 Online Poker Market Size & Forecast, Payment Mode, 2021 – 2032

  9.3.6.8 Rest of Europe

   9.3.6.8.1 Online Poker Market Size & Forecast, By Game Type, 2021 – 2032

   9.3.6.8.2 Online Poker Market Size & Forecast, By Device, 2021 – 2032

   9.3.6.8.3 Online Poker Market Size & Forecast, By Game Format, 2021 – 2032

   9.3.6.8.4 Online Poker Market Size & Forecast, Payment Mode, 2021 – 2032   

9.4 Asia-Pacific

 9.4.1 Key Trends

 9.4.2 Online Poker Market Size & Forecast, By Game Type, 2021 – 2032

 9.4.3 Online Poker Market Size & Forecast, By Device, 2021 – 2032

 9.4.4 Online Poker Market Size & Forecast, By Game Format, 2021 – 2032

 9.4.5 Online Poker Market Size & Forecast, Payment Mode, 2021 – 2032

 9.4.6 Online Poker Market Size & Forecast, By Country, 2021 – 2032

  9.4.6.1 China

   9.4.6.1.1 Online Poker Market Size & Forecast, By Game Type, 2021 – 2032

   9.4.6.1.2 Online Poker Market Size & Forecast, By Device, 2021 – 2032

   9.4.6.1.3 Online Poker Market Size & Forecast, By Game Format, 2021 – 2032

   9.4.6.1.4 Online Poker Market Size & Forecast, Payment Mode, 2021 – 2032

  9.4.6.2 India

   9.4.6.2.1 Online Poker Market Size & Forecast, By Game Type, 2021 – 2032

   9.4.6.2.2 Online Poker Market Size & Forecast, By Device, 2021 – 2032

   9.4.6.2.3 Online Poker Market Size & Forecast, By Game Format, 2021 – 2032

   9.4.6.2.4 Online Poker Market Size & Forecast, Payment Mode, 2021 – 2032

  9.4.6.3 Japan

   9.4.6.3.1 Online Poker Market Size & Forecast, By Game Type, 2021 – 2032

   9.4.6.3.2 Online Poker Market Size & Forecast, By Device, 2021 – 2032

   9.4.6.3.3 Online Poker Market Size & Forecast, By Game Format, 2021 – 2032

   9.4.6.3.4 Online Poker Market Size & Forecast, Payment Mode, 2021 – 2032

  9.4.6.4 South Korea

   9.4.6.4.1 Online Poker Market Size & Forecast, By Game Type, 2021 – 2032

   9.4.6.4.2 Online Poker Market Size & Forecast, By Device, 2021 – 2032

   9.4.6.4.3 Online Poker Market Size & Forecast, By Game Format, 2021 – 2032

   9.4.6.4.4 Online Poker Market Size & Forecast, Payment Mode, 2021 – 2032

  9.4.6.5 Australia

   9.4.6.5.1 Online Poker Market Size & Forecast, By Game Type, 2021 – 2032

   9.4.6.5.2 Online Poker Market Size & Forecast, By Device, 2021 – 2032

   9.4.6.5.3 Online Poker Market Size & Forecast, By Game Format, 2021 – 2032

   9.4.6.5.4 Online Poker Market Size & Forecast, Payment Mode, 2021 – 2032

  9.4.6.6 ASEAN Countries

   9.4.6.6.1 Online Poker Market Size & Forecast, By Game Type, 2021 – 2032

   9.4.6.6.2 Online Poker Market Size & Forecast, By Device, 2021 – 2032

   9.4.6.6.3 Online Poker Market Size & Forecast, By Game Format, 2021 – 2032

   9.4.6.6.4 Online Poker Market Size & Forecast, Payment Mode, 2021 – 2032

  9.4.6.7 Rest of Asia-Pacific

   9.4.6.7.1 Online Poker Market Size & Forecast, By Game Type, 2021 – 2032

   9.4.6.7.2 Online Poker Market Size & Forecast, By Device, 2021 – 2032

   9.4.6.7.3 Online Poker Market Size & Forecast, By Game Format, 2021 – 2032

   9.4.6.7.4 Online Poker Market Size & Forecast, Payment Mode, 2021 – 2032

9.5 Latin America

 9.5.1 Key Trends

 9.5.2 Online Poker Market Size & Forecast, By Game Type, 2021 – 2032

 9.5.3 Online Poker Market Size & Forecast, By Device, 2021 – 2032

 9.5.4 Online Poker Market Size & Forecast, By Game Format, 2021 – 2032

 9.5.5 Online Poker Market Size & Forecast, Payment Mode, 2021 – 2032

 9.5.6 Online Poker Market Size & Forecast, By Country, 2021 – 2032

  9.5.6.1 Brazil

   9.5.6.1.1 Online Poker Market Size & Forecast, By Game Type, 2021 – 2032

   9.5.6.1.2 Online Poker Market Size & Forecast, By Device, 2021 – 2032

   9.5.6.1.3 Online Poker Market Size & Forecast, By Game Format, 2021 – 2032

   9.5.6.1.4 Online Poker Market Size & Forecast, Payment Mode, 2021 – 2032

  9.5.6.2 Argentina

   9.5.6.2.1 Online Poker Market Size & Forecast, By Game Type, 2021 – 2032

   9.5.6.2.2 Online Poker Market Size & Forecast, By Device, 2021 – 2032

   9.5.6.2.3 Online Poker Market Size & Forecast, By Game Format, 2021 – 2032

   9.5.6.2.4 Online Poker Market Size & Forecast, Payment Mode, 2021 – 2032

  9.5.6.3 Mexico

   9.5.6.3.1 Online Poker Market Size & Forecast, By Game Type, 2021 – 2032

   9.5.6.3.2 Online Poker Market Size & Forecast, By Device, 2021 – 2032

   9.5.6.3.3 Online Poker Market Size & Forecast, By Game Format, 2021 – 2032

   9.5.6.3.4 Online Poker Market Size & Forecast, Payment Mode, 2021 – 2032

  9.5.6.4 Colombia

   9.5.6.4.1 Online Poker Market Size & Forecast, By Game Type, 2021 – 2032

   9.5.6.4.2 Online Poker Market Size & Forecast, By Device, 2021 – 2032

   9.5.6.4.3 Online Poker Market Size & Forecast, By Game Format, 2021 – 2032

   9.5.6.4.4 Online Poker Market Size & Forecast, Payment Mode, 2021 – 2032

  9.5.6.5 Rest of Latin America

   9.5.6.5.1 Online Poker Market Size & Forecast, By Game Type, 2021 – 2032

   9.5.6.5.2 Online Poker Market Size & Forecast, By Device, 2021 – 2032

   9.5.6.5.3 Online Poker Market Size & Forecast, By Game Format, 2021 – 2032

   9.5.6.5.4 Online Poker Market Size & Forecast, Payment Mode, 2021 – 2032

9.6 Middle East & Africa

 9.6.1 Key Trends

 9.6.2 Online Poker Market Size & Forecast, By Game Type, 2021 – 2032

 9.6.3 Online Poker Market Size & Forecast, By Device, 2021 – 2032

 9.6.4 Online Poker Market Size & Forecast, By Game Format, 2021 – 2032

 9.6.5 Online Poker Market Size & Forecast, Payment Mode, 2021 – 2032

 9.6.6 Online Poker Market Size & Forecast, By Country, 2021 – 2032

  9.6.6.1 UAE

   9.6.6.1.1 Online Poker Market Size & Forecast, By Game Type, 2021 – 2032

   9.6.6.1.2 Online Poker Market Size & Forecast, By Device, 2021 – 2032

   9.6.6.1.3 Online Poker Market Size & Forecast, By Game Format, 2021 – 2032

   9.6.6.1.4 Online Poker Market Size & Forecast, Payment Mode, 2021 – 2032

  9.6.6.2 Saudi Arabia

   9.6.6.2.1 Online Poker Market Size & Forecast, By Game Type, 2021 – 2032

   9.6.6.2.2 Online Poker Market Size & Forecast, By Device, 2021 – 2032

   9.6.6.2.3 Online Poker Market Size & Forecast, By Game Format, 2021 – 2032

   9.6.6.2.4 Online Poker Market Size & Forecast, Payment Mode, 2021 – 2032

  9.6.6.3 Qatar

   9.6.6.3.1 Online Poker Market Size & Forecast, By Game Type, 2021 – 2032

   9.6.6.3.2 Online Poker Market Size & Forecast, By Device, 2021 – 2032

   9.6.6.3.3 Online Poker Market Size & Forecast, By Game Format, 2021 – 2032

   9.6.6.3.4 Online Poker Market Size & Forecast, Payment Mode, 2021 – 2032

  9.6.6.4 Egypt

   9.6.6.4.1 Online Poker Market Size & Forecast, By Game Type, 2021 – 2032

   9.6.6.4.2 Online Poker Market Size & Forecast, By Device, 2021 – 2032

   9.6.6.4.3 Online Poker Market Size & Forecast, By Game Format, 2021 – 2032

   9.6.6.4.4 Online Poker Market Size & Forecast, Payment Mode, 2021 – 2032

  9.6.6.5 South Africa

   9.6.6.5.1 Online Poker Market Size & Forecast, By Game Type, 2021 – 2032

   9.6.6.5.2 Online Poker Market Size & Forecast, By Device, 2021 – 2032

   9.6.6.5.3 Online Poker Market Size & Forecast, By Game Format, 2021 – 2032

   9.6.6.5.4 Online Poker Market Size & Forecast, Payment Mode, 2021 – 2032

  9.6.6.6 Rest of Middle East & Africa

   9.6.6.6.1 Online Poker Market Size & Forecast, By Game Type, 2021 – 2032

   9.6.6.6.2 Online Poker Market Size & Forecast, By Device, 2021 – 2032

   9.6.6.6.3 Online Poker Market Size & Forecast, By Game Format, 2021 – 2032

   9.6.6.6.4 Online Poker Market Size & Forecast, Payment Mode, 2021 – 2032

10. Competitive Landscape

 10.1 Key Players' Positioning

 10.2 Competitive Developments

  10.2.1 Key Strategies Adopted (%), By Key Players, 2024

  10.2.2 Year-Wise Strategies & Development, 2021 – 2025

  10.2.3 Number Of Strategies Adopted By Key Players, 2024

 10.3 Market Share Analysis, 2024

 10.4 Product/Service & Application Benchmarking

  10.4.1 Product/Service Specifications & Features By Key Players

  10.4.2 Product/Service Heatmap By Key Players

  10.4.3 Application Heatmap By Key Players

 10.5 Industry Start-Up & Innovation Landscape

 10.6 Key Company Profiles

10.6 Key Company Profiles

10.6.1 Americas Cardroom

  10.6.1.1 Company Overview & Snapshot

  10.6.1.2 Product/Service Portfolio

  10.6.1.3 Key Company Financials

  10.6.1.4 SWOT Analysis

10.6.2 Baazi Games

  10.6.2.1 Company Overview & Snapshot

  10.6.2.2 Product/Service Portfolio

  10.6.2.3 Key Company Financials

  10.6.2.4 SWOT Analysis

10.6.3 BetOnline

  10.6.3.1 Company Overview & Snapshot

  10.6.3.2 Product/Service Portfolio

  10.6.3.3 Key Company Financials

  10.6.3.4 SWOT Analysis

10.6.4 BLITZ POKER

  10.6.4.1 Company Overview & Snapshot

  10.6.4.2 Product/Service Portfolio

  10.6.4.3 Key Company Financials

  10.6.4.4 SWOT Analysis

10.6.5 Ignition

  10.6.5.1 Company Overview & Snapshot

  10.6.5.2 Product/Service Portfolio

  10.6.5.3 Key Company Financials

  10.6.5.4 SWOT Analysis

10.6.6 MPL

  10.6.6.1 Company Overview & Snapshot

  10.6.6.2 Product/Service Portfolio

  10.6.6.3 Key Company Financials

  10.6.6.4 SWOT Analysis

10.6.7 Playtika

  10.6.7.1 Company Overview & Snapshot

  10.6.7.2 Product/Service Portfolio

  10.6.7.3 Key Company Financials

  10.6.7.4 SWOT Analysis

10.6.8 Pocket52

  10.6.8.1 Company Overview & Snapshot

  10.6.8.2 Product/Service Portfolio

  10.6.8.3 Key Company Financials

  10.6.8.4 SWOT Analysis

10.6.9 PokerStars

  10.6.9.1 Company Overview & Snapshot

  10.6.9.2 Product/Service Portfolio

  10.6.9.3 Key Company Financials

  10.6.9.4 SWOT Analysis

10.6.10 Tencent

  10.6.10.1 Company Overview & Snapshot

  10.6.10.2 Product/Service Portfolio

  10.6.10.3 Key Company Financials

  10.6.10.4 SWOT Analysis

10.6.11 True Poker

  10.6.11.1 Company Overview & Snapshot

  10.6.11.2 Product/Service Portfolio

  10.6.11.3 Key Company Financials

  10.6.11.4 SWOT Analysis

10.6.12 Zynga Inc.

  10.6.12.1 Company Overview & Snapshot

  10.6.12.2 Product/Service Portfolio

  10.6.12.3 Key Company Financials

  10.6.12.4 SWOT Analysis

10.6.13 888 Holdings

  10.6.13.1 Company Overview & Snapshot

  10.6.13.2 Product/Service Portfolio

  10.6.13.3 Key Company Financials

  10.6.13.4 SWOT Analysis

10.6.14 Entain

  10.6.14.1 Company Overview & Snapshot

  10.6.14.2 Product/Service Portfolio

  10.6.14.3 Key Company Financials

  10.6.14.4 SWOT Analysis

10.6.15 Caesars Entertainment

  10.6.15.1 Company Overview & Snapshot

  10.6.15.2 Product/Service Portfolio

  10.6.15.3 Key Company Financials

  10.6.15.4 SWOT Analysis

10.6.16 GG Poker

  10.6.16.1 Company Overview & Snapshot

  10.6.16.2 Product/Service Portfolio

  10.6.16.3 Key Company Financials

  10.6.16.4 SWOT Analysis

10.6.17 Winning Poker Network

  10.6.17.1 Company Overview & Snapshot

  10.6.17.2 Product/Service Portfolio

  10.6.17.3 Key Company Financials

  10.6.17.4 SWOT Analysis

10.6.18 PokerBaazi

  10.6.18.1 Company Overview & Snapshot

  10.6.18.2 Product/Service Portfolio

  10.6.18.3 Key Company Financials

  10.6.18.4 SWOT Analysis

10.6.19 Adda52

  10.6.19.1 Company Overview & Snapshot

  10.6.19.2 Product/Service Portfolio

  10.6.19.3 Key Company Financials

  10.6.19.4 SWOT Analysis

10.6.20 Kindred Group

  10.6.20.1 Company Overview & Snapshot

  10.6.20.2 Product/Service Portfolio

  10.6.20.3 Key Company Financials

  10.6.20.4 SWOT Analysis

10.6.21 Natural8

  10.6.21.1 Company Overview & Snapshot

  10.6.21.2 Product/Service Portfolio

  10.6.21.3 Key Company Financials

  10.6.21.4 SWOT Analysis

10.6.22 Bodog Poker

  10.6.22.1 Company Overview & Snapshot

  10.6.22.2 Product/Service Portfolio

  10.6.22.3 Key Company Financials

  10.6.22.4 SWOT Analysis

11. Analyst Recommendations

 11.1 SNS Insider Opportunity Map

 11.2 Industry Low-Hanging Fruit Assessment

 11.3 Market Entry & Growth Strategy

 11.4 Analyst Viewpoint & Suggestions On Market Growth

12. Assumptions

13. Disclaimer

14. Appendix

 14.1 List Of Tables

 14.2 List Of Figures

An accurate research report requires proper strategizing as well as implementation. There are multiple factors involved in the completion of good and accurate research report and selecting the best methodology to compete the research is the toughest part. Since the research reports we provide play a crucial role in any company’s decision-making process, therefore we at SNS Insider always believe that we should choose the best method which gives us results closer to reality. This allows us to reach at a stage wherein we can provide our clients best and accurate investment to output ratio.

Each report that we prepare takes a timeframe of 350-400 business hours for production. Starting from the selection of titles through a couple of in-depth brain storming session to the final QC process before uploading our titles on our website we dedicate around 350 working hours. The titles are selected based on their current market cap and the foreseen CAGR and growth.


The 5 steps process:

Step 1: Secondary Research:

Secondary Research or Desk Research is as the name suggests is a research process wherein, we collect data through the readily available information. In this process we use various paid and unpaid databases which our team has access to and gather data through the same. This includes examining of listed companies’ annual reports, Journals, SEC filling etc. Apart from this our team has access to various associations across the globe across different industries. Lastly, we have exchange relationships with various university as well as individual libraries.

Secondary Research

Step 2: Primary Research

When we talk about primary research, it is a type of study in which the researchers collect relevant data samples directly, rather than relying on previously collected data.  This type of research is focused on gaining content specific facts that can be sued to solve specific problems. Since the collected data is fresh and first hand therefore it makes the study more accurate and genuine.

We at SNS Insider have divided Primary Research into 2 parts.

Part 1 wherein we interview the KOLs of major players as well as the upcoming ones across various geographic regions. This allows us to have their view over the market scenario and acts as an important tool to come closer to the accurate market numbers. As many as 45 paid and unpaid primary interviews are taken from both the demand and supply side of the industry to make sure we land at an accurate judgement and analysis of the market.

This step involves the triangulation of data wherein our team analyses the interview transcripts, online survey responses and observation of on filed participants. The below mentioned chart should give a better understanding of the part 1 of the primary interview.

Primary Research

Part 2: In this part of primary research the data collected via secondary research and the part 1 of the primary research is validated with the interviews from individual consultants and subject matter experts.

Consultants are those set of people who have at least 12 years of experience and expertise within the industry whereas Subject Matter Experts are those with at least 15 years of experience behind their back within the same space. The data with the help of two main processes i.e., FGDs (Focused Group Discussions) and IDs (Individual Discussions). This gives us a 3rd party nonbiased primary view of the market scenario making it a more dependable one while collation of the data pointers.

Step 3: Data Bank Validation

Once all the information is collected via primary and secondary sources, we run that information for data validation. At our intelligence centre our research heads track a lot of information related to the market which includes the quarterly reports, the daily stock prices, and other relevant information. Our data bank server gets updated every fortnight and that is how the information which we collected using our primary and secondary information is revalidated in real time.

Data Bank Validation

Step 4: QA/QC Process

After all the data collection and validation our team does a final level of quality check and quality assurance to get rid of any unwanted or undesired mistakes. This might include but not limited to getting rid of the any typos, duplication of numbers or missing of any important information. The people involved in this process include technical content writers, research heads and graphics people. Once this process is completed the title gets uploader on our platform for our clients to read it.

Step 5: Final QC/QA Process:

This is the last process and comes when the client has ordered the study. In this process a final QA/QC is done before the study is emailed to the client. Since we believe in giving our clients a good experience of our research studies, therefore, to make sure that we do not lack at our end in any way humanly possible we do a final round of quality check and then dispatch the study to the client.

Key Segments: 

By Game Type

    • Texas Hold’em

    • Omaha

    • 7-Card Stud

    • Others

By Device

    • Desktop (PC)

    • Smartphone

By Game Format

    • Cash Games

    • Tournaments

    • Fast-Fold Poker

Payment Mode

  • Credit/Debit Cards

  • E-Wallets

  • Cryptocurrencies

  • Bank Transfers

Request for Segment Customization as per your Business Requirement: Segment Customization Request

Regional Coverage: 

North America

  • US

  • Canada

Europe

  • Germany

  • France

  • UK

  • Italy

  • Spain

  • Poland

  • Russia

  • Rest of Europe

Asia Pacific

  • China

  • India

  • Japan

  • South Korea

  • Australia

  • ASEAN Countries

  • Rest of Asia Pacific

Middle East & Africa

  • UAE

  • Saudi Arabia

  • Qatar

  • South Africa

  • Rest of Middle East & Africa

Latin America

  • Brazil

  • Argentina

  • Mexico

  • Colombia

  • Rest of Latin America

Request for Country Level Research Report: Country Level Customization Request

Available Customization 

With the given market data, SNS Insider offers customization as per the company’s specific needs. The following customization options are available for the report: 

  • Detailed Volume Analysis 

  • Criss-Cross segment analysis (e.g. Product X Application) 

  • Competitive Product Benchmarking 

  • Geographic Analysis 

  • Additional countries in any of the regions 

  • Customized Data Representation 

  • Detailed analysis and profiling of additional market players

Explore Key Insights.


  • Analyzes market trends, forecasts, and regional dynamics
  • Covers core offerings, innovations, and industry use cases
  • Profiles major players, value chains, and strategic developments
  • Highlights innovation trends, regulatory impacts, and growth opportunities
Request an Analyst Call