Online Travel Market Report Scope & Overview:
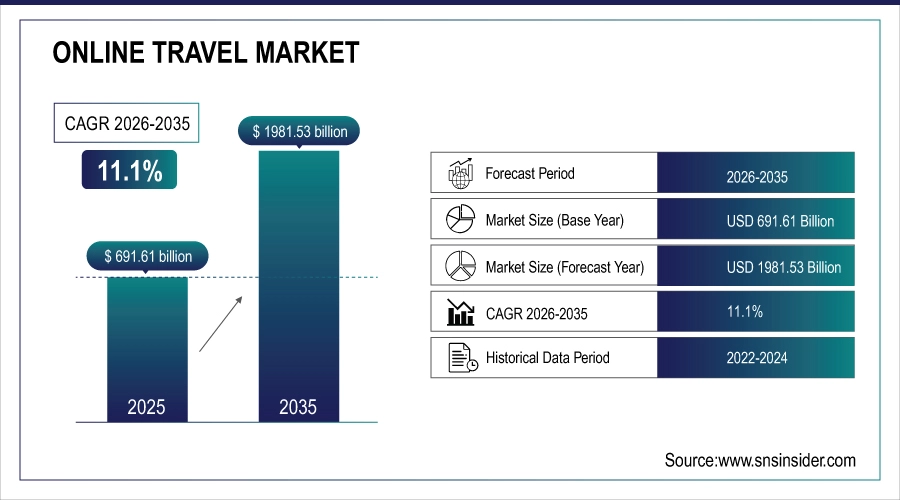
The Online Travel Market was valued at USD 691.61 billion in 2025 and is expected to reach USD 1981.53 billion by 2035, growing at a CAGR of 11.1% from 2026-2035.
The market is a dynamic segment of the tourism industry, enabling users to book flights, accommodations, and travel services through digital platforms. Growth is fueled by rising internet usage, smartphone adoption, and consumer preference for convenience and cost-efficiency. Online travel agencies, aggregators, and service providers are leveraging technology to enhance user experience, personalization, and real-time updates. Emerging trends like AI-driven recommendations, virtual tours, and eco-friendly travel choices are transforming how people plan and book trips.
According to a study, increased internet penetration and smartphone usage have led to over 80% of travelers booking trips online. As a result, online travel agencies now account for nearly 60% of digital travel sales. The rise of mobile apps has influenced more than 70% of last-minute bookings. Additionally, around 65% of travelers prefer personalized recommendations, driving platforms to invest in AI and machine learning. This digital shift continues to transform consumer behavior and reshape the travel booking landscape.
Online Travel Market Size and Forecast
-
Market Size in 2025: USD 691.61 Billion
-
Market Size by 2035: USD 1981.53 Billion
-
CAGR: 11.1% from 2026 to 2035
-
Base Year: 2025
-
Forecast Period: 2026–2035
-
Historical Data: 2022–2024
To Get more information on Online Travel Market - Request Free Sample Report
Online Travel Market Trends
-
Rising demand for convenient, flexible, and personalized travel booking is driving the online travel market.
-
Growing adoption of mobile apps, OTA platforms, and AI-driven recommendation systems is boosting market growth.
-
Expansion of leisure, corporate, and domestic travel is fueling platform usage.
-
Increasing focus on dynamic pricing, real-time inventory, and seamless booking experiences is shaping adoption trends.
-
Advancements in virtual tours, AR/VR experiences, and AI-powered chatbots are enhancing customer engagement.
-
Rising internet penetration, smartphone usage, and digital payment adoption are supporting market expansion.
-
Collaborations between travel agencies, airlines, hotels, and technology providers are accelerating innovation and global reach.
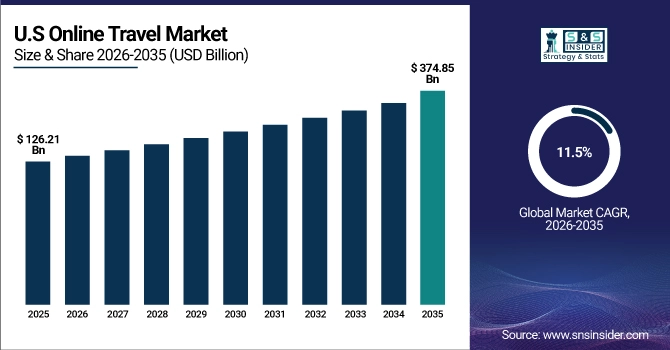
The U.S. Online Travel Market was valued at USD 126.21 billion in 2025 and is expected to reach USD 374.85 billion by 2035, growing at a CAGR of 11.5% from 2026-2035. The driving factor for the U.S. online travel market is the high digital adoption rate, as over 85% of Americans use the internet to plan and book trips. As a result, the U.S. dominates the North American market due to its advanced digital infrastructure, widespread smartphone penetration, and strong presence of major online travel agencies.
Online Travel Market Growth Drivers:
-
Rising Internet and Mobile Penetration Across the U.S. Drives Digital Travel Bookings in the Online Travel Market
The widespread adoption of internet services and smartphones across the United States has significantly transformed how travelers plan and book their trips. As digital literacy continues to grow, more than 85% of U.S. travelers now use online platforms for booking flights, hotels, and activities, creating a massive demand for seamless digital travel solutions. This digital shift is a major driver of the online travel market, as tech-savvy users prefer quick, convenient, and personalized travel planning. The constant rollout of user-friendly apps, improved mobile payment systems, and targeted promotions further boosts online engagement. Additionally, the emergence of real-time pricing, predictive AI tools, and chatbot support enhances user experience, making digital channels the go-to source for travel decisions.
In June 2024, a major U.S. based travel booking platform launched an AI-integrated tool that provides real-time itinerary suggestions based on personal travel habits. This development highlights how rising digital penetration is not only increasing demand but also encouraging innovation across online travel services.
Online Travel Market Restraints:
-
Data Privacy and Cybersecurity Concerns Limit Consumer Confidence in the Online Travel Market
Despite the growth of the online travel market, data privacy and cybersecurity concerns remain a key restraint, directly affecting consumer trust and platform adoption. With millions of users sharing sensitive personal and financial information online, the risk of data breaches, identity theft, and cyberattacks becomes a significant concern. As a result, travelers may hesitate to complete bookings or store their payment information on these platforms, hindering conversion rates and user retention. Even with stringent regulations and improved encryption technologies, repeated incidents involving data leaks continue to impact brand reputations and discourage first-time users.
The cause-effect dynamic is clear, the more valuable user data becomes, the greater the need for cybersecurity, and when platforms fall short, it negatively impacts user confidence. Smaller travel startups particularly struggle with meeting these security expectations, which often leads consumers to favor established, trusted brands. This creates a competitive imbalance and slows market expansion in underserved or rural areas, further challenging the industry.
Online Travel Market Opportunities:
-
Emerging AI-Powered Personalization Tools Create New Avenues in the Online Travel Market Growth
The rising demand for customized travel experiences has created a major opportunity for the online travel market through AI-powered personalization. Consumers now expect tailored travel suggestions based on their search history, budget, interests, and real-time conditions. This shift is fueling innovation, pushing platforms to invest in machine learning, predictive analytics, and behavior-driven content. As a result, users receive curated options for flights, hotels, and activities, increasing booking rates and platform loyalty. The cause here is the growing expectation for convenience and relevance, and the effect is the adoption of intelligent systems that optimize user journeys, upsell services, and reduce cart abandonment.
In April 2025, a leading online travel provider in the U.S. introduced a real-time itinerary planner powered by machine learning, which automatically adjusts based on weather changes, delays, or budget updates. This advancement demonstrated how personalized, responsive features not only elevate user satisfaction but also increase average transaction values.
Online Travel Market Challenges:
-
High Dependence on Real-Time Inventory and Supplier Integration Poses Challenges to the Online Travel Market
The online travel market heavily depends on real-time inventory access and seamless integration with airlines, hotels, and other travel service providers. This reliance presents a significant challenge, as any delays or discrepancies in supplier data can result in booking errors, poor user experience, and customer dissatisfaction. When inventory updates are not synchronized across platforms, users may encounter price mismatches or unavailable listings, which erodes trust in the platform. The cause lies in the fragmented nature of supplier networks, and the effect is reduced booking efficiency and increased support overhead. Moreover, technical issues such as API failures, downtime in supplier systems, or inconsistent formatting standards further complicate integration efforts. These disruptions are particularly problematic during peak travel seasons when demand surges and system reliability becomes critical.
Online Travel Market Segmentation Analysis:
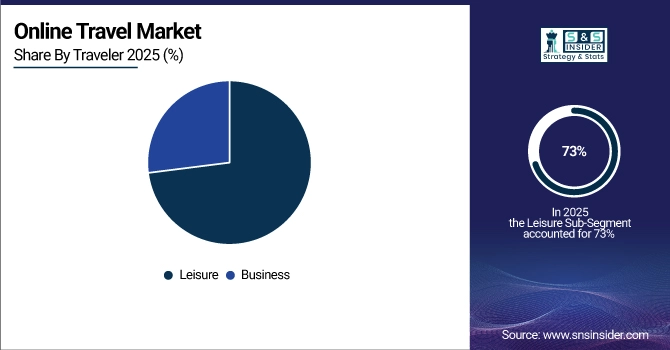
By Traveler
Leisure travel holds a 73% share in 2025, driven by rising disposable incomes, seasonal promotions, and flexible working models allowing for more personal trips. Travelers increasingly seek unique experiences, encouraging platforms to showcase curated getaways and family packages. In response, online agencies are enhancing destination discovery, reviews, and itinerary customization. This behavior shift fuels leisure’s market dominance and aligns directly with the expanded scope of services in the online travel market.
Business travel is growing at a CAGR of 12.54%, driven by the revival of in-person meetings and industry events. Companies are focusing on cost control and policy compliance, encouraging use of centralized digital booking tools. Platforms are responding by offering corporate dashboards, invoicing integration, and flexible rescheduling options. This evolution in business travel logistics increases reliance on digital platforms, further embedding corporate usage into the broader online travel market landscape.
By Services
Transportation holds the largest share of 42% in 2025 due to rising air travel, urban mobility options, and the integration of ride-sharing and intercity transport booking within travel platforms. This demand has pushed online platforms to offer bundled services and real-time availability of flights, buses, and trains. As convenience drives usage, companies are developing mobile-first solutions with live tracking, seat selection, and dynamic pricing, supporting transportation's dominance and directly contributing to the revenue leadership in the online travel market.
The accommodation segment is growing at the highest CAGR of 12.35%, driven by increased demand for personalized stays, flexible cancellations, and vacation rentals. Travelers now expect rich content, virtual tours, and price comparisons through digital platforms. In response, travel brands are enhancing hotel listings with user-generated content and instant booking integration. This evolution in user preferences has led to higher engagement, expanding booking volumes and elevating accommodation's impact on the overall growth of the online travel market.
By Mode of Booking
Online travel agencies (OTAs) dominate with a 56% share in 2025 due to their extensive inventory, price comparison tools, and multi-service bundling. The shift toward all-in-one platforms offering flights, hotels, and packages has boosted consumer reliance. OTAs have responded with AI-driven interfaces, loyalty programs, and seamless mobile experiences. This continuous product development ensures user convenience and choice, strengthening OTAs’ leadership role and enhancing their influence within the evolving U.S. online travel market ecosystem.
Direct travel suppliers are growing at a CAGR of 11.92% as brands aim to build direct customer relationships through exclusive offers and loyalty perks. This shift is driven by users seeking transparency and customized services from hotels or airlines directly. To compete with OTAs, suppliers have launched robust mobile apps, dynamic pricing tools, and direct messaging features. This move toward direct engagement is reshaping digital strategy and fueling growth in the U.S. online travel market.
By Platform
The mobile-based platform leads with 53% of the market in 2025 due to smartphone convenience, location-based services, and app-exclusive deals. Travelers prefer real-time updates, single-click bookings, and mobile boarding passes. Travel brands have responded by optimizing app performance, introducing voice search, and in-app chatbots. This shift to mobile has redefined how users interact with travel platforms, firmly establishing mobile as the dominant platform in the online travel market.
The web-based platform is growing at a CAGR of 11.54%, as users favor desktop browsing for complex itineraries and multi-city bookings. The need for detailed comparisons and broader visibility has prompted companies to enhance web interfaces with filter options, trip planners, and live customer support. This expanded usability appeals to cautious or bulk bookers, sustaining web engagement and supporting overall growth in the U.S. online travel market.
By Application
Domestic bookings lead with a 70% share in 2025, driven by local tourism campaigns, affordability, and greater flexibility in planning. Travelers favor short-haul getaways, leading platforms to integrate road trip planning, local experiences, and regional accommodations. Companies have introduced localized pricing, nearby attraction guides, and same-day booking options. These tailored offerings drive high volume and user satisfaction, solidifying domestic travel’s foundational role in the online travel market.
International booking is growing at a CAGR of 12.5%, spurred by reopening borders, remote work flexibility, and interest in global exploration. Travelers are drawn to long-haul destinations with personalized travel packages and flexible cancellation policies. In response, platforms have expanded multi-language support, currency converters, and visa assistance tools. These innovations make international planning more accessible, strengthening this segment’s contribution to the dynamic growth of the online travel market.
Online Travel Market Regional Outlook:
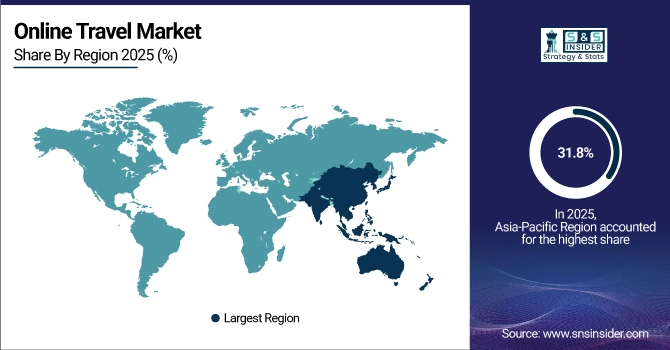
Asia Pacific Online Travel Market Insights
Asia Pacific leads the Online Travel Market with a 31.8% share in 2025, driven by rapid smartphone adoption, expanding internet access, and increasing digital payment usage. The region’s growing middle class and appetite for travel deals are accelerating mobile-based booking trends. Popular travel apps and domestic tourism campaigns have bolstered user engagement. China dominates the Asia Pacific market due to its mature digital ecosystem, widespread mobile wallet integration, and heavy investment in AI-powered travel platforms for dynamic personalization.
Get Customized Report as per Your Business Requirement - Enquiry Now
North America Online Travel Market Insights
North America is the fastest-growing region with an 11.76% CAGR, fueled by high consumer expectations for convenience, widespread AI integration in travel platforms, and rising domestic travel trends. Online bookings are increasing as platforms offer personalized itineraries and loyalty-based pricing. The United States dominates the North American market owing to its tech leadership, high credit card and internet penetration, and growing reliance on digital tools for planning, booking, and managing leisure and business travel.
Europe Online Travel Market Insights
Europe is witnessing steady growth, supported by cross-border travel demand, eco-conscious tourism trends, and increased adoption of mobile-first booking platforms. Travel aggregators are enhancing AI features to promote green travel options and flexible ticketing. Germany dominates the European market due to its digitally aware traveler base, strong rail and air connectivity, and demand for sustainable travel facilitated through advanced booking systems offering real-time availability and carbon-conscious alternatives.
Middle East & Africa and Latin America Online Travel Market Insights
The Middle East & Africa and Latin America regions are seeing growing adoption of online travel platforms, driven by rising mobile usage, improved internet access, and increased tourism infrastructure investment. South Africa leads MEA due to its expanding domestic tourism economy, digital literacy efforts, and online booking support for nature and adventure travel. Brazil dominates Latin America, supported by growth in low-cost airlines, a young mobile-first traveler demographic, and increasing demand for app-based travel planning and flexible payment options.
Online Travel Market Competitive Landscape:
Expedia Group Inc.
Expedia Group Inc. is a leading global online travel platform connecting travelers with hotels, flights, car rentals, vacation packages, and travel services. The company leverages advanced technology, APIs, and AI tools to deliver personalized, seamless travel experiences across leisure and corporate segments. Its ecosystem enables partners worldwide to integrate offerings efficiently, optimize bookings, and enhance customer engagement. Expedia continues to expand globally, providing travel advisors and agencies with innovative tools for management, payment flexibility, and revenue growth.
-
2025: Expedia launched TAAP travel advisor tools, enhancing booking management, payment flexibility, and revenue growth features for travel agents globally.
-
2025: Expedia Group expanded its presence in the Middle East through travel partnerships, extending global supply, advertising technology, and travel agent program services.
Fareportal Inc.
Fareportal Inc. is an online travel company providing innovative booking platforms for flights, hotels, and travel services. It focuses on leveraging AI, VR, IoT, and data analytics to enhance traveler experiences, streamline planning, and improve customer support. Its proprietary technology powers personalized recommendations, AI-driven chatbots, and dynamic pricing strategies, making online travel faster and more intuitive. Fareportal emphasizes digital innovation, mobile excellence, and industry recognition while continuously adopting next-generation tools to redefine online travel engagement for consumers worldwide.
-
2024: Fareportal explored how AI, VR, IoT, and data analytics reshape online tourism planning and customer experience for smarter travel technology.
-
2025: Fareportal and Frontier Airlines launched a New Distribution Capability API, offering travelers personalized booking options including seats and baggage purchases.
Hostelworld Group plc
Hostelworld Group plc is a global online booking platform specializing in hostels, budget accommodations, and social travel experiences. The company connects backpackers, young travelers, and budget-conscious tourists with verified hostels worldwide. Hostelworld emphasizes community-driven features, social connectivity, and travel engagement through innovative tools that enhance booking transparency and user interactions. Its Social Pass and membership programs foster global traveler connections, encouraging networking and shared experiences while expanding access to affordable, safe, and memorable accommodations across international destinations.
-
2025: Hostelworld reached 3 million members and launched Social Pass to power social travel connections and engagement for global backpackers and budget-travel communities.
Key Players
Some of the Online Travel Market Companies
-
Fareportal Inc.
-
Hostelworld Group plc
-
HRS
-
Hurb
-
MakeMyTrip Pvt. Ltd.
-
priceline.com LLC
-
Thomas Cook India Ltd.
-
TripAdvisor Inc.
-
Yatra.com
-
Booking Holdings Inc.
-
Airbnb, Inc.
-
Trip.com Group
-
eDreams ODIGEO
-
Traveloka
-
Despegar (Decolar)
-
Hotelbeds (HBX Group)
-
GetYourGuide
-
Opodo
-
Etraveli Group
| Report Attributes | Details |
|---|---|
| Market Size in 2025 | USD 691.61 Billion |
| Market Size by 2035 | USD 1981.53 Billion |
| CAGR | CAGR of 11.1% From 2026 to 2035 |
| Base Year | 2025 |
| Forecast Period | 2026-2035 |
| Historical Data | 2022-2024 |
| Report Scope & Coverage | Market Size, Segments Analysis, Competitive Landscape, Regional Analysis, DROC & SWOT Analysis, Forecast Outlook |
| Key Segments | • By Services (Transportation [Airline, Car Rental, Rail, Cruise, Bus], Accommodation, Tour Packages) • By Mode of Booking (Online Travel Agencies, Direct Travel Suppliers) • By Platform (Mobile-based, Web-based) • By Traveler Type (Leisure, Business) • By Application (International Booking, Domestic Booking) |
| Regional Analysis/Coverage | North America (US, Canada), Europe (Germany, UK, France, Italy, Spain, Russia, Poland, Rest of Europe), Asia Pacific (China, India, Japan, South Korea, Australia, ASEAN Countries, Rest of Asia Pacific), Middle East & Africa (UAE, Saudi Arabia, Qatar, South Africa, Rest of Middle East & Africa), Latin America (Brazil, Argentina, Mexico, Colombia, Rest of Latin America). |
| Company Profiles | Expedia Group Inc., Fareportal Inc., Hostelworld Group plc, HRS, Hurb, MakeMyTrip Pvt. Ltd., priceline.com LLC (Booking Holdings Inc.), Thomas Cook India Ltd. (Fairfax Financial Holdings Limited), TripAdvisor Inc., Yatra.com, Booking Holdings Inc., Airbnb, Inc., Trip.com Group, eDreams ODIGEO, Traveloka, Despegar (Decolar), Hotelbeds (HBX Group), GetYourGuide, Opodo, Etraveli Group. |
Frequently Asked Questions
Ans: North America dominated the Online Travel Market in 2025.
Ans: The Transportation segment dominated the Online Travel Market.
Ans: The major growth factor of the online travel market is the increasing adoption of smartphones and internet access for convenient travel planning and booking.
Ans: The Online Travel Market was valued at USD 691.61 billion in 2025 and is expected to reach USD 1981.53 billion by 2035.
Ans: The Online Travel Market is expected to grow at a CAGR of 11.1% during 2026-2035.
Get in Touch
