Physical Identity And Access Management Market Report Scope & Overview:
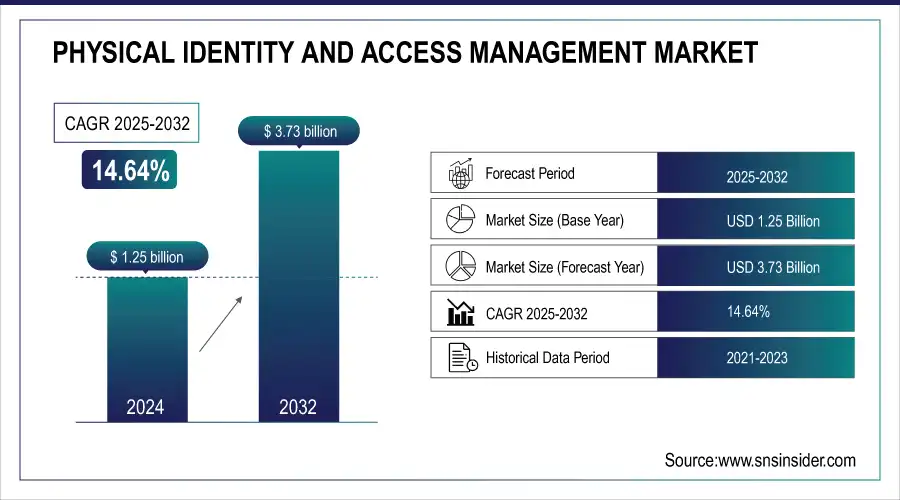
The Physical Identity and Access Management Market was valued at USD 1.25 billion in 2024 and is expected to reach USD 3.73 billion by 2032, growing at a CAGR of 14.64% from 2025-2032.

To Get more information on Physical Identity And Access Management Market - Request Free Sample Report
This report includes comprehensive insights into key performance indicators such as security incident reduction metrics, time-to-implement, system integration and interoperability, access card and credential trends, and automation and workflow efficiency. The market is being shaped by the increasing demand for scalable identity governance solutions, especially in large enterprises and government sectors. Emphasis on automating physical access policies, improving compliance postures, and integrating identity with building management systems is fostering rapid adoption. As organizations prioritize risk mitigation and operational continuity, PIAM platforms are emerging as critical tools to unify and streamline access control across diverse physical and digital environments.
Market Size and Forecast
-
Physical Identity and Access Management Market Size in 2024: USD 1.25 Billion
-
Physical Identity and Access Management Market Size by 2032: USD 3.73 Billion
-
CAGR: 14.64% from 2025 to 2032
-
Base Year: 2024
-
Forecast Period: 2025–2032
-
Historical Data: 2021–2023
Physical Identity and Access Management Market Trends
-
Rising need for secure access control and identity verification is driving the physical IAM market.
-
Integration with biometrics, RFID, and smart card technologies is enhancing security and user convenience.
-
Growing adoption across enterprises, government, and critical infrastructure is boosting market growth.
-
Increasing regulatory compliance requirements for data protection and facility security are shaping adoption.
-
Cloud-based and mobile-enabled IAM solutions are enabling scalable and flexible access management.
-
Expansion of corporate campuses, industrial sites, and healthcare facilities is fueling demand.
-
Collaborations between IAM providers, technology vendors, and security consultants are accelerating innovation and deployment.
U.S. Physical Identity and Access Management Market was valued at USD 0.34 billion in 2024 and is expected to reach USD 1.01 billion by 2032, growing at a CAGR of 14.39% from 2025-2032.
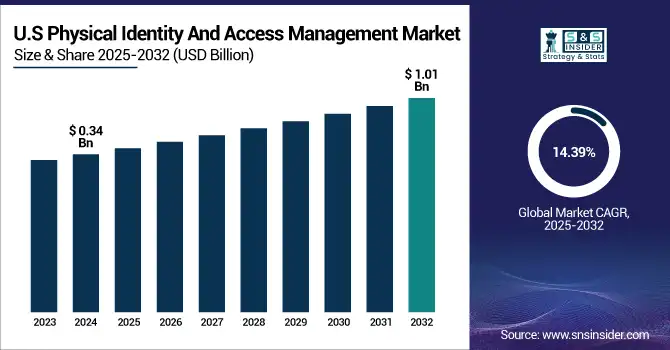
This growth is fueled by the rising need for advanced security frameworks across critical infrastructure, corporate environments, and government facilities. Increasing concerns around identity theft, unauthorized access, and cyber-physical breaches are driving demand for more secure, integrated, and intelligent access solutions. Additionally, the proliferation of hybrid work environments and increased regulatory compliance requirements are prompting organizations to adopt centralized physical identity and access management (PIAM) solutions. The integration of cloud-based platforms and AI-driven analytics is further enhancing decision-making, threat detection, and real-time access control, thus accelerating market growth across the United States.
Physical Identity and Access Management Market Growth Drivers:
-
Rising demand for secure access systems to protect critical infrastructure and sensitive facilities across enterprise and government environments
The growing frequency of data breaches, insider threats, and physical security risks is accelerating the adoption of Physical Identity and Access Management (PIAM) systems. Organizations in sectors such as defense, energy, healthcare, and finance require strict access control policies to protect critical assets and facilities. Traditional access systems no longer suffice in managing dynamic identity lifecycles, especially in high-security environments. PIAM solutions provide centralized, policy-based access control integrated with identity verification, improving situational awareness and response. Moreover, compliance with stringent regulations like NERC CIP, HIPAA, and FISMA is pushing enterprises to invest in intelligent access control. These systems support risk mitigation strategies by enabling real-time monitoring and integration with video surveillance, alarms, and HR systems. The increasing need for proactive threat detection is further driving this market’s growth trajectory.
Physical Identity and Access Management Market Restraints:
-
Lack of standardized protocols and interoperability challenges with legacy security systems hinder seamless implementation
Many organizations operate with legacy physical security systems that lack the interoperability required to integrate with modern PIAM platforms. These outdated systems often use proprietary technologies and do not support modern APIs or standard protocols, making integration time-consuming and costly. The absence of universally accepted standards in physical identity management leads to vendor lock-in and creates roadblocks in system upgrades or cross-platform communication. This technical fragmentation forces organizations to invest heavily in custom integrations or completely overhaul their existing systems, which can delay or derail PIAM implementation. Furthermore, in highly regulated industries, migrating sensitive access data from old systems without compromising security or compliance adds to the complexity, acting as a significant restraint on market expansion.
Physical Identity and Access Management Market Opportunities:
-
Expansion of cloud-based PIAM platforms enabling scalable, flexible, and remote-access-ready security solutions for modern enterprises
The growing adoption of cloud technologies is opening significant opportunities for Physical Identity and Access Management vendors. Cloud-based PIAM solutions offer flexibility, scalability, and lower upfront investment, making them highly attractive for enterprises with distributed operations or hybrid workforces. These platforms enable centralized identity and access control management from any location, supporting real-time updates, remote provisioning, and policy enforcement. Cloud deployment also simplifies maintenance and ensures rapid scalability as business needs evolve. Moreover, Software-as-a-Service (SaaS) models lower IT overhead and support continuous compliance through built-in audit trails and reporting tools. As organizations move away from on-premise legacy systems, cloud-native PIAM solutions offer a compelling upgrade path, particularly for global businesses, multi-site facilities, and industries prioritizing agility and remote access security.
Physical Identity and Access Management Market Challenges:
-
Integrating PIAM with diverse and fragmented enterprise IT ecosystems presents technical complexity and resource constraints
Organizations often operate across a patchwork of legacy systems, cloud applications, on-premise databases, and various physical security technologies, creating challenges in achieving seamless PIAM integration. Each system may have different data structures, access protocols, or compliance needs, making standardized identity governance difficult. Integration demands significant IT effort to map identities, configure APIs, and test cross-system workflows without introducing new vulnerabilities. Additionally, smaller security teams may lack the specialized skills required for such integrations, leading to delays and inefficiencies. Ensuring consistent identity policies and access rules across disconnected environments remains a top challenge. Without a unified architecture, identity gaps, redundancy, or conflicting rules may arise undermining both security and compliance efforts.
Physical Identity and Access Management Market Segment Analysis
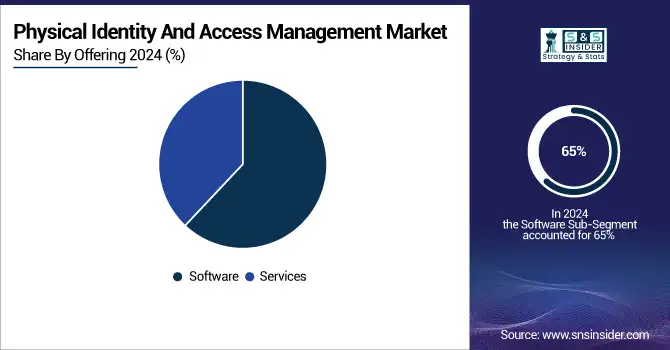
By Offering, Software dominates the Physical Identity and Access Management (PIAM) market, Services are expected to grow fastest.
The Software segment dominated the Physical Identity and Access Management Market with the highest revenue share of about 65% in 2024 due to its central role in enabling real-time identity lifecycle management, access provisioning, and policy enforcement. Enterprises prioritize software solutions for their scalability, integration capabilities, and automation features. The demand for centralized platforms that can seamlessly manage complex identity data across multiple systems, combined with growing cybersecurity concerns and compliance requirements, has significantly elevated the adoption of software-based PIAM platforms across various sectors.
The Services segment is expected to grow at the fastest CAGR of about 15.57% from 2025 to 2032 due to increasing reliance on consulting, deployment, training, and managed services. Organizations are seeking expert assistance for integrating PIAM with existing infrastructure and ensuring regulatory compliance. As PIAM implementations become more complex, the need for tailored service offerings, including maintenance and real-time support, is propelling rapid growth in this segment.
By Application, BFSI dominates the PIAM market, Industrial sector is expected to grow fastest.
The BFSI segment dominated the Physical Identity and Access Management Market with the highest revenue share of about 24% in 2024 owing to stringent regulatory mandates, high-value asset protection, and critical infrastructure security. Financial institutions prioritize identity verification and secure facility access to mitigate risks related to fraud, data breaches, and internal threats. The need to enforce granular access controls and maintain detailed audit trails drives robust adoption of PIAM solutions in the BFSI sector, ensuring consistent compliance and protection across branches and data centers.
The Industrial segment is expected to grow at the fastest CAGR of about 17.01% from 2025 to 2032 due to increasing automation, IoT integration, and heightened security needs in manufacturing and critical infrastructure facilities. Industrial sites require strict access control to safeguard operational continuity and worker safety. With rising digital-physical convergence, organizations are implementing PIAM to unify identity governance across systems, facilities, and roles. Demand for scalable, secure, and audit-friendly solutions is pushing rapid PIAM growth in this sector.
By Product, Backend Database Solutions dominate the PIAM market, Visitor Management is expected to grow fastest.
The Backend Database Solutions segment dominated the Physical Identity and Access Management Market with the highest revenue share of about 44% in 2024 due to its foundational role in storing, managing, and securing identity data across systems. These databases enable fast retrieval, correlation, and verification of credentials while supporting integration with HR, security, and IT platforms. Their importance in providing centralized control, maintaining data integrity, and enabling regulatory compliance makes backend database solutions indispensable to effective PIAM implementation.
The Visitor Management segment is expected to grow at the fastest CAGR of about 16.48% from 2025 to 2032 due to increasing focus on securing temporary access and improving guest experience. Organizations are adopting advanced visitor management systems integrated with facial recognition, digital check-ins, and real-time monitoring to ensure only authorized individuals access restricted areas. Rising demand for contactless entry, audit capabilities, and compliance with safety protocols is accelerating the adoption of PIAM solutions tailored for visitor identification and access control.

Physical Identity and Access Management Market Regional Analysis
North America Physical Identity and Access Management Market Insights
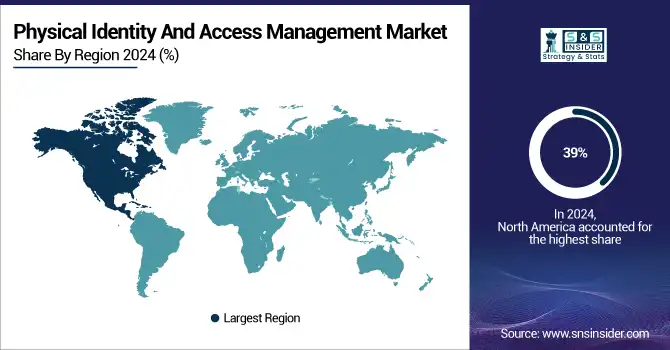
North America dominated the Physical Identity and Access Management Market with the highest revenue share of about 39% in 2024 due to widespread adoption of advanced security technologies, high regulatory compliance demands, and strong presence of key market players. The region’s critical infrastructure sectors including finance, healthcare, and energy require stringent access control measures. Additionally, increased investments in smart buildings, cloud security solutions, and integrated identity management platforms have driven significant PIAM adoption across both public and private sector organizations in the United States and Canada.
Asia Pacific Physical Identity and Access Management Market Insights
Asia Pacific is expected to grow at the fastest CAGR of about 16.86% from 2025 to 2032 due to rapid industrialization, rising urban infrastructure, and increased focus on physical security across emerging economies. Countries like China, India, and Southeast Asian nations are investing heavily in smart city projects and modernizing corporate campuses. The growing need to protect high-traffic facilities, ensure compliance, and manage expanding workforces is fueling strong demand for scalable PIAM solutions in the region.
Europe Physical Identity and Access Management Market Insights
In 2024, Europe holds a significant position in the Physical Identity and Access Management (PIAM) Market, driven by stringent security regulations, advanced infrastructure, and high adoption of identity solutions. Countries like Germany, France, and the UK lead in implementing access control systems across enterprises, government institutions, and critical facilities. Growing concerns over cybersecurity, workplace safety, and regulatory compliance further boost demand, making Europe a key region for PIAM growth.
Middle East & Africa and Latin America Physical Identity and Access Management Market Insights
The Middle East & Africa and Latin America PIAM Markets are witnessing steady growth, fueled by rising security concerns, digital transformation, and adoption of access management solutions. Investments in critical infrastructure, government initiatives for secure facilities, and increasing awareness of identity governance drive market expansion. Limited local solution providers and reliance on global vendors create opportunities, particularly in urban centers and emerging industrial and commercial hubs.

Get Customized Report as per Your Business Requirement - Enquiry Now
Physical Identity and Access Management Market Competitive Landscape:
HID Global Corporation
HID Global Corporation is a leading player in the Physical Identity and Access Management (PIAM) market, offering solutions like HID SAFE Enterprise and HID SAFE for Aviation. The company focuses on secure identity management, credentialing, and access control systems across enterprises and critical infrastructures. HID leverages advanced technologies to enhance security, streamline operations, and support compliance, strengthening its presence globally and driving adoption of integrated physical and digital access management solutions.
-
In January 2025, HID signed agreements to acquire U.S.-based 3millID and U.K.-based Third Millennium. These strategic acquisitions aim to expand HID’s physical access control solutions, strengthen its global market presence, and enhance its offerings in credential and reader technologie
WALLIX
WALLIX is a prominent player in the Physical Identity and Access Management (PIAM) market, offering solutions such as Bastion and Trustelem. The company specializes in privileged access management, secure authentication, and identity governance for enterprises, ensuring compliance and protection against cyber threats. WALLIX focuses on integrating advanced security technologies to provide scalable, efficient, and centralized access control solutions across complex IT and physical infrastructures.
-
2025: WALLIX launched the Web Session Manager, a new module integrated into its unified identity and access management platform, enhancing secure access to web applications in complex digital environments.
IBM
IBM is a leading player in the Physical Identity and Access Management (PIAM) market, offering solutions like Security Verify and Identity Governance and Intelligence. The company provides comprehensive identity management, secure access control, and credential lifecycle management for enterprises. IBM emphasizes integration of advanced analytics, AI, and cloud-based solutions to enhance security, ensure regulatory compliance, and streamline management of both digital and physical identities across diverse organizational environments.
-
2024, IBM added decentralized identity features to its Verify portfolio with IBM Verify Digital Credentials, allowing users to digitize and manage physical credentials like driver's licenses and employee badges securely.
-
2023, IBM's X-Force Threat Intelligence Index 2024 revealed that the use of stolen credentials to access valid accounts surged 71% over the previous year, highlighting the need for robust identity and access management solutions.
Key Players
-
HID Global Corporation (HID SAFE Enterprise, HID SAFE for Aviation)
-
Alert Enterprise (Guardian, Enterprise Guardian Command Center)
-
IBM Corporation (Security Verify, Identity Governance and Intelligence)
-
Nexus Group (Smart ID Physical Access, Smart ID Digital Access)
-
Avatier (Identity Anywhere, Password Station)
-
Access Security Corporation (Access Manager, Security Portal)
-
WALLIX (Bastion, Trustelem)
-
Identiv, Inc. (Velocity Software, uTrust TS Reader)
-
alfrednet s.r.l. (Alnet Access Control, Alnet Visitor Manager)
-
E&M Technologies, Inc. (Identity Management Suite, Access Control Integrator)
-
Quantum Secure (SAFE for Enterprise, SAFE for Secure Facilities)
-
AMAG Technology (Symmetry Access Control, Symmetry CompleteView)
-
LenelS2 (OnGuard, Elements)
-
Brivo (Brivo Access, Brivo Mobile Pass)
-
Kastle Systems (KastlePresence, KastleVisitor)
-
Johnson Controls (C•CURE 9000, P2000 Security Management)
-
Honeywell (Pro-Watch, WIN-PAK)
-
IDCUBE (Access360, TimeX)
-
Micro Focus (NetIQ Identity Manager, NetIQ Access Manager)
-
Okta (Identity Cloud, Lifecycle Management)
-
Gemalto (SafeNet Trusted Access, IDPrime)
-
Oracle (Identity Governance, Access Management Suite)
-
AWS (IAM, AWS SSO)
-
Atos (Evidian IAM Suite, Web Access Manager)
-
Wipro (Access360+, Identity and Access Framework)
Report Attributes | Details |
---|---|
Market Size in 2024 | US$ 1.09 Billion |
Market Size by 2032 | US$ 3.70 Billion |
CAGR | CAGR of 14.64% From 2025 to 2032 |
Base Year | 2024 |
Forecast Period | 2025-2032 |
Historical Data | 2021-2023 |
Report Scope & Coverage | Market Size, Segments Analysis, Competitive Landscape, Regional Analysis, DROC & SWOT Analysis, Forecast Outlook |
Key Segments | • By Offering (Software, Services) • By Product (Backend Database Solutions, Credential Management, Visitor Management) • By Application (BFSI, Defense & Security, Airports, IT & Telecom, Government & Public Sector, Industrial, Others) |
Regional Analysis/Coverage | North America (US, Canada, Mexico), Europe (Eastern Europe [Poland, Romania, Hungary, Turkey, Rest of Eastern Europe] Western Europe] Germany, France, UK, Italy, Spain, Netherlands, Switzerland, Austria, Rest of Western Europe]), Asia Pacific (China, India, Japan, South Korea, Vietnam, Singapore, Australia, Rest of Asia Pacific), Middle East & Africa (Middle East [UAE, Egypt, Saudi Arabia, Qatar, Rest of Middle East], Africa [Nigeria, South Africa, Rest of Africa], Latin America (Brazil, Argentina, Colombia, Rest of Latin America) |
Company Profiles | HID Global Corporation, Alert Enterprise, IBM Corporation, Nexus Group, Avatier, Access Security Corporation, WALLIX, Identiv, Inc., alfrednet s.r.l., E&M Technologies, Inc., Quantum Secure, AMAG Technology, LenelS2, Brivo, Kastle Systems, Johnson Controls, Honeywell, IDCUBE, Micro Focus, Okta, Gemalto, Oracle, AWS, Atos, Wipro |
Table Of Contents
1. Introduction
1.1 Market Definition & Scope
1.2 Research Assumptions & Abbreviations
1.3 Research Methodology
2. Executive Summary
2.1 Market Snapshot
2.2 Market Absolute $ Opportunity Assessment & Y-o-Y Analysis, 2021–2032
2.3 Market Size & Forecast, By Segmentation, 2021–2032
2.3.1 Market Size By Product
2.3.2 Market Size By Application
2.3.3 Market Size By Offering
2.4 Market Share & Bps Analysis By Region, 2024
2.5 Industry Growth Scenarios – Conservative, Likely & Optimistic
2.6 Industry CxO’s Perspective
3. Market Overview
3.1 Market Dynamics
3.1.1 Drivers
3.1.2 Restraints
3.1.3 Opportunities
3.1.4 Key Market Trends
3.2 Industry PESTLE Analysis
3.3 Key Industry Forces (Porter’s) Impacting Market Growth
3.4 Industry Supply Chain Analysis
3.4.1 Raw Material Suppliers
3.4.2 Manufacturers
3.4.3 Distributors/Suppliers
3.4.4 Customers/End-Users
3.5 Industry Life Cycle Assessment
3.6 Parent Market Overview
3.7 Market Risk Assessment
4. Statistical Insights & Trends Reporting
4.1 Deployment & Adoption Metrics
4.1.1 Overview
4.1.2 % Adoption of PIAM Solutions by Organization Type (Enterprises, Government, Healthcare, Education, Industrial)
4.1.3 Number of Active Identities Managed per Organization
4.1.4 Growth Rate of PIAM Deployments by Region (%)
4.1.5 Average Number of Access Points per Organization
4.2 Technology & Integration Metrics
4.2.1 Overview
4.2.2 % Use of Biometric vs. Card-Based vs. Mobile Credential Systems
4.2.3 Integration Rate with IT IAM, HR Systems, and Security Infrastructure (%)
4.2.4 % Adoption of Cloud-Based vs. On-Premises PIAM Solutions
4.2.5 Use of AI/Analytics for Access Risk Assessment and Anomaly Detection (%)
4.3 Security & Compliance Metrics
4.3.1 Overview
4.3.2 % Compliance with GDPR, HIPAA, ISO 27001, and Local Security Regulations
4.3.3 Number of Security Breaches Prevented via PIAM Solutions
4.3.4 % of Organizations Using Multi-Factor Authentication (MFA) for Physical Access
4.3.5 Average Incident Response Time for Unauthorized Access Attempts
4.4 Cost & ROI Metrics
4.4.1 Overview
4.4.2 Average Deployment Cost per Organization (USD)
4.4.3 Annual Maintenance & Licensing Cost (USD)
4.4.4 ROI Metrics: Cost Savings from Reduced Security Incidents (%)
4.4.5 Cost Comparison: Cloud vs. On-Premises PIAM Solutions
4.5 User Experience & Operational Metrics
4.5.1 Overview
4.5.2 User Satisfaction Scores (e.g., NPS or CSAT)
4.5.3 Average Time to Provision or Revoke Access per Employee
4.5.4 % Automated vs. Manual Access Management Processes
4.5.5 Rate of Employee Compliance with Security Policies (%)
5. Physical Identity and Access Management Market Segmental Analysis & Forecast, By Product, 2021 – 2032, Value (Usd Billion)
5.1 Introduction
5.2 Backend Database Solutions
5.2.1 Key Trends
5.2.2 Market Size & Forecast, 2021 – 2032
5.3 Credential Management
5.4 Visitor Management
6. Physical Identity and Access Management Market Segmental Analysis & Forecast, By Application, 2021 – 2032, Value (Usd Billion)
6.1 Introduction
6.2 BFSI
6.2.1 Key Trends
6.2.2 Market Size & Forecast, 2021 – 2032
6.3 Defense & Security
6.4 Airports
6.5 IT & Telecom
6.6 Government & Public Sector
6.7 Industrial
6.8 Others
7. Physical Identity and Access Management Market Segmental Analysis & Forecast, By Offering, 2021 – 2032, Value (Usd Billion)
7.1 Introduction
7.2 Software
7.2.1 Key Trends
7.2.2 Market Size & Forecast, 2021 – 2032
7.3 Services
8. Physical Identity and Access Management Market Segmental Analysis & Forecast By Region, 2021 – 2025, Value (Usd Billion)
8.1 Introduction
8.2 North America
8.2.1 Key Trends
8.2.2 Physical Identity and Access Management Market Size & Forecast, By Product, 2021 – 2032
8.2.3 Physical Identity and Access Management Market Size & Forecast, By Application, 2021 – 2032
8.2.4 Physical Identity and Access Management Market Size & Forecast, By Offering, 2021 – 2032
8.2.5 Physical Identity and Access Management Market Size & Forecast, By Country, 2021 – 2032
8.2.5.1 USA
8.2.5.1.1 Physical Identity and Access Management Market Size & Forecast, By Product, 2021 – 2032
8.2.5.1.2 Physical Identity and Access Management Market Size & Forecast, By Application, 2021 – 2032
8.2.5.1.3 Physical Identity and Access Management Market Size & Forecast, By Offering, 2021 – 2032
8.2.5.2 Canada
8.2.5.2.1 Physical Identity and Access Management Market Size & Forecast, By Product, 2021 – 2032
8.2.5.2.2 Physical Identity and Access Management Market Size & Forecast, By Application, 2021 – 2032
8.2.5.2.3 Physical Identity and Access Management Market Size & Forecast, By Offering, 2021 – 2032
8.3 Europe
8.3.1 Key Trends
8.3.2 Physical Identity and Access Management Market Size & Forecast, By Product, 2021 – 2032
8.3.3 Physical Identity and Access Management Market Size & Forecast, By Application, 2021 – 2032
8.3.4 Physical Identity and Access Management Market Size & Forecast, By Offering, 2021 – 2032
8.3.5 Physical Identity and Access Management Market Size & Forecast, By Country, 2021 – 2032
8.3.5.1 Germany
8.3.5.1.1 Physical Identity and Access Management Market Size & Forecast, By Product, 2021 – 2032
8.3.5.1.2 Physical Identity and Access Management Market Size & Forecast, By Application, 2021 – 2032
8.3.5.1.3 Physical Identity and Access Management Market Size & Forecast, By Offering, 2021 – 2032
8.3.5.2 UK
8.3.5.2.1 Physical Identity and Access Management Market Size & Forecast, By Product, 2021 – 2032
8.3.5.2.2 Physical Identity and Access Management Market Size & Forecast, By Application, 2021 – 2032
8.3.5.2.3 Physical Identity and Access Management Market Size & Forecast, By Offering, 2021 – 2032
8.3.5.3 France
8.3.5.3.1 Physical Identity and Access Management Market Size & Forecast, By Product, 2021 – 2032
8.3.5.3.2 Physical Identity and Access Management Market Size & Forecast, By Application, 2021 – 2032
8.3.5.3.3 Physical Identity and Access Management Market Size & Forecast, By Offering, 2021 – 2032
8.3.5.4 Italy
8.3.5.4.1 Physical Identity and Access Management Market Size & Forecast, By Product, 2021 – 2032
8.3.5.4.2 Physical Identity and Access Management Market Size & Forecast, By Application, 2021 – 2032
8.3.5.4.3 Physical Identity and Access Management Market Size & Forecast, By Offering, 2021 – 2032
8.3.5.5 Spain
8.3.5.5.1 Physical Identity and Access Management Market Size & Forecast, By Product, 2021 – 2032
8.3.5.5.2 Physical Identity and Access Management Market Size & Forecast, By Application, 2021 – 2032
8.3.5.5.3 Physical Identity and Access Management Market Size & Forecast, By Offering, 2021 – 2032
8.3.5.6 Russia
8.3.5.6.1 Physical Identity and Access Management Market Size & Forecast, By Product, 2021 – 2032
8.3.5.6.2 Physical Identity and Access Management Market Size & Forecast, By Application, 2021 – 2032
8.3.5.6.3 Physical Identity and Access Management Market Size & Forecast, By Offering, 2021 – 2032
8.3.5.7 Poland
8.3.5.7.1 Physical Identity and Access Management Market Size & Forecast, By Product, 2021 – 2032
8.3.5.7.2 Physical Identity and Access Management Market Size & Forecast, By Application, 2021 – 2032
8.3.5.7.3 Physical Identity and Access Management Market Size & Forecast, By Offering, 2021 – 2032
8.3.5.8 Rest of Europe
8.3.5.8.1 Physical Identity and Access Management Market Size & Forecast, By Product, 2021 – 2032
8.3.5.8.2 Physical Identity and Access Management Market Size & Forecast, By Application, 2021 – 2032
8.3.5.8.3 Physical Identity and Access Management Market Size & Forecast, By Offering, 2021 – 2032
8.4 Asia-Pacific
8.4.1 Key Trends
8.4.2 Physical Identity and Access Management Market Size & Forecast, By Product, 2021 – 2032
8.4.3 Physical Identity and Access Management Market Size & Forecast, By Application, 2021 – 2032
8.4.4 Physical Identity and Access Management Market Size & Forecast, By Offering, 2021 – 2032
8.4.5 Physical Identity and Access Management Market Size & Forecast, By Country, 2021 – 2032
8.4.5.1 China
8.4.5.1.1 Physical Identity and Access Management Market Size & Forecast, By Product, 2021 – 2032
8.4.5.1.2 Physical Identity and Access Management Market Size & Forecast, By Application, 2021 – 2032
8.4.5.1.3 Physical Identity and Access Management Market Size & Forecast, By Offering, 2021 – 2032
8.4.5.2 India
8.4.5.2.1 Physical Identity and Access Management Market Size & Forecast, By Product, 2021 – 2032
8.4.5.2.2 Physical Identity and Access Management Market Size & Forecast, By Application, 2021 – 2032
8.4.5.2.3 Physical Identity and Access Management Market Size & Forecast, By Offering, 2021 – 2032
8.4.5.3 Japan
8.4.5.3.1 Physical Identity and Access Management Market Size & Forecast, By Product, 2021 – 2032
8.4.5.3.2 Physical Identity and Access Management Market Size & Forecast, By Application, 2021 – 2032
8.4.5.3.3 Physical Identity and Access Management Market Size & Forecast, By Offering, 2021 – 2032
8.4.5.4 South Korea
8.4.5.4.1 Physical Identity and Access Management Market Size & Forecast, By Product, 2021 – 2032
8.4.5.4.2 Physical Identity and Access Management Market Size & Forecast, By Application, 2021 – 2032
8.4.5.4.3 Physical Identity and Access Management Market Size & Forecast, By Offering, 2021 – 2032
8.4.5.5 Australia
8.4.5.5.1 Physical Identity and Access Management Market Size & Forecast, By Product, 2021 – 2032
8.4.5.5.2 Physical Identity and Access Management Market Size & Forecast, By Application, 2021 – 2032
8.4.5.5.3 Physical Identity and Access Management Market Size & Forecast, By Offering, 2021 – 2032
8.4.5.6 ASEAN Countries
8.4.5.6.1 Physical Identity and Access Management Market Size & Forecast, By Product, 2021 – 2032
8.4.5.6.2 Physical Identity and Access Management Market Size & Forecast, By Application, 2021 – 2032
8.4.5.6.3 Physical Identity and Access Management Market Size & Forecast, By Offering, 2021 – 2032
8.4.5.7 Rest of Asia-Pacific
8.4.5.7.1 Physical Identity and Access Management Market Size & Forecast, By Product, 2021 – 2032
8.4.5.7.2 Physical Identity and Access Management Market Size & Forecast, By Application, 2021 – 2032
8.4.5.7.3 Physical Identity and Access Management Market Size & Forecast, By Offering, 2021 – 2032
8.5 Latin America
8.5.1 Key Trends
8.5.2 Physical Identity and Access Management Market Size & Forecast, By Product, 2021 – 2032
8.5.3 Physical Identity and Access Management Market Size & Forecast, By Application, 2021 – 2032
8.5.4 Physical Identity and Access Management Market Size & Forecast, By Offering, 2021 – 2032
8.5.5 Physical Identity and Access Management Market Size & Forecast, By Country, 2021 – 2032
8.5.5.1 Brazil
8.5.5.1.1 Physical Identity and Access Management Market Size & Forecast, By Product, 2021 – 2032
8.5.5.1.2 Physical Identity and Access Management Market Size & Forecast, By Application, 2021 – 2032
8.5.5.1.3 Physical Identity and Access Management Market Size & Forecast, By Offering, 2021 – 2032
8.5.5.2 Argentina
8.5.5.2.1 Physical Identity and Access Management Market Size & Forecast, By Product, 2021 – 2032
8.5.5.2.2 Physical Identity and Access Management Market Size & Forecast, By Application, 2021 – 2032
8.5.5.2.3 Physical Identity and Access Management Market Size & Forecast, By Offering, 2021 – 2032
8.5.5.3 Mexico
8.5.5.3.1 Physical Identity and Access Management Market Size & Forecast, By Product, 2021 – 2032
8.5.5.3.2 Physical Identity and Access Management Market Size & Forecast, By Application, 2021 – 2032
8.5.5.3.3 Physical Identity and Access Management Market Size & Forecast, By Offering, 2021 – 2032
8.5.5.4 Colombia
8.5.5.4.1 Physical Identity and Access Management Market Size & Forecast, By Product, 2021 – 2032
8.5.5.4.2 Physical Identity and Access Management Market Size & Forecast, By Application, 2021 – 2032
8.5.5.4.3 Physical Identity and Access Management Market Size & Forecast, By Offering, 2021 – 2032
8.5.5.5 Rest of Latin America
8.5.5.5.1 Physical Identity and Access Management Market Size & Forecast, By Product, 2021 – 2032
8.5.5.5.2 Physical Identity and Access Management Market Size & Forecast, By Application, 2021 – 2032
8.5.5.5.3 Physical Identity and Access Management Market Size & Forecast, By Offering, 2021 – 2032
8.6 Middle East & Africa
8.6.1 Key Trends
8.6.2 Physical Identity and Access Management Market Size & Forecast, By Product, 2021 – 2032
8.6.3 Physical Identity and Access Management Market Size & Forecast, By Application, 2021 – 2032
8.6.4 Physical Identity and Access Management Market Size & Forecast, By Offering, 2021 – 2032
8.6.5 Physical Identity and Access Management Market Size & Forecast, By Country, 2021 – 2032
8.6.5.1 UAE
8.6.5.1.1 Physical Identity and Access Management Market Size & Forecast, By Product, 2021 – 2032
8.6.5.1.2 Physical Identity and Access Management Market Size & Forecast, By Application, 2021 – 2032
8.6.5.1.3 Physical Identity and Access Management Market Size & Forecast, By Offering, 2021 – 2032
8.6.5.2 Saudi Arabia
8.6.5.2.1 Physical Identity and Access Management Market Size & Forecast, By Product, 2021 – 2032
8.6.5.2.2 Physical Identity and Access Management Market Size & Forecast, By Application, 2021 – 2032
8.6.5.2.3 Physical Identity and Access Management Market Size & Forecast, By Offering, 2021 – 2032
8.6.5.3 Qatar
8.6.5.3.1 Physical Identity and Access Management Market Size & Forecast, By Product, 2021 – 2032
8.6.5.3.2 Physical Identity and Access Management Market Size & Forecast, By Application, 2021 – 2032
8.6.5.3.3 Physical Identity and Access Management Market Size & Forecast, By Offering, 2021 – 2032
8.6.5.4 Egypt
8.6.5.4.1 Physical Identity and Access Management Market Size & Forecast, By Product, 2021 – 2032
8.6.5.4.2 Physical Identity and Access Management Market Size & Forecast, By Application, 2021 – 2032
8.6.5.4.3 Physical Identity and Access Management Market Size & Forecast, By Offering, 2021 – 2032
8.6.5.5 South Africa
8.6.5.5.1 Physical Identity and Access Management Market Size & Forecast, By Product, 2021 – 2032
8.6.5.5.2 Physical Identity and Access Management Market Size & Forecast, By Application, 2021 – 2032
8.6.5.5.3 Physical Identity and Access Management Market Size & Forecast, By Offering, 2021 – 2032
8.6.5.6 Rest of Middle East & Africa
8.6.5.6.1 Physical Identity and Access Management Market Size & Forecast, By Product, 2021 – 2032
8.6.5.6.2 Physical Identity and Access Management Market Size & Forecast, By Application, 2021 – 2032
8.6.5.6.3 Physical Identity and Access Management Market Size & Forecast, By Offering, 2021 – 2032
9. Competitive Landscape
9.1 Key Players' Positioning
9.2 Competitive Developments
9.2.1 Key Strategies Adopted (%), By Key Players, 2024
9.2.2 Year-Wise Strategies & Development, 2021 – 2025
9.2.3 Number Of Strategies Adopted By Key Players, 2024
9.3 Market Share Analysis, 2024
9.4 Product/Service & Application Benchmarking
9.4.1 Product/Service Specifications & Features By Key Players
9.4.2 Product/Service Heatmap By Key Players
9.4.3 Application Heatmap By Key Players
9.5 Industry Start-Up & Innovation Landscape
9.6 Key Company Profiles
9.6.1 HID Global Corporation
9.6.1.1 Company Overview & Snapshot
9.6.1.2 Product/Service Portfolio
9.6.1.3 Key Company Financials
9.6.1.4 SWOT Analysis
9.6.2 Alert Enterprise
9.6.3 IBM Corporation
9.6.4 Nexus Group
9.6.5 Avatier
9.6.6 Access Security Corporation
9.6.7 WALLIX
9.6.8 Identiv, Inc.
9.6.9 alfrednet s.r.l.
9.6.10 E&M Technologies, Inc.
9.6.11 Quantum Secure
9.6.12 AMAG Technology
9.6.13 LenelS2
9.6.14 Brivo
9.6.15 Kastle Systems
9.6.16 Johnson Controls
9.6.17 Honeywell
9.6.18 IDCUBE
9.6.19 Micro Focus
9.6.20 Okta
10. Analyst Recommendations
10.1 SNS Insider Opportunity Map
10.2 Industry Low-Hanging Fruit Assessment
10.3 Market Entry & Growth Strategy
10.4 Analyst Viewpoint & Suggestions On Market Growth
11. Assumptions
12. Disclaimer
13. Appendix
13.1 List Of Tables
13.2 List Of Figures
Key Segments:
By Offering
-
-
Software
-
Services
-
By Product
-
-
Backend Database Solutions
-
Credential Management
-
Visitor Management
-
By Application
-
-
BFSI
-
Defense & Security
-
Airports
-
IT & Telecom
-
Government & Public Sector
-
Industrial
-
Others
-
Request for Segment Customization as per your Business Requirement: Segment Customization Request
Regional Coverage:
North America
-
US
-
Canada
-
Mexico
Europe
-
Eastern Europe
-
Poland
-
Romania
-
Hungary
-
Turkey
-
Rest of Eastern Europe
-
-
Western Europe
-
Germany
-
France
-
UK
-
Italy
-
Spain
-
Netherlands
-
Switzerland
-
Austria
-
Rest of Western Europe
-
Asia Pacific
-
China
-
India
-
Japan
-
South Korea
-
Vietnam
-
Singapore
-
Australia
-
Rest of Asia Pacific
Middle East & Africa
-
Middle East
-
UAE
-
Egypt
-
Saudi Arabia
-
Qatar
-
Rest of Middle East
-
-
Africa
-
Nigeria
-
South Africa
-
Rest of Africa
-
Latin America
-
Brazil
-
Argentina
-
Colombia
-
Rest of Latin America
Request for Country Level Research Report: Country Level Customization Request
Available Customization
With the given market data, SNS Insider offers customization as per the company’s specific needs. The following customization options are available for the report:
-
Detailed Volume Analysis
-
Criss-Cross segment analysis (e.g. Product X Application)
-
Competitive Product Benchmarking
-
Geographic Analysis
-
Additional countries in any of the regions
-
Customized Data Representation
-
Detailed analysis and profiling of additional market players
An accurate research report requires proper strategizing as well as implementation. There are multiple factors involved in the completion of good and accurate research report and selecting the best methodology to compete the research is the toughest part. Since the research reports we provide play a crucial role in any company’s decision-making process, therefore we at SNS Insider always believe that we should choose the best method which gives us results closer to reality. This allows us to reach at a stage wherein we can provide our clients best and accurate investment to output ratio.
Each report that we prepare takes a timeframe of 350-400 business hours for production. Starting from the selection of titles through a couple of in-depth brain storming session to the final QC process before uploading our titles on our website we dedicate around 350 working hours. The titles are selected based on their current market cap and the foreseen CAGR and growth.
The 5 steps process:
Step 1: Secondary Research:
Secondary Research or Desk Research is as the name suggests is a research process wherein, we collect data through the readily available information. In this process we use various paid and unpaid databases which our team has access to and gather data through the same. This includes examining of listed companies’ annual reports, Journals, SEC filling etc. Apart from this our team has access to various associations across the globe across different industries. Lastly, we have exchange relationships with various university as well as individual libraries.

Step 2: Primary Research
When we talk about primary research, it is a type of study in which the researchers collect relevant data samples directly, rather than relying on previously collected data. This type of research is focused on gaining content specific facts that can be sued to solve specific problems. Since the collected data is fresh and first hand therefore it makes the study more accurate and genuine.
We at SNS Insider have divided Primary Research into 2 parts.
Part 1 wherein we interview the KOLs of major players as well as the upcoming ones across various geographic regions. This allows us to have their view over the market scenario and acts as an important tool to come closer to the accurate market numbers. As many as 45 paid and unpaid primary interviews are taken from both the demand and supply side of the industry to make sure we land at an accurate judgement and analysis of the market.
This step involves the triangulation of data wherein our team analyses the interview transcripts, online survey responses and observation of on filed participants. The below mentioned chart should give a better understanding of the part 1 of the primary interview.

Part 2: In this part of primary research the data collected via secondary research and the part 1 of the primary research is validated with the interviews from individual consultants and subject matter experts.
Consultants are those set of people who have at least 12 years of experience and expertise within the industry whereas Subject Matter Experts are those with at least 15 years of experience behind their back within the same space. The data with the help of two main processes i.e., FGDs (Focused Group Discussions) and IDs (Individual Discussions). This gives us a 3rd party nonbiased primary view of the market scenario making it a more dependable one while collation of the data pointers.
Step 3: Data Bank Validation
Once all the information is collected via primary and secondary sources, we run that information for data validation. At our intelligence centre our research heads track a lot of information related to the market which includes the quarterly reports, the daily stock prices, and other relevant information. Our data bank server gets updated every fortnight and that is how the information which we collected using our primary and secondary information is revalidated in real time.

Step 4: QA/QC Process
After all the data collection and validation our team does a final level of quality check and quality assurance to get rid of any unwanted or undesired mistakes. This might include but not limited to getting rid of the any typos, duplication of numbers or missing of any important information. The people involved in this process include technical content writers, research heads and graphics people. Once this process is completed the title gets uploader on our platform for our clients to read it.
Step 5: Final QC/QA Process:
This is the last process and comes when the client has ordered the study. In this process a final QA/QC is done before the study is emailed to the client. Since we believe in giving our clients a good experience of our research studies, therefore, to make sure that we do not lack at our end in any way humanly possible we do a final round of quality check and then dispatch the study to the client.