Smartphone Market Report Scope & Overview:

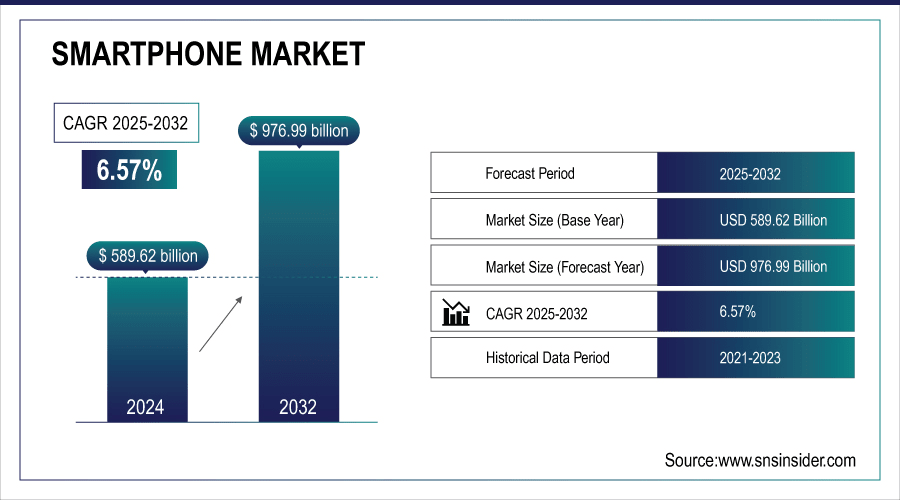
The Smartphone Market size was valued at USD 589.62 Billion in 2024 and is projected to reach USD 976.99 Billion by 2032, growing at a CAGR of 6.57% during 2025-2032.

The global market provides detailed smartphone market analysis by market size, segment, distribution channel, operating system, form-factor, technology transition, region and in-detailed analysis of drivers, restraints and opportunities impacting growth. A smartphone industry suddenly clicks into gear as a result of synergies between innovation, ubiquitous connectivity and low cost. The global smartphone market continues to grow its dominance through developed and developing nations alike, supported by rollout of 5G networks, integration of digital services and varying consumer preferences.

  • Around 68% of smartphone users globally now rely on their devices for mobile payments, banking, and e-commerce transactions.

  • Over 40% of users pair their smartphones with wearable devices or smart home gadgets, turning their phones into central hubs for digital ecosystems.
Smartphone-Market

To Get More Information On Smartphone Market - Request Free Sample Report

Smartphone Market Trends

  • Global 5G rollout and demand for high-speed networks are accelerating smartphone upgrades across both urban and rural markets.

  • Brands such as Xiaomi, Realme, and Samsung are making 5G accessible, expanding adoption in emerging economies.

  • Increased operator investments are boosting user migration from 4G to 5G-enabled devices.

  • Innovation in foldable and flip designs is creating premium growth opportunities for OEMs.

  • Samsung, Huawei, and Motorola are leading foldable developments with improved durability and design efficiency.

  • Consumer curiosity, multitasking needs, and falling production costs are set to make foldables a mainstream segment.

Smartphone Market Report Highlights

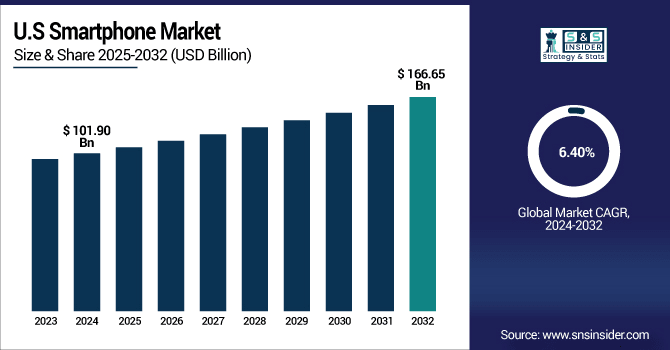
The U.S. Smartphone Market size was valued at USD 101.90 Billion in 2024 and is projected to reach USD 166.65 Billion by 2032, growing at a CAGR of 6.40% during 2025-2032. The U.S. market include premium device adoption, a robust upgrade cycle, and rapid 5G rollout. The cloud is baby Lowe's on that way when backed by advanced high-tech offerings powered by AI and no competitor has consumer fictionalized such as apple has and hence it will always have ordered revenue stream. Another reason for continued growth is the increasing demand for ecosystem-connected devices such as wearables, tablets and IoT-enabled smartphones. Driven by innovation and ecosystem integration, the outlook for the U.S. smartphone industry shows continued growth through 2032.
Smartphone-Market-Us

Smartphone market trends highlight rapid spread of 5G, uptick in foldable device adoption, AI-based features enablement and amplified consumer dependency on connected ecosystems.

Smartphone Market Segment Analysis

  • By Operating System, Android held the largest share of around 71.20% in 2024, whereas iOS is projected to be the fastest-growing segment with a CAGR of 7.16%.

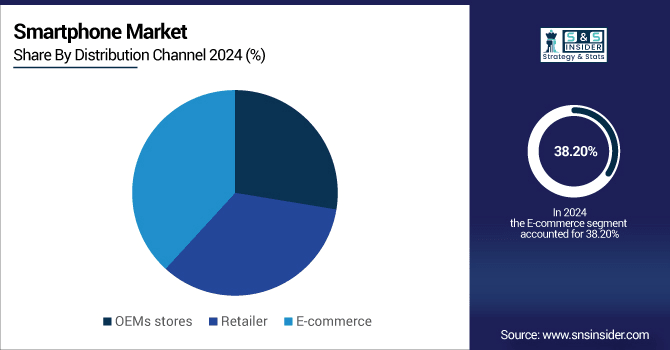
  • By Distribution Channel, the E-commerce segment dominated the market with approximately 38.20% share in 2024, and is expected to register the highest growth with a CAGR of 6.74%.

  • By Technology, 5G accounted for the leading share of nearly 45.10% in 2024, and is anticipated to be the fastest-growing segment with a CAGR of 7.09%.

  • By Form-Factor, the Bar segment led the market with about 90.10% share in 2024, while the Foldable/Flip segment is forecasted to grow the fastest at a CAGR of 8.40%.

By Distribution Channel, E-commerce Dominate and Shows Rapid Growth

The E-commerce segment achieved the largest revenue share of approximately 38.20% in 2024 within the Smartphone Market, attributed to the consumer inclination towards online shopping, huge discounts, and the presence of products across platforms. Its strength is also reinforced by convenience and financing. With competitive pricing, flash sales and hassle-free return policies, Amazon-style players have changed the way smartphones are being sold making online shopping channel of choice. E-commerce segment is also projected to witness higher growth over the upcoming years, registering around 6.74% CAGR during the period of 2024–2032 owing to increasing digital adoption, rising requires for online retail and augmented trust in secure payment systems amongst merchants and customers.
Smartphone-Market-By-Distribution-Channel

By Operating System, Android Leads Market While iOS Registers Fastest Growth

In 2024, the Android segment held the largest revenue share of approximately 71.20% within the Smartphone Market, owing to its affordability, better availability of devices, and extensive OEM adoption across all regions. Even the ecosystem’s flexibility and catering for different price segments have made Android a global market leader. This dominance has been cemented by players such as Samsung Electronics, which owns a wide Android portfolio continuing to grow across premium to budget segments. Driven by high-end consumer demand, unprecedented brand loyalty, and a well-integrated ecosystem of Apple products, including wearables and services, iOS segment is projected to record the highest growth rate of over 7.16% CAGR during 2024–2032.

By Technology, 5G Lead and Registers Fastest Growth

The 5G segment accounted for the maximum Smartphone Market share of around 45.10% in 2024, aided by rapid 5G network deployments globally and falling prices of 5G-compatible smartphones across the price range. Adoption has also been fueled by consumer demand for high speed, low latency and better application performance. Brands such as Xiaomi are including more 5G smartphones in the budget category, enhancing the penetration in the emerging markets. The 5G segment, on the other hand, will be growing with a maximum CAGR at an approximate rate of 7.09% during the period of 2024–2032 as new telecom investments, integration of AI technology, and demand for high-performance devices used in AR/VR applications & cloud gaming will spur the rate of growth.  

By Form-Factor, Bar Segment Lead While Foldable/Flip Grows the Fastest

Bar segment led the Smartphone Market, contributing around 90.10% revenue share in the year 2024, owing to its convenience and low price, and dominance in both premium and entry-level smartphones. The global standard due to its long successful design, cost effectiveness, and reliability. Enter Powerhouses such as Oppo with an expanding Bar-Style Smartphone on offer in all segments of price spectrum, cementing its dominion. The Foldable/Flip segment is projected to grow at the fastest CAGR of 8.40% during 2024–2032, as consumers increasingly look for modern designs, multitasking functionality, and high-end positioning/competing with lower-end (suggests decreasing costs) relatively more durable foldable screens within the same price range.

Asia-pacific Smartphone Market Insights

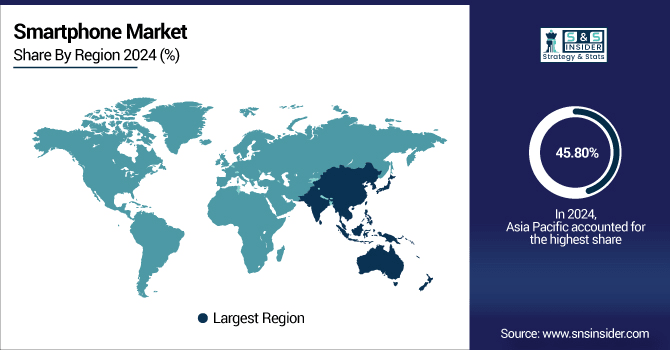
Asia Pacific occupied the Smartphone Market of approximately 45.80% revenue share in 2024 due to its large population, high demand in countries such as China and India, and widespread availability of inexpensive smartphones. The continuing internet penetration growth and the government-dominated digitization measures fortified its position further as the global leader. The Asia Pacific is also estimated to grow the fastest CAGR of 7.01% during the forecast period of 2024–2032 due to an increase in disposable incomes, increasing 5G penetration, and the presence of some of the leading smartphone manufacturers includes Xiaomi, Oppo, and Samsung.
Smartphone-Market-By-Region

Get Customized Report as Per Your Business Requirement - Enquiry Now

North America Smartphone Market Insights

The North America smartphone market is insulated from fall outs of high consumer expenditure, quick helping out of 5G infrastructural deployment and skyline aspirations for the premium flagship devices. Apple maintains its lead with tight ecosystem integration, while adding competitive flair with Samsung and Google. The increasing implementation of AI-based functions along with connected gadgets and smartphones with the Internet in one line with the factor pushes the steady increase of this region which is one of the best technologically sophisticated markets in the global.

Europe Smartphone Market Insights

The European smartphone market is driven by high premium demand, a high 5G penetration rate and increased environmental awareness in phone manufacture. Performance, security, and brand reputation are more important than price to consumers, no surprise that Apple and Samsung are the top-selling brands. On the other hand, best-price offers from new brands such as Xiaomi are crystallizing successfully, boosting fair competition in Western and Eastern Europe with steady market growth results driven by these dynamics.

Latin America (LATAM) and Middle East & Africa (MEA) Smartphone Market Insights

The Middle East & Africa smartphone market is growing on the back of increasing 5G adoption in countries, such as UAE, Saudi Arabia, and Qatar, and solid affordability-driven demand in South Africa and others. Brazil and Argentina drive growth across Latin America, with more mobile internet connections and mid-tier devices followed by mass mobile internet adoption and growing digital inclusivity.

Smartphone Market Growth Drivers:

  • Expanding Global 5G Network Coverage and Affordable Device Availability is Driving Massive Growth in the Smartphone Market

Global 5G readiness is a major factor for rapidly growing smartphone adoption since consumers crave fast networks for streaming, gaming, and other intensive data uses. While manufacturers such as Xiaomi, Realme and Samsung are launching affordable 5G smartphones, it is also pushing rural nations to avail the next gen connectivity. With telecom operators expediting infrastructure investments and a growing number of users reaping the benefits of 5G hands-on through switched 5G-enabled devices, customers are moving up the telecom ladder from 4G. The confluence of network proliferation and declining smartphone costs is building incredible market momentum and creating an experience global seamless digital augmentation.

  • 5G reduces network latency by up to 70% compared with 4G, allowing seamless AR/VR experiences and real-time online gaming.

  • Over 50% of consumers using 5G-enabled devices report smoother video streaming in 4K or higher resolutions.

Smartphone Market Restraints:

  • Rising Average Selling Prices of Premium Smartphones Create Affordability Barriers in Emerging and Price-Sensitive Markets Globally

The average selling price (ASP) of premium smartphones continues to rise, driven mainly by flagship devices from both the Apple and Samsung stable, making many of the handsets just out of reach for the so-called emerging markets. As we know, consumer interest is aroused through innovation but elements such as foldable displays, multi-camera setups, and leading-edge processors escalate the costs. It's the pricing issue that keeps this at bay as we noticed this segment usually fall in low income class. The affordability barrier is a limiting factor and still hinders overall market growth, particularly in those regions in which average disposable incomes are lower as mid-range models try to fill the gap in between.

Smartphone Market Opportunities:

  • Growing Demand for Foldable Smartphones and Innovative Form-Factors Presents a High-Value Opportunity for Market Leaders Globally

Smartphones with foldable and flip phones are opening up new curves of growth with touch of innovation with premium design. Severe foldable models are being driven by important OEMs such as Samsung, Huawei, and Motorola, with the stop charge and sturdiness being improved. Early uptake is being spurred by consumer curiosity and a need for unique devices that work well when multitasking. Foldables are expected to become mainstream as the production efficiencies improve and more brands jump into the segment. These trends create rewarding opportunities for manufacturers to offer differentiated products and gain share in higher price points.

  • Around 35% of premium smartphone users in 2024 have tried foldable or flip devices, driven by curiosity and multitasking capabilities.

  • 80% of new foldable models feature ultra-thin glass or flexible polymers, improving screen resilience while maintaining sleek design.

Smartphone Market Competitive Landscape:

Apple is the world's premium smartphone leader, and a specialist in innovation, performance, and ecosystem. Its iPhone 15 Pro, boasting an efficient and powerful A17 Bionic chip, DSLR like capabilities on its advanced camera system, and a seriously sleek design, all of which is to say, everything that you would want in a smartphone. Then there's the iPhone SE (2024) which, whether in its predecessor's image or a new one, we expect to fit the bill of performance in a compact size and (at least halfway) affordable. From premium to budget-friendly devices, Apple now has a device for everyone, maintaining its title for the leaders in innovation, experience and brand loyalty globally.

  • In September 2024, Apple's iPhone 16 series, marked a significant advancement in AI integration and camera technology, reinforcing Apple's position in the premium smartphone segment. The devices are built for Apple Intelligence, featuring the A18 chip, Camera Control for enhanced photography, and AI-driven functionalities such as real-time object recognition and contextual assistance.

Samsung is a dominant player in the global smart phone market alongside being recognized for development and wide range of devices. The Galaxy S24 Ultra packs the latest cameras, a giant AMOLED screen, and top speeds for premium users, and the foldable Galaxy Z Fold 6 mixes smartphone and tablet functionality with a focus on multitasking. With Samsung also maintaining its global leadership and prowess with tech in both the high-end (Z-fold) segment and mainstream (Galaxy Flip) segment, the launch of both precisely addresses strategy.

  • In January 2024, Samsung launched the Samsung Galaxy S24 series, introduced significant advancements in AI integration and design. The Galaxy S24 Ultra, in particular, became the first Galaxy phone to feature a titanium frame, enhancing durability and providing a more comfortable grip. Additionally, the series incorporated Galaxy AI, offering features such as real-time translation, AI-powered photo editing, and intelligent message composition, solidifying Samsung's leadership in the premium smartphone market.  

Xiaomi would be known globally for providing powerful smartphones at an affordable price. Xiaomi 14 Pro flagship trim boasts of a cutting-edge processor, high-end camera system, and premium design, while the Redmi Note 13 Pro packs in brilliant features at a mid-range price point along with long-lasting battery and AI-based photo-taking abilities. Another detail of Xiaomi's business plan is to strike a balance between the affordable products and the innovation, this is what will advance it to higher and higher use rates in Asia, Europe, or Latin America, increasing the number of tech-savvy consumers who no longer have money.

  • In October 2024, Xiaomi launched the Xiaomi 15 series in China, and later introduced globally at MWC 2025 in Barcelona. The series includes models such as the Xiaomi 15, Xiaomi 15 Pro, and Xiaomi 15 Ultra, all powered by the Snapdragon 8 Elite chipset and featuring Leica-enhanced camera systems. These advancements in camera technology and the introduction of AI-driven features have bolstered Xiaomi's presence in emerging markets, catering to the growing demand for high-performance smartphones.

Oppo is an international smartphone brand featuring stylish designs and camera innovation. Launching two flagship-ready devices for different audiences, the Oppo Find X7 Pro gets the best of premium design, camera tech and fast charging that high end users crave for and the Oppo Reno 12 combines the same for mid-range consumers with a quicker processor and striking looks. With an eye toward the youth and professionals, Oppo continues to strengthen its sales prowess within Asia, Europe and the Middle East, with camera-centric devices and technological innovation.

  • In January 2024, Oppo unveiled the Oppo Find X7 Pro in China. This launch introduced the smartphone's innovative dual-periscope camera system and high-refresh-rate display, positioning it as a premium offering in Oppo's lineup. The device was subsequently made available in various international markets, including India, by the end of 2024.

Vivo, a cutting-edge smartphone brand with a huge market foothold in Asia is continuously making its presence felt on a global basis. In detail, Vivo X100 Pro provides advanced photography, AMOLED display, and also rapid charging for a premium audience while, Vivo V30 qualifies the mid-tier user, with gaming-oriented performance, and also AI-based digital photographers. With a combination of latest technology and low pricing the company addresses Youth and professional segments at the same time, thereby driving heart share, mind share, and wallet share in the emerging markets, while evolving as very competitive global smartphone brand.

  • In March 2024, Vivo launched the Vivo V30 series, targeting the mid-range smartphone segment, emphasizing gaming performance and AI-enhanced photography. The V30 features a 6.78-inch 1.5K AMOLED display with 120Hz refresh rate, Snapdragon 7 Gen 3 processor, up to 12GB RAM, and a 5000mAh battery with 80W fast charging. Its triple 50MP rear camera and 50MP front camera enable high-quality imaging, while the slim 7.45mm design combines style and functionality.

Smartphone Market Key Players

Some of the Smartphone Market Companies are:

  • Apple Inc.

  • Samsung Electronics Co., Ltd.

  • Xiaomi Corporation

  • OPPO

  • vivo Communication Technology Co., Ltd.

  • Huawei Technologies Co., Ltd.

  • Lenovo Group Limited

  • Realme

  • OnePlus Technology Co., Ltd.

  • Transsion Holdings

  • Google LLC

  • Sony Corporation

  • LG Electronics Inc.

  • ZTE Corporation

  • Honor Device Co., Ltd.

  • Nokia

  • Micromax Informatics Ltd.

  • Lava International Ltd.

  • ASUSTeK Computer Inc.

  • Panasonic Corporation

Smartphone Market Report Scope:

Report Attributes Details
Market Size in 2024 USD 589.62 Billion
Market Size by 2032 USD 976.99 Billon
CAGR CAGR of 6.57% From 2025 to 2032
Base Year 2024
Forecast Period 2025-2032
Historical Data 2021-2023
Report Scope & Coverage Market Size, Segments Analysis, Competitive  Landscape, Regional Analysis, DROC & SWOT Analysis, Forecast Outlook
Key Segments • By Operating System (Android, iOS, Windows and Others)
• By Distribution Channel (OEMs stores, Retailer and E-commerce)
• By Technology (5G, 4G/LTE and 3G and below)
• By Form-Factor (Bar, Foldable/Flip and Rugged/Industrial)
Regional Analysis/Coverage North America (US, Canada, Mexico), Europe (Germany, France, UK, Italy, Spain, Poland, Turkey, Rest of Europe), Asia Pacific (China, India, Japan, South Korea, Singapore, Australia, Taiwan,  Rest of Asia Pacific), Middle East & Africa (UAE, Saudi Arabia, Qatar, South Africa, Rest of Middle East & Africa), Latin America (Brazil, Argentina, Rest of Latin America)
Company Profiles Apple Inc., Samsung Electronics Co., Ltd., Xiaomi Corporation, OPPO, vivo Communication Technology Co., Ltd., Huawei Technologies Co., Ltd., Lenovo Group Limited, Realme, OnePlus Technology Co., Ltd., Transsion Holdings, Google LLC, Sony Corporation, LG Electronics Inc., ZTE Corporation, Honor Device Co., Ltd., Nokia, Micromax Informatics Ltd., Lava International Ltd., ASUSTeK Computer Inc. and Panasonic Corporation.

Table Of Contents

1. Introduction

1.1 Market Definition & Scope

 1.2 Research Assumptions & Abbreviations

 1.3 Research Methodology

2. Executive Summary

2.1 Market Snapshot

 2.2 Market Absolute $ Opportunity Assessment & Y-o-Y Analysis, 2021–2032

 2.3 Market Size & Forecast, By Segmentation, 2021–2032

  2.3.1 Market Size By Operating System

  2.3.2 Market Size By Distribution Channel

         2.3.3 Market Size By Technology

         2.3.4 Market Size By Form-Factor

 2.4 Market Share & Bps Analysis By Region, 2024

 2.5 Industry Growth Scenarios – Conservative, Likely & Optimistic

 2.6 Industry CxO’s Perspective

3. Market Overview

3.1 Market Dynamics

  3.1.1 Drivers

  3.1.2 Restraints

  3.1.3 Opportunities

  3.1.4 Key Market Trends

 3.2 Industry PESTLE Analysis

 3.3 Key Industry Forces (Porter’s) Impacting Market Growth

 3.4 Industry Supply Chain Analysis

  3.4.1 Raw Material Suppliers

  3.4.2 Manufacturers

  3.4.3 Distributors/Suppliers

  3.4.4 Customers/End-Users

 3.5 Industry Life Cycle Assessment

 3.6 Parent Market Overview

 3.7 Market Risk Assessment

4. Statistical Insights & Trends Reporting

4.1 Average Data Consumption per Smartphone

4.1.1 Monthly average data usage per smartphone (GB) across regions

4.1.2 Comparative data consumption: 4G vs. 5G users (%)

4.1.3 Forecasted growth in per-user data traffic (2024–2032, CAGR %)

4.2 Shipment & Sales Statistics

4.2.1 Global smartphone shipments (Million units per year, 2020–2032)

4.2.2 Regional shipment distribution (% share of APAC, North America, Europe, etc.)

4.2.3 YoY growth rate (%) of shipments in top 5 countries

4.3 Technology Transition Trends

4.3.1 Share of smartphones by network standard (3G, 4G, 5G) in 2024 vs. 2032

4.3.2 Adoption timeline of 5G-enabled smartphones (penetration %)

4.3.3 Projected share of eSIM-enabled devices (%) by 2032

4.4 Price Band Statistics

4.4.1 Market share by price segment (Entry-level < $200, Mid-range $200–$600, Premium > $600)

4.4.2 Average Selling Price (ASP) trends of smartphones (2018–2032, $ per unit)

4.4.3 Regional variation in ASP (North America vs. Asia Pacific vs. Latin America)

4.5 Consumer Behavior Data

4.5.1 Distribution channel preferences (% share of OEM stores, retailers, e-commerce)

4.5.2 Smartphone replacement cycle (average years before upgrade, by region)

4.5.3 Financing & installment-based purchases (% of total sales in emerging markets)

4.6 Usage & Feature Insights

4.6.1 Average screen size adoption trends (inches, 2018–2032)

4.6.2 Share of smartphones with >50MP camera resolution (%)

4.6.3 Average battery capacity (mAh) shipped by year

4.7 Operating System Share Dynamics

4.7.1 Global market share split: Android vs. iOS vs. others (2024 vs. 2032)

4.7.2 Regional OS preference (e.g., iOS share in North America vs. Android in Asia Pacific)

4.7.3 OS retention rates (% of users upgrading within the same ecosystem)

5. Smartphone Market Segmental Analysis & Forecast, By Operating System, 2021 – 2032, Value (Usd Billion)

5.1 Introduction

 5.2 Android

  5.2.1 Key Trends

  5.2.2 Market Size & Forecast, 2021 – 2032

 5.3 iOS

  5.3.1 Key Trends

  5.3.2 Market Size & Forecast, 2021 – 2032

      5.4 Windows

  5.4.1 Key Trends

  5.4.2 Market Size & Forecast, 2021 – 2032

      5.5 Others

  5.5.1 Key Trends

  5.5.2 Market Size & Forecast, 2021 – 2032

6. Smartphone Market Segmental Analysis & Forecast, By Distribution Channel, 2021 – 2032, Value (Usd Billion)

    6.1 Introduction

 6.2 OEMs stores

  6.2.1 Key Trends

  6.2.2 Market Size & Forecast, 2021 – 2032

 6.3 Retailer

  6.3.1 Key Trends

  6.3.2 Market Size & Forecast, 2021 – 2032

 6.4 E-commerce

  6.4.1 Key Trends

  6.4.2 Market Size & Forecast, 2021 – 2032

7. Smartphone Market Segmental Analysis & Forecast, By Technology, 2021 – 2032, Value (Usd Billion)

    7.1 Introduction

 7.2 5G

  7.2.1 Key Trends

  7.2.2 Market Size & Forecast, 2021 – 2032

 7.3 4G/LTE

  7.3.1 Key Trends

  7.3.2 Market Size & Forecast, 2021 – 2032

    7.4 3G and Below

  7.4.1 Key Trends

  7.4.2 Market Size & Forecast, 2021 – 2032

8. Smartphone Market Segmental Analysis & Forecast, By Form-Factor, 2021 – 2032, Value (Usd Billion)

    8.1 Introduction

 8.2 Bar

  8.2.1 Key Trends

  8.2.2 Market Size & Forecast, 2021 – 2032

 8.3 Foldable/Flip

  8.3.1 Key Trends

  8.3.2 Market Size & Forecast, 2021 – 2032

     8.4 Rugged/Industrial

  8.4.1 Key Trends

  8.4.2 Market Size & Forecast, 2021 – 2032

9. Smartphone Market Segmental Analysis & Forecast By Region, 2021 – 2025, Value (Usd Billion)

9.1 Introduction

9.2 North America

 9.2.1 Key Trends

 9.2.2 Smartphone Market Size & Forecast, By Operating System, 2021 – 2032

 9.2.3 Smartphone Market Size & Forecast, By Distribution Channel, 2021 – 2032

 9.2.4 Smartphone Market Size & Forecast, By Technology, 2021 – 2032

 9.2.5 Smartphone Market Size & Forecast, By Form-Factor, 2021 – 2032

 9.2.6 Smartphone Market Size & Forecast, By Country, 2021 – 2032

  9.2.6.1 USA

   9.2.6.1.1 Smartphone Market Size & Forecast, By Operating System, 2021 – 2032

   9.2.6.1.2 Smartphone Market Size & Forecast, By Distribution Channel, 2021 – 2032

   9.2.6.1.3 Smartphone Market Size & Forecast, By Technology, 2021 – 2032

   9.2.6.1.4 Smartphone Market Size & Forecast, By Form-Factor, 2021 – 2032

  9.2.6.2 Canada

   9.2.6.2.1 Smartphone Market Size & Forecast, By Operating System, 2021 – 2032

   9.2.6.2.2 Smartphone Market Size & Forecast, By Distribution Channel, 2021 – 2032

   9.2.6.2.3 Smartphone Market Size & Forecast, By Technology, 2021 – 2032

   9.2.6.2.4 Smartphone Market Size & Forecast, By Form-Factor, 2021 – 2032

9.3 Europe

 9.3.1 Key Trends

 9.3.2 Smartphone Market Size & Forecast, By Operating System, 2021 – 2032

 9.3.3 Smartphone Market Size & Forecast, By Distribution Channel, 2021 – 2032

 9.3.4 Smartphone Market Size & Forecast, By Technology, 2021 – 2032

 9.3.5 Smartphone Market Size & Forecast, By Form-Factor, 2021 – 2032

 9.3.6 Smartphone Market Size & Forecast, By Country, 2021 – 2032

  9.3.6.1 Germany

   9.3.6.1.1 Smartphone Market Size & Forecast, By Operating System, 2021 – 2032

   9.3.6.1.2 Smartphone Market Size & Forecast, By Distribution Channel, 2021 – 2032

   9.3.6.1.3 Smartphone Market Size & Forecast, By Technology, 2021 – 2032

   9.3.6.1.4 Smartphone Market Size & Forecast, By Form-Factor, 2021 – 2032

  9.3.6.2 UK

   9.3.6.2.1 Smartphone Market Size & Forecast, By Operating System, 2021 – 2032

   9.3.6.2.2 Smartphone Market Size & Forecast, By Distribution Channel, 2021 – 2032

   9.3.6.2.3 Smartphone Market Size & Forecast, By Technology, 2021 – 2032

   9.3.6.2.4 Smartphone Market Size & Forecast, By Form-Factor, 2021 – 2032

  9.3.6.3 France

   9.3.6.3.1 Smartphone Market Size & Forecast, By Operating System, 2021 – 2032

   9.3.6.3.2 Smartphone Market Size & Forecast, By Distribution Channel, 2021 – 2032

   9.3.6.3.3 Smartphone Market Size & Forecast, By Technology, 2021 – 2032

   9.3.6.3.4 Smartphone Market Size & Forecast, By Form-Factor, 2021 – 2032

  9.3.6.4 Italy

   9.3.6.4.1 Smartphone Market Size & Forecast, By Operating System, 2021 – 2032

   9.3.6.4.2 Smartphone Market Size & Forecast, By Distribution Channel, 2021 – 2032

   9.3.6.4.3 Smartphone Market Size & Forecast, By Technology, 2021 – 2032

   9.3.6.4.4 Smartphone Market Size & Forecast, By Form-Factor, 2021 – 2032

  9.3.6.5 Spain

   9.3.6.5.1 Smartphone Market Size & Forecast, By Operating System, 2021 – 2032

   9.3.6.5.2 Smartphone Market Size & Forecast, By Distribution Channel, 2021 – 2032

   9.3.6.5.3 Smartphone Market Size & Forecast, By Technology, 2021 – 2032

   9.3.6.5.4 Smartphone Market Size & Forecast, By Form-Factor, 2021 – 2032

  9.3.6.6 Russia

   9.3.6.6.1 Smartphone Market Size & Forecast, By Operating System, 2021 – 2032

   9.3.6.6.2 Smartphone Market Size & Forecast, By Distribution Channel, 2021 – 2032

   9.3.6.6.3 Smartphone Market Size & Forecast, By Technology, 2021 – 2032

   9.3.6.6.4 Smartphone Market Size & Forecast, By Form-Factor, 2021 – 2032

  9.3.6.7 Poland

   9.3.6.7.1 Smartphone Market Size & Forecast, By Operating System, 2021 – 2032

   9.3.6.7.2 Smartphone Market Size & Forecast, By Distribution Channel, 2021 – 2032

   9.3.6.7.3 Smartphone Market Size & Forecast, By Technology, 2021 – 2032

   9.3.6.7.4 Smartphone Market Size & Forecast, By Form-Factor, 2021 – 2032

  9.3.6.8 Rest of Europe

   9.3.6.8.1 Smartphone Market Size & Forecast, By Operating System, 2021 – 2032

   9.3.6.8.2 Smartphone Market Size & Forecast, By Distribution Channel, 2021 – 2032

   9.3.6.8.3 Smartphone Market Size & Forecast, By Technology, 2021 – 2032

   9.3.6.8.4 Smartphone Market Size & Forecast, By Form-Factor, 2021 – 2032   

9.4 Asia-Pacific

 9.4.1 Key Trends

 9.4.2 Smartphone Market Size & Forecast, By Operating System, 2021 – 2032

 9.4.3 Smartphone Market Size & Forecast, By Distribution Channel, 2021 – 2032

 9.4.4 Smartphone Market Size & Forecast, By Technology, 2021 – 2032

 9.4.5 Smartphone Market Size & Forecast, By Form-Factor, 2021 – 2032

 9.4.6 Smartphone Market Size & Forecast, By Country, 2021 – 2032

  9.4.6.1 China

   9.4.6.1.1 Smartphone Market Size & Forecast, By Operating System, 2021 – 2032

   9.4.6.1.2 Smartphone Market Size & Forecast, By Distribution Channel, 2021 – 2032

   9.4.6.1.3 Smartphone Market Size & Forecast, By Technology, 2021 – 2032

   9.4.6.1.4 Smartphone Market Size & Forecast, By Form-Factor, 2021 – 2032

  9.4.6.2 India

   9.4.6.2.1 Smartphone Market Size & Forecast, By Operating System, 2021 – 2032

   9.4.6.2.2 Smartphone Market Size & Forecast, By Distribution Channel, 2021 – 2032

   9.4.6.2.3 Smartphone Market Size & Forecast, By Technology, 2021 – 2032

   9.4.6.2.4 Smartphone Market Size & Forecast, By Form-Factor, 2021 – 2032

  9.4.6.3 Japan

   9.4.6.3.1 Smartphone Market Size & Forecast, By Operating System, 2021 – 2032

   9.4.6.3.2 Smartphone Market Size & Forecast, By Distribution Channel, 2021 – 2032

   9.4.6.3.3 Smartphone Market Size & Forecast, By Technology, 2021 – 2032

   9.4.6.3.4 Smartphone Market Size & Forecast, By Form-Factor, 2021 – 2032

  9.4.6.4 South Korea

   9.4.6.4.1 Smartphone Market Size & Forecast, By Operating System, 2021 – 2032

   9.4.6.4.2 Smartphone Market Size & Forecast, By Distribution Channel, 2021 – 2032

   9.4.6.4.3 Smartphone Market Size & Forecast, By Technology, 2021 – 2032

   9.4.6.4.4 Smartphone Market Size & Forecast, By Form-Factor, 2021 – 2032

  9.4.6.5 Australia

   9.4.6.5.1 Smartphone Market Size & Forecast, By Operating System, 2021 – 2032

   9.4.6.5.2 Smartphone Market Size & Forecast, By Distribution Channel, 2021 – 2032

   9.4.6.5.3 Smartphone Market Size & Forecast, By Technology, 2021 – 2032

   9.4.6.5.4 Smartphone Market Size & Forecast, By Form-Factor, 2021 – 2032

  9.4.6.6 ASEAN Countries

   9.4.6.6.1 Smartphone Market Size & Forecast, By Operating System, 2021 – 2032

   9.4.6.6.2 Smartphone Market Size & Forecast, By Distribution Channel, 2021 – 2032

   9.4.6.6.3 Smartphone Market Size & Forecast, By Technology, 2021 – 2032

   9.4.6.6.4 Smartphone Market Size & Forecast, By Form-Factor, 2021 – 2032

  9.4.6.7 Rest of Asia-Pacific

   9.4.6.7.1 Smartphone Market Size & Forecast, By Operating System, 2021 – 2032

   9.4.6.7.2 Smartphone Market Size & Forecast, By Distribution Channel, 2021 – 2032

   9.4.6.7.3 Smartphone Market Size & Forecast, By Technology, 2021 – 2032

   9.4.6.7.4 Smartphone Market Size & Forecast, By Form-Factor, 2021 – 2032

9.5 Latin America

 9.5.1 Key Trends

 9.5.2 Smartphone Market Size & Forecast, By Operating System, 2021 – 2032

 9.5.3 Smartphone Market Size & Forecast, By Distribution Channel, 2021 – 2032

 9.5.4 Smartphone Market Size & Forecast, By Technology, 2021 – 2032

 9.5.5 Smartphone Market Size & Forecast, By Form-Factor, 2021 – 2032

 9.5.6 Smartphone Market Size & Forecast, By Country, 2021 – 2032

  9.5.6.1 Brazil

   9.5.6.1.1 Smartphone Market Size & Forecast, By Operating System, 2021 – 2032

   9.5.6.1.2 Smartphone Market Size & Forecast, By Distribution Channel, 2021 – 2032

   9.5.6.1.3 Smartphone Market Size & Forecast, By Technology, 2021 – 2032

   9.5.6.1.4 Smartphone Market Size & Forecast, By Form-Factor, 2021 – 2032

  9.5.6.2 Argentina

   9.5.6.2.1 Smartphone Market Size & Forecast, By Operating System, 2021 – 2032

   9.5.6.2.2 Smartphone Market Size & Forecast, By Distribution Channel, 2021 – 2032

   9.5.6.2.3 Smartphone Market Size & Forecast, By Technology, 2021 – 2032

   9.5.6.2.4 Smartphone Market Size & Forecast, By Form-Factor, 2021 – 2032

  9.5.6.3 Mexico

   9.5.6.3.1 Smartphone Market Size & Forecast, By Operating System, 2021 – 2032

   9.5.6.3.2 Smartphone Market Size & Forecast, By Distribution Channel, 2021 – 2032

   9.5.6.3.3 Smartphone Market Size & Forecast, By Technology, 2021 – 2032

   9.5.6.3.4 Smartphone Market Size & Forecast, By Form-Factor, 2021 – 2032

  9.5.6.4 Colombia

   9.5.6.4.1 Smartphone Market Size & Forecast, By Operating System, 2021 – 2032

   9.5.6.4.2 Smartphone Market Size & Forecast, By Distribution Channel, 2021 – 2032

   9.5.6.4.3 Smartphone Market Size & Forecast, By Technology, 2021 – 2032

   9.5.6.4.4 Smartphone Market Size & Forecast, By Form-Factor, 2021 – 2032

  9.5.6.5 Rest of Latin America

   9.5.6.5.1 Smartphone Market Size & Forecast, By Operating System, 2021 – 2032

   9.5.6.5.2 Smartphone Market Size & Forecast, By Distribution Channel, 2021 – 2032

   9.5.6.5.3 Smartphone Market Size & Forecast, By Technology, 2021 – 2032

   9.5.6.5.4 Smartphone Market Size & Forecast, By Form-Factor, 2021 – 2032

9.6 Middle East & Africa

 9.6.1 Key Trends

 9.6.2 Smartphone Market Size & Forecast, By Operating System, 2021 – 2032

 9.6.3 Smartphone Market Size & Forecast, By Distribution Channel, 2021 – 2032

 9.6.4 Smartphone Market Size & Forecast, By Technology, 2021 – 2032

 9.6.5 Smartphone Market Size & Forecast, By Form-Factor, 2021 – 2032

 9.6.6 Smartphone Market Size & Forecast, By Country, 2021 – 2032

  9.6.6.1 UAE

   9.6.6.1.1 Smartphone Market Size & Forecast, By Operating System, 2021 – 2032

   9.6.6.1.2 Smartphone Market Size & Forecast, By Distribution Channel, 2021 – 2032

   9.6.6.1.3 Smartphone Market Size & Forecast, By Technology, 2021 – 2032

   9.6.6.1.4 Smartphone Market Size & Forecast, By Form-Factor, 2021 – 2032

  9.6.6.2 Saudi Arabia

   9.6.6.2.1 Smartphone Market Size & Forecast, By Operating System, 2021 – 2032

   9.6.6.2.2 Smartphone Market Size & Forecast, By Distribution Channel, 2021 – 2032

   9.6.6.2.3 Smartphone Market Size & Forecast, By Technology, 2021 – 2032

   9.6.6.2.4 Smartphone Market Size & Forecast, By Form-Factor, 2021 – 2032

  9.6.6.3 Qatar

   9.6.6.3.1 Smartphone Market Size & Forecast, By Operating System, 2021 – 2032

   9.6.6.3.2 Smartphone Market Size & Forecast, By Distribution Channel, 2021 – 2032

   9.6.6.3.3 Smartphone Market Size & Forecast, By Technology, 2021 – 2032

   9.6.6.3.4 Smartphone Market Size & Forecast, By Form-Factor, 2021 – 2032

  9.6.6.4 Egypt

   9.6.6.4.1 Smartphone Market Size & Forecast, By Operating System, 2021 – 2032

   9.6.6.4.2 Smartphone Market Size & Forecast, By Distribution Channel, 2021 – 2032

   9.6.6.4.3 Smartphone Market Size & Forecast, By Technology, 2021 – 2032

   9.6.6.4.4 Smartphone Market Size & Forecast, By Form-Factor, 2021 – 2032

  9.6.6.5 South Africa

   9.6.6.5.1 Smartphone Market Size & Forecast, By Operating System, 2021 – 2032

   9.6.6.5.2 Smartphone Market Size & Forecast, By Distribution Channel, 2021 – 2032

   9.6.6.5.3 Smartphone Market Size & Forecast, By Technology, 2021 – 2032

   9.6.6.5.4 Smartphone Market Size & Forecast, By Form-Factor, 2021 – 2032

  9.6.6.6 Rest of Middle East & Africa

   9.6.6.6.1 Smartphone Market Size & Forecast, By Operating System, 2021 – 2032

   9.6.6.6.2 Smartphone Market Size & Forecast, By Distribution Channel, 2021 – 2032

   9.6.6.6.3 Smartphone Market Size & Forecast, By Technology, 2021 – 2032

   9.6.6.6.4 Smartphone Market Size & Forecast, By Form-Factor, 2021 – 2032

10. Competitive Landscape

 10.1 Key Players' Positioning

 10.2 Competitive Developments

  10.2.1 Key Strategies Adopted (%), By Key Players, 2024

  10.2.2 Year-Wise Strategies & Development, 2021 – 2025

  10.2.3 Number Of Strategies Adopted By Key Players, 2024

 10.3 Market Share Analysis, 2024

 10.4 Product/Service & Application Benchmarking

  10.4.1 Product/Service Specifications & Features By Key Players

  10.4.2 Product/Service Heatmap By Key Players

  10.4.3 Application Heatmap By Key Players

 10.5 Industry Start-Up & Innovation Landscape

10.6 Key Company Profiles

 10.6.1 Apple Inc.

  10.6.1.1 Company Overview & Snapshot

  10.6.1.2 Product/Service Portfolio

  10.6.1.3 Key Company Financials

  10.6.1.4 SWOT Analysis

 10.6.2 Samsung Electronics Co., Ltd.

  10.6.2.1 Company Overview & Snapshot

  10.6.2.2 Product/Service Portfolio

  10.6.2.3 Key Company Financials

  10.6.2.4 SWOT Analysis

 10.6.3 Xiaomi Corporation

  10.6.3.1 Company Overview & Snapshot

  10.6.3.2 Product/Service Portfolio

  10.6.3.3 Key Company Financials

  10.6.3.4 SWOT Analysis

 10.6.4 OPPO

  10.6.4.1 Company Overview & Snapshot

  10.6.4.2 Product/Service Portfolio

  10.6.4.3 Key Company Financials

  10.6.4.4 SWOT Analysis

 10.6.5 vivo Communication Technology Co., Ltd.

  10.6.5.1 Company Overview & Snapshot

  10.6.5.2 Product/Service Portfolio

  10.6.5.3 Key Company Financials

  10.6.5.4 SWOT Analysis

 10.6.6 Huawei Technologies Co., Ltd.

  10.6.6.1 Company Overview & Snapshot

  10.6.6.2 Product/Service Portfolio

  10.6.6.3 Key Company Financials

  10.6.6.4 SWOT Analysis

 10.6.7 Lenovo Group Limited

  10.6.7.1 Company Overview & Snapshot

  10.6.7.2 Product/Service Portfolio

  10.6.7.3 Key Company Financials

  10.6.7.4 SWOT Analysis

 10.6.8 Realme

  10.6.8.1 Company Overview & Snapshot

  10.6.8.2 Product/Service Portfolio

  10.6.8.3 Key Company Financials

  10.6.8.4 SWOT Analysis

 10.6.9 OnePlus Technology Co., Ltd.

  10.6.9.1 Company Overview & Snapshot

  10.6.9.2 Product/Service Portfolio

  10.6.9.3 Key Company Financials

  10.6.9.4 SWOT Analysis

 10.6.10 Transsion Holdings

  10.6.10.1 Company Overview & Snapshot

  10.6.10.2 Product/Service Portfolio

  10.6.10.3 Key Company Financials

  10.6.10.4 SWOT Analysis

 10.6.11 Google LLC

  10.6.11.1 Company Overview & Snapshot

  10.6.11.2 Product/Service Portfolio

  10.6.11.3 Key Company Financials

  10.6.11.4 SWOT Analysis

 10.6.12 Sony Corporation

  10.6.12.1 Company Overview & Snapshot

  10.6.12.2 Product/Service Portfolio

  10.6.12.3 Key Company Financials

  10.6.12.4 SWOT Analysis

 10.6.13 LG Electronics Inc.

  10.6.13.1 Company Overview & Snapshot

  10.6.13.2 Product/Service Portfolio

  10.6.13.3 Key Company Financials

  10.6.13.4 SWOT Analysis

 10.6.14 ZTE Corporation

  10.6.14.1 Company Overview & Snapshot

  10.6.14.2 Product/Service Portfolio

  10.6.14.3 Key Company Financials

  10.6.14.4 SWOT Analysis

 10.6.15 Honor Device Co., Ltd.

  10.6.15.1 Company Overview & Snapshot

  10.6.15.2 Product/Service Portfolio

  10.6.15.3 Key Company Financials

  10.6.15.4 SWOT Analysis

 10.6.16 Nokia

  10.6.16.1 Company Overview & Snapshot

  10.6.16.2 Product/Service Portfolio

  10.6.16.3 Key Company Financials

  10.6.16.4 SWOT Analysis

 10.6.17 Micromax Informatics Ltd.

  10.6.17.1 Company Overview & Snapshot

  10.6.17.2 Product/Service Portfolio

  10.6.17.3 Key Company Financials

  10.6.17.4 SWOT Analysis

 10.6.18 Lava International Ltd.

  10.6.18.1 Company Overview & Snapshot

  10.6.18.2 Product/Service Portfolio

  10.6.18.3 Key Company Financials

  10.6.18.4 SWOT Analysis

 10.6.19 ASUSTeK Computer Inc.

  10.6.19.1 Company Overview & Snapshot

  10.6.19.2 Product/Service Portfolio

  10.6.19.3 Key Company Financials

  10.6.19.4 SWOT Analysis

 10.6.20 Panasonic Corporation

  10.6.20.1 Company Overview & Snapshot

  10.6.20.2 Product/Service Portfolio

  10.6.20.3 Key Company Financials

  10.6.20.4 SWOT Analysis

11. Analyst Recommendations

 11.1 SNS Insider Opportunity Map

 11.2 Industry Low-Hanging Fruit Assessment

 11.3 Market Entry & Growth Strategy

 11.4 Analyst Viewpoint & Suggestions On Market Growth

12. Assumptions

13. Disclaimer

14. Appendix

 14.1 List Of Tables

 14.2 List Of Figures

Key Segments: 

By Operating System

  • Android

  • iOS

  • Windows

  • Others   

By Distribution Channel

  • OEMs stores

  • Retailer

  • E-commerce

By Technology

  • 5G

  • 4G/LTE

  • 3G and Below

By Form-Factor

  • Bar

  • Foldable/Flip

  • Rugged/Industrial

Request for Segment Customization as per your Business Requirement: Segment Customization Request

Regional Coverage:

North America

  • US

  • Canada

Europe

  • Germany

  • UK

  • France

  • Italy

  • Spain

  • Russia

  • Poland

  • Rest of Europe

Asia Pacific

  • China

  • India

  • Japan

  • South Korea

  • Australia

  • ASEAN Countries

  • Rest of Asia Pacific

Middle East & Africa

  • UAE

  • Saudi Arabia

  • Qatar

  • South Africa

  • Rest of Middle East & Africa

Latin America

  • Brazil

  • Argentina

  • Mexico

  • Colombia

  • Rest of Latin America

Request for Country Level Research Report: Country Level Customization Request

Available Customization 

With the given market data, SNS Insider offers customization as per the company’s specific needs. The following customization options are available for the report: 

  • Detailed Volume Analysis 

  • Criss-Cross segment analysis (e.g. Product X Application) 

  • Competitive Product Benchmarking 

  • Geographic Analysis 

  • Additional countries in any of the regions 

  • Customized Data Representation 

  • Detailed analysis and profiling of additional market players

An accurate research report requires proper strategizing as well as implementation. There are multiple factors involved in the completion of good and accurate research report and selecting the best methodology to compete the research is the toughest part. Since the research reports we provide play a crucial role in any company’s decision-making process, therefore we at SNS Insider always believe that we should choose the best method which gives us results closer to reality. This allows us to reach at a stage wherein we can provide our clients best and accurate investment to output ratio.

Each report that we prepare takes a timeframe of 350-400 business hours for production. Starting from the selection of titles through a couple of in-depth brain storming session to the final QC process before uploading our titles on our website we dedicate around 350 working hours. The titles are selected based on their current market cap and the foreseen CAGR and growth.


The 5 steps process:

Step 1: Secondary Research:

Secondary Research or Desk Research is as the name suggests is a research process wherein, we collect data through the readily available information. In this process we use various paid and unpaid databases which our team has access to and gather data through the same. This includes examining of listed companies’ annual reports, Journals, SEC filling etc. Apart from this our team has access to various associations across the globe across different industries. Lastly, we have exchange relationships with various university as well as individual libraries.

Secondary Research

Step 2: Primary Research

When we talk about primary research, it is a type of study in which the researchers collect relevant data samples directly, rather than relying on previously collected data.  This type of research is focused on gaining content specific facts that can be sued to solve specific problems. Since the collected data is fresh and first hand therefore it makes the study more accurate and genuine.

We at SNS Insider have divided Primary Research into 2 parts.

Part 1 wherein we interview the KOLs of major players as well as the upcoming ones across various geographic regions. This allows us to have their view over the market scenario and acts as an important tool to come closer to the accurate market numbers. As many as 45 paid and unpaid primary interviews are taken from both the demand and supply side of the industry to make sure we land at an accurate judgement and analysis of the market.

This step involves the triangulation of data wherein our team analyses the interview transcripts, online survey responses and observation of on filed participants. The below mentioned chart should give a better understanding of the part 1 of the primary interview.

Primary Research

Part 2: In this part of primary research the data collected via secondary research and the part 1 of the primary research is validated with the interviews from individual consultants and subject matter experts.

Consultants are those set of people who have at least 12 years of experience and expertise within the industry whereas Subject Matter Experts are those with at least 15 years of experience behind their back within the same space. The data with the help of two main processes i.e., FGDs (Focused Group Discussions) and IDs (Individual Discussions). This gives us a 3rd party nonbiased primary view of the market scenario making it a more dependable one while collation of the data pointers.

Step 3: Data Bank Validation

Once all the information is collected via primary and secondary sources, we run that information for data validation. At our intelligence centre our research heads track a lot of information related to the market which includes the quarterly reports, the daily stock prices, and other relevant information. Our data bank server gets updated every fortnight and that is how the information which we collected using our primary and secondary information is revalidated in real time.

Data Bank Validation

Step 4: QA/QC Process

After all the data collection and validation our team does a final level of quality check and quality assurance to get rid of any unwanted or undesired mistakes. This might include but not limited to getting rid of the any typos, duplication of numbers or missing of any important information. The people involved in this process include technical content writers, research heads and graphics people. Once this process is completed the title gets uploader on our platform for our clients to read it.

Step 5: Final QC/QA Process:

This is the last process and comes when the client has ordered the study. In this process a final QA/QC is done before the study is emailed to the client. Since we believe in giving our clients a good experience of our research studies, therefore, to make sure that we do not lack at our end in any way humanly possible we do a final round of quality check and then dispatch the study to the client.