image

Operations Advisory Service Market Size, Share, and Segmentation by Organization Size (Large Enterprises, Small & Medium-Sized Enterprises (SMEs)), Industry Vertical (BFSI, IT and Telecom, Manufacturing, Retail and E-Commerce, Public Sector, Healthcare, Others [Energy and Utilities, Transportation and Logistics]), Application, and Service Type, and Region | Global Forecast 2025-2032

Date: July 2025 Report Code: SNS/ICT/7854 Page 300

Operations Advisory Service Market Report Scope & Overview:

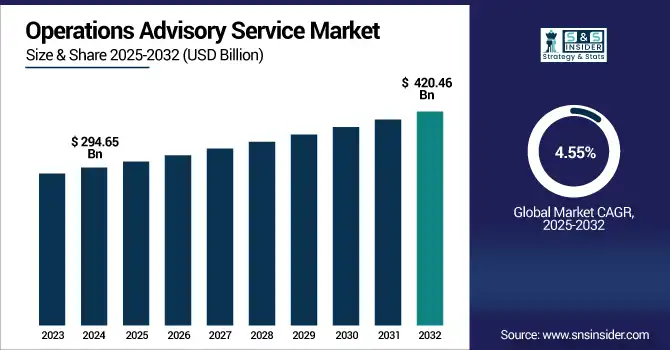
The Operations Advisory Service Market Size was valued at USD 294.65 billion in 2024 and is expected to reach USD 420.46 billion by 2032, growing at a CAGR of 4.55% over the forecast period of 2025-2032.

The Market focuses on providing expert guidance to organizations aiming to enhance operational efficiency, streamline processes, and optimize resource utilization. These services cover a wide range of operational areas, including supply chain, procurement, manufacturing, finance, and customer service. Driven by increasing business complexity, digital transformation, and the demand for agile operations, organizations are turning to advisory firms to gain a competitive edge. The market is witnessing strong growth across industries such as healthcare, retail, IT, manufacturing, and financial services, with consultants leveraging data analytics, automation, and strategic frameworks to deliver measurable performance improvements.

According to a study, the industry is experiencing significant growth, with a rising number of organizations seeking expert support to improve efficiency and streamline operations. Over 70% of enterprises have adopted advisory services to address operational challenges in areas such as supply chain, procurement, and finance. The market sees strong demand across industries like healthcare, IT, and manufacturing, with consultants increasingly using automation, data analytics, and strategic tools to drive measurable performance enhancements and operational agility.

The U.S. Operations Advisory Service Market size was USD 51.71 billion in 2024 and is expected to reach USD 64.54 billion by 2032, growing at a CAGR of 2.81% over the forecast period of 2025–2032. The U.S. Market is experiencing an increasing demand for digital transformation and operational efficiency across industries. The U.S. dominates the North American market due to its advanced technological infrastructure, high concentration of global consulting firms, and strong presence of Fortune 500 companies. Additionally, widespread adoption of data analytics and automation tools further boosts the demand for operations advisory services in the country.

Market Dynamics

Key Drivers:

  • Rising Focus on Digital Transformation Across Enterprises Fuels Growth of Operations Advisory Service Market

The growing emphasis on digital transformation across industries is significantly driving the Operations Advisory Service Market. As organizations aim to stay competitive, enhance agility, and modernize operations, they increasingly rely on advisory firms to guide their digital journeys. This illustrates how demand for data-driven operations is reshaping the advisory landscape. Enterprises in the U.S., especially in healthcare, manufacturing, and financial services, are implementing cloud-based solutions, AI, and IoT to transform their workflows. These changes require complex operational redesign, where advisory services play a critical role. Additionally, the shift toward customer-centric models and omnichannel strategies has created a surge in demand for expert guidance on process reengineering and supply chain optimization.

In February 2024, Deloitte launched its AI Operations Framework, designed to assist global enterprises in building intelligent operational ecosystems using real-time analytics and machine learning. The framework targets sectors like finance and healthcare, aiming to optimize everything from supply chain visibility to customer service. This development is a strong example of how digital transformation is being embedded into operations advisory offerings to meet evolving enterprise demands.

Restraints:

  • High Cost of Implementation and Consulting Services Hampers Operations Advisory Service Market Expansion

The high cost associated with implementing operations advisory services remains a significant restraint for market expansion. These services often require extensive diagnostics, advanced analytics, and expert consultation, resources that come with a premium price tag. Small and mid-sized enterprises (SMEs), in particular, find it challenging to afford comprehensive advisory engagements due to limited budgets. Moreover, the cost of implementing suggested changes, such as upgrading IT systems, retraining staff, or restructuring supply chains, can be prohibitively expensive, further deterring potential clients.

Additionally, the lack of clear and immediate ROI in some advisory projects contributes to hesitancy among business leaders. This financial barrier disproportionately affects industries still recovering from economic slowdowns or those with low operational margins. As a result, despite the evident long-term benefits of operational consulting, high upfront costs and ongoing resource commitments remain a critical barrier to widespread market adoption, especially outside well-funded sectors like finance and tech. This cost concern underscores the need for more modular, scalable, and outcome-based advisory models to drive future growth.

Opportunities:

  • Integration of AI and Automation Creates New Opportunities for U.S. Operations Advisory Service Market Growth

The increasing integration of AI and automation technologies presents a major opportunity for the Operations Advisory Service Market, especially in the U.S. Enterprises are seeking to automate repetitive tasks, gain real-time operational insights, and enhance decision-making with AI, driving demand for advisory firms that can provide strategic guidance on implementing these technologies. From robotic process automation in finance departments to AI-based demand forecasting in retail, operations advisory services are evolving to help businesses harness the full potential of automation. This transformation requires tailored roadmaps, change management expertise, and system integration, areas where advisory firms provide irreplaceable value.

In May 2024, Accenture announced a $1.1 billion investment in AI-driven operations consulting across North America, including services tailored to help retail and logistics companies automate inventory, fulfillment, and customer support functions.

Challenges:

  • Shortage of Skilled Advisory Talent Presents a Key Challenge for Operations Advisory Service Market Expansion

Due to the shortage of skilled advisory talent capable of handling complex transformation projects. As demand surges for specialized expertise in digital operations, supply chain redesign, AI implementation, and agile frameworks, the talent pipeline is struggling to keep up. The gap is particularly noticeable in mid- to senior-level consultants who possess both technical knowledge and industry-specific operational insight. This talent crunch is more pronounced in the U.S., where the market is growing rapidly, and firms compete intensely for top-tier advisory professionals. Hiring, training, and retaining such talent is a costly and time-consuming process.

Moreover, emerging technologies are evolving so quickly that continuous upskilling becomes essential, yet difficult to maintain at scale. This challenge slows down project timelines, limits the number of concurrent client engagements firms can handle, and sometimes impacts service quality. Advisory firms are increasingly investing in internal training programs and strategic partnerships with tech providers and academic institutions to mitigate this issue. However, until the talent shortage is addressed effectively, it will continue to act as a bottleneck for the market’s expansion, especially in delivering high-value, tech-integrated operational solutions.

Segmentation Analysis:

By Organization Size

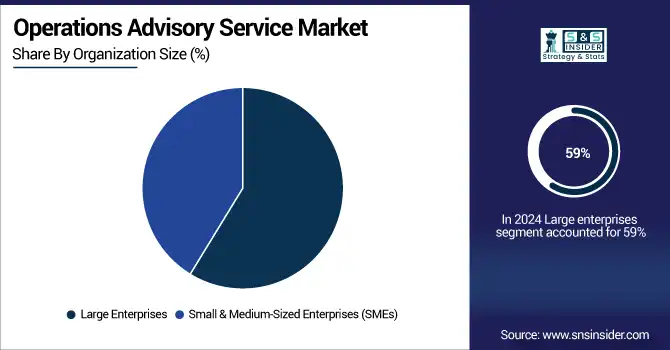
Large enterprises dominate the Operations Advisory Service Market with a 59% revenue share in 2024 due to their complex operational needs and ability to invest in large-scale transformation initiatives. These organizations seek advisory support to manage multi-layered supply chains, optimize enterprise resource planning, and improve cross-functional alignment. Their focus on global expansion, automation, and digital transformation fuels continuous demand for strategic operational consulting, reinforcing the market’s reliance on high-value, long-term advisory engagements in this segment.

Small and medium-sized enterprises (SMEs) are growing at the fastest CAGR of 6.41% during the forecast period, as they increasingly adopt structured operational strategies to scale effectively. Limited internal capabilities and the need for process standardization drive SMEs to seek affordable, modular advisory services. Their growing interest in digitization, cloud integration, and lean process management aligns with operations advisory firms offering tailored solutions, enabling SMEs to compete more efficiently and contributing significantly to market expansion.

By Industry Vertical

The BFSI sector holds a dominant 23% revenue share in 2024 due to its continuous pursuit of operational efficiency, regulatory compliance, and customer-centric service delivery. Institutions within banking, insurance, and investment services increasingly turn to advisory firms to optimize workflows, modernize core operations, and implement agile practices. The complexity of legacy systems, growing data volumes, and evolving risk management requirements make BFSI a leading consumer of operations advisory services across North America and globally.

The IT and Telecom segment is expanding at the fastest CAGR of 6.74% during the forecast period, driven by rapid technological evolution and intense market competition. Companies in this sector seek advisory services to enhance agility, improve infrastructure scalability, and align operations with fast-changing customer expectations. Emphasis on automation, network optimization, and efficient service delivery models strengthens the need for strategic advisory support, accelerating demand for operational consulting across both large tech firms and telecom providers.

By Application

Supply chain operations dominate with a 25% market share in 2024, as organizations focus on improving end-to-end visibility, resilience, and cost control. Increasing supply chain disruptions, globalization, and demand fluctuations have prompted businesses to seek expert guidance in optimizing logistics, procurement, and inventory management. Operations advisory firms provide strategic frameworks to redesign supply chain networks, reduce inefficiencies, and integrate digital tools, making this application area a cornerstone of operational consulting engagements across industries.

Financial operations are growing at the highest CAGR of 6.73%, driven by rising demand for financial transparency, real-time reporting, and risk control. Organizations are increasingly engaging advisory services to optimize budgeting, forecasting, and compliance-related processes. With an emphasis on performance metrics, automation of accounting systems, and cost reduction, financial departments are prioritizing efficiency. Operations advisory services provide the strategic insights needed to modernize finance functions, making this segment a key area of rapid transformation.

By Service Type

Business process optimization leads the market with a 24% revenue share in 2024, as enterprises aim to streamline workflows, eliminate redundancies, and enhance cross-functional efficiency. Operations advisory services in this area focus on redesigning existing processes, aligning them with strategic objectives, and integrating technology for scalable improvement. This service type is in high demand across sectors seeking to improve productivity, customer experience, and cost management, making it foundational to operational transformation initiatives.

The Change Management & Transformation segment is growing at the fastest CAGR of 6.50%, as businesses face continual shifts in technology, consumer behavior, and market structure. Effective change requires cultural alignment, employee training, and agile leadership, key areas where advisory firms deliver value. Organizations increasingly seek support in managing transitions, restructuring teams, and adopting new technologies, positioning this service type as a critical driver of sustainable operational change across diverse industry verticals.

Regional Analysis:

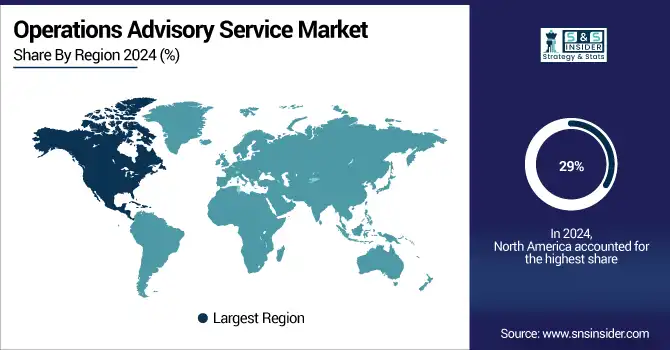
North America is the dominant region in the Operations Advisory Service Market share in 2024, with an estimated market of 29%. Robust enterprise digitization, mature consulting frameworks, and strong adoption of strategic operations advisory services drive North America’s leadership in this market. The U.S. leads the region with the highest share, supported by a large presence of multinational corporations, high consulting budgets, and a focus on operational efficiency and agility. U.S. organizations across sectors like BFSI, healthcare, and manufacturing continue to invest heavily in workflow optimization and enterprise-wide process transformation, reinforcing the region’s dominance.

Asia Pacific is the fastest-growing region in the Operations Advisory Service Market in 2024 with an estimated CAGR of 6.58%. Rapid digital transformation, rising SME adoption of structured operations frameworks, and expanding industrial sectors propel growth across Asia Pacific. India leads this fast-evolving region, driven by strong demand for operational efficiency, an active tech-driven business environment, and growing adoption of cloud and automation solutions. Companies across IT, telecom, and retail in India are increasingly seeking advisory services to streamline business operations, improve scalability, and enhance competitiveness, positioning the country as a regional growth engine.

Europe’s Demand for Process Optimization and Compliance Fuels Operations Advisory Service Market Expansion in 2024. Heightened focus on ESG regulations, digital modernization, and post-Brexit operational restructuring drives advisory demand across European industries. Germany dominates the regional market, supported by its precision-led industrial ecosystem, focus on operational excellence, and strong digital innovation frameworks. German enterprises are prioritizing lean manufacturing and supply chain optimization, particularly within the automotive and engineering sectors. Regulatory alignment and structured digital integration place Germany at the forefront of operations advisory adoption across the European continent.

In 2024, the Operations Advisory Service Market in the Middle East & Africa (MEA) and Latin America will experience steady growth, driven by diversification agendas and business efficiency goals. The UAE leads MEA, with a focus on improving government and private sector operations through digitization and performance optimization. In Latin America, Brazil is the dominant country, supported by economic reforms, digital integration in manufacturing, and the need for efficient financial operations. Both regions are turning to advisory services to support process transformation and organizational agility as part of their broader economic modernization strategies.

Key Players:

The Operations Advisory Service Market companies, Deloitte, PricewaterhouseCoopers (PwC), KPMG International, McKinsey & Company, Ernst & Young Global Limited (EY), A.T. Kearney, Inc., The Hackett Group, Bain & Company, Boston Consulting Group (BCG), Accenture, IBM Global Business Services, Capgemini SE, Tata Consultancy Services (TCS), Infosys Consulting, Cognizant Technology Solutions, BearingPoint, PA Consulting Group, Alvarez & Marsal, Roland Berger, Huron Consulting Group, and others.

Recent Developments:

  • February 2024 – Deloitte announced a strategic scale-back of its regional deal advisory services in the UK, citing a shift toward larger, sector-focused M&A engagements as part of optimizing operations and improving advisory efficiency

  • June 2023 – PwC sold its Australian government consulting business to private equity firm Allegro Funds for just USD 1, renaming it Scyne Advisory. This move reflects a strategic refocus and realignment of their advisory operations.

Operations Advisory Service Market Report Scope:

Report Attributes Details
Market Size in 2024 USD 294.65 Billion 
Market Size by 2032 USD 420.46 Billion 
CAGR CAGR of 4.55% From 2025 to 2032
Base Year 2024
Forecast Period 2025-2032
Historical Data 2021-2023
Report Scope & Coverage Market Size, Segments Analysis, Competitive Landscape, Regional Analysis, DROC & SWOT Analysis, Forecast Outlook
Key Segments • By Organization Size (Large Enterprises, Small & Medium-Sized Enterprises (SMEs))
• By Industry Vertical (BFSI, IT and Telecom, Manufacturing, Retail and E-Commerce, Public Sector, Healthcare, Others [Energy and Utilities, Transportation and Logistics])
• By Application (Supply Chain Operations, Financial Operations, Human Resource Operations, Project Management, Process Management, Manufacturing Operations, Others [Customer Service Operations, Compliance and Risk Operations])
• By Service Type (Business Process Optimization, Operational Strategy Development, Technology Implementation & Integration, Change Management & Transformation, Risk & Compliance Management, Performance Measurement & Improvement, Others [Outsourcing Advisory, Quality Assurance])
Regional Analysis/Coverage North America (US, Canada), Europe (Germany, UK, France, Italy, Spain, Russia, Poland, Rest of Europe), Asia Pacific (China, India, Japan, South Korea, Australia, ASEAN Countries, Rest of Asia Pacific), Middle East & Africa (UAE, Saudi Arabia, Qatar, South Africa, Rest of Middle East & Africa), Latin America (Brazil, Argentina, Mexico, Colombia, Rest of Latin America).
Company Profiles Deloitte, PricewaterhouseCoopers (PwC), KPMG International, McKinsey & Company, Ernst & Young Global Limited (EY), A.T. Kearney, Inc., The Hackett Group, Bain & Company, Boston Consulting Group (BCG), Accenture, IBM Global Business Services, Capgemini SE, Tata Consultancy Services (TCS), Infosys Consulting, Cognizant Technology Solutions, BearingPoint, PA Consulting Group, Alvarez & Marsal, Roland Berger, Huron Consulting Group, and others.

Frequently Asked Questions

Ans: The Operations Advisory Service Market is expected to grow at a CAGR of 4.55% during 2025-2032.

Ans: The Operations Advisory Service Market size was USD 294.65 billion in 2024 and is expected to reach USD 420.46 billion by 2032.

Ans: The major growth factor of the Operations Advisory Service Market is the rising demand for digital transformation and operational efficiency across industries.

Ans: The BFSI segment dominated the Operations Advisory Service Market.

Ans: North America dominated the Operations Advisory Service Market in 2024.

Table Of Contents

1. Introduction

1.1 Market Definition & Scope

 1.2 Research Assumptions & Abbreviations

 1.3 Research Methodology

2. Executive Summary

2.1 Market Snapshot

 2.2 Market Absolute $ Opportunity Assessment & Y-o-Y Analysis, 2021–2032

 2.3 Market Size & Forecast, By Segmentation, 2021–2032

  2.3.1 Market Size By Organization Size

  2.3.2 Market Size By Application

 2.4 Market Share & Bps Analysis By Region, 2024

 2.5 Industry Growth Scenarios – Conservative, Likely & Optimistic

 2.6 Industry CxO’s Perspective

3. Market Overview

3.1 Market Dynamics

  3.1.1 Drivers

  3.1.2 Restraints

  3.1.3 Opportunities

  3.1.4 Key Market Trends

 3.2 Industry PESTLE Analysis

 3.3 Key Industry Forces (Porter’s) Impacting Market Growth

 3.4 Industry Supply Chain Analysis

  3.4.1 Raw Material Suppliers

  3.4.2 Manufacturers

  3.4.3 Distributors/Suppliers

  3.4.4 Customers/End-Users

 3.5 Industry Life Cycle Assessment

 3.6 Parent Market Overview

 3.7 Market Risk Assessment

4. Statistical Insights & Trends Reporting

    4.1 Client Engagement & Project Delivery Metrics

4.1.1 Average number of operations advisory projects per firm per year

4.1.2 Median project duration (in weeks) by industry vertical

4.1.3 Client retention rate post-advisory implementation (%)

4.1.4 Average cost savings achieved per project ($ or %)

4.1.5 Average number of touchpoints per client engagement

   4.2 Service Adoption & Utilization Trends

4.2.1 Utilization rate of operations advisory services by business size (SMEs vs. large enterprises)

4.2.2 Percentage of clients adopting follow-up digital transformation services

4.2.3 Average number of operational KPIs improved post-advisory

4.2.4 Share of projects focusing on supply chain optimization vs. process reengineering

4.2.5 Adoption rate of real-time analytics in operations advisory (% of projects)

   4.3 Pricing & Value Metrics

4.3.1 Average consulting fee per hour or per project by region

4.3.2 Fixed vs. outcome-based pricing model adoption rate (%)

4.3.3 Client ROI within 12 months post-advisory project (%)

4.3.4 Budget allocation by companies toward external operational consulting (% of total OPEX)

4.3.5 Price variation by domain (e.g., logistics, procurement, manufacturing)

   4.4 Workforce & Resource Utilization Metrics

4.4.1 Average number of consultants per project

4.4.2 Billable utilization rate of operations consultants (%)

4.4.3 Annual training hours per consultant in operations innovation tools

4.4.4 Consultant-to-client ratio for project success benchmarking

4.4.5 Attrition rate in top operations advisory firms (%)

   4.5 Performance & Outcome Measurement

4.5.1 Average % improvement in operational efficiency post-engagement

4.5.2 Reduction in operational costs (avg. %) across top 5 industries

4.5.3 Cycle time reduction (in days) due to advisory-led process optimization

4.5.4 Average client satisfaction score post-engagement (scale of 1–10)

4.5.5 % of repeat clients within 2 years of first engagement

5. Operations Advisory Service Market Segmental Analysis & Forecast, By Organization Size, 2021 – 2032

5.1 Introduction

 5.2 Large Enterprises

  5.2.1 Key Trends

  5.2.2 Market Size & Forecast, 2021 – 2032

 5.3 Small & Medium-Sized Enterprises (SMEs)

  5.3.1 Key Trends

  5.3.2 Market Size & Forecast, 2021 – 2032

6. Operations Advisory Service Market Segmental Analysis & Forecast, By Application, 2021 – 2032

    6.1 Introduction

 6.2 Supply Chain Operations

  6.2.1 Key Trends

  6.2.2 Market Size & Forecast, 2021 – 2032

 6.3 Financial Operations

  6.3.1 Key Trends

  6.3.2 Market Size & Forecast, 2021 – 2032

 6.4 Human Resource Operations

  6.4.1 Key Trends

  6.4.2 Market Size & Forecast, 2021 – 2032

 6.5 Project Management

  6.5.1 Key Trends

  6.5.2 Market Size & Forecast, 2021 – 2032

 6.6 Process Management

  6.6.1 Key Trends

  6.6.2 Market Size & Forecast, 2021 – 2032

 6.7 Manufacturing Operations

  6.7.1 Key Trends

  6.7.2 Market Size & Forecast, 2021 – 2032

 6.8 Others (Customer Service Operations, Compliance and Risk Operations)

  6.8.1 Key Trends

  6.8.2 Market Size & Forecast, 2021 – 2032

7. Operations Advisory Service Market Segmental Analysis & Forecast, By Service Type, 2021 – 2032

    7.1 Introduction

 7.2 Business Process Optimization

  7.2.1 Key Trends

  7.2.2 Market Size & Forecast, 2021 – 2032

 7.3 Operational Strategy Development

  7.3.1 Key Trends

  7.3.2 Market Size & Forecast, 2021 – 2032

 7.4 Technology Implementation & Integration

  7.4.1 Key Trends

  7.4.2 Market Size & Forecast, 2021 – 2032

 7.5 Change Management & Transformation

  7.5.1 Key Trends

  7.5.2 Market Size & Forecast, 2021 – 2032

 7.6 Risk & Compliance Management

  7.6.1 Key Trends

  7.6.2 Market Size & Forecast, 2021 – 2032

 7.7 Performance Measurement & Improvement

  7.7.1 Key Trends

  7.7.2 Market Size & Forecast, 2021 – 2032

 7.8 Others (Outsourcing Advisory, Quality Assurance)

  7.8.1 Key Trends

  7.8.2 Market Size & Forecast, 2021 – 2032

8. Operations Advisory Service Market Segmental Analysis & Forecast, By Industry Vertical, 2021 – 2032

    8.1 Introduction

 8.2 BFSI

  8.2.1 Key Trends

  8.2.2 Market Size & Forecast, 2021 – 2032

 8.3 IT and Telecom

  8.3.1 Key Trends

  8.3.2 Market Size & Forecast, 2021 – 2032

 8.4 Manufacturing

  8.4.1 Key Trends

  8.4.2 Market Size & Forecast, 2021 – 2032

 8.5 Retail and E-Commerce

  8.5.1 Key Trends

  8.5.2 Market Size & Forecast, 2021 – 2032

 8.6 Public Sector

  8.6.1 Key Trends

  8.6.2 Market Size & Forecast, 2021 – 2032

 8.7 Healthcare

  8.7.1 Key Trends

  8.7.2 Market Size & Forecast, 2021 – 2032

 8.8 Others (Energy and Utilities, Transportation and Logistics)

  8.8.1 Key Trends

  8.8.2 Market Size & Forecast, 2021 – 2032

9. Operations Advisory Service Market Segmental Analysis & Forecast By Region, 2021 – 2025

9.1 Introduction

9.2 North America

 9.2.1 Key Trends

 9.2.2 Operations Advisory Service Market Size & Forecast, By Organization Size, 2021 – 2032

 9.2.3 Operations Advisory Service Market Size & Forecast, By Application, 2021 – 2032

 9.2.4 Operations Advisory Service Market Size & Forecast, By Service Type, 2021 – 2032

 9.2.5 Operations Advisory Service Market Size & Forecast, By Industry Vertical, 2021 – 2032

 9.2.6 Operations Advisory Service Market Size & Forecast, By Country, 2021 – 2032

  9.2.6.1 USA

   9.2.6.1.1 Operations Advisory Service Market Size & Forecast, By Organization Size, 2021 – 2032

   9.2.6.1.2 Operations Advisory Service Market Size & Forecast, By Application, 2021 – 2032

   9.2.6.1.3 Operations Advisory Service Market Size & Forecast, By Service Type, 2021 – 2032

   9.2.6.1.4 Operations Advisory Service Market Size & Forecast, By Industry Vertical, 2021 – 2032

  9.2.6.2 Canada

   9.2.6.2.1 Operations Advisory Service Market Size & Forecast, By Organization Size, 2021 – 2032

   9.2.6.2.2 Operations Advisory Service Market Size & Forecast, By Application, 2021 – 2032

   9.2.6.2.3 Operations Advisory Service Market Size & Forecast, By Service Type, 2021 – 2032

   9.2.6.2.4 Operations Advisory Service Market Size & Forecast, By Industry Vertical, 2021 – 2032

9.3 Europe

 9.3.1 Key Trends

 9.3.2 Operations Advisory Service Market Size & Forecast, By Organization Size, 2021 – 2032

 9.3.3 Operations Advisory Service Market Size & Forecast, By Application, 2021 – 2032

 9.3.4 Operations Advisory Service Market Size & Forecast, By Service Type, 2021 – 2032

 9.3.5 Operations Advisory Service Market Size & Forecast, By Industry Vertical, 2021 – 2032

 9.3.6 Operations Advisory Service Market Size & Forecast, By Country, 2021 – 2032

  9.3.6.1 Germany

   9.3.6.1.1 Operations Advisory Service Market Size & Forecast, By Organization Size, 2021 – 2032

   9.3.6.1.2 Operations Advisory Service Market Size & Forecast, By Application, 2021 – 2032

   9.3.6.1.3 Operations Advisory Service Market Size & Forecast, By Service Type, 2021 – 2032

   9.3.6.1.4 Operations Advisory Service Market Size & Forecast, By Industry Vertical, 2021 – 2032

  9.3.6.2 UK

   9.3.6.2.1 Operations Advisory Service Market Size & Forecast, By Organization Size, 2021 – 2032

   9.3.6.2.2 Operations Advisory Service Market Size & Forecast, By Application, 2021 – 2032

   9.3.6.2.3 Operations Advisory Service Market Size & Forecast, By Service Type, 2021 – 2032

   9.3.6.2.4 Operations Advisory Service Market Size & Forecast, By Industry Vertical, 2021 – 2032

  9.3.6.3 France

   9.3.6.3.1 Operations Advisory Service Market Size & Forecast, By Organization Size, 2021 – 2032

   9.3.6.3.2 Operations Advisory Service Market Size & Forecast, By Application, 2021 – 2032

   9.3.6.3.3 Operations Advisory Service Market Size & Forecast, By Service Type, 2021 – 2032

   9.3.6.3.4 Operations Advisory Service Market Size & Forecast, By Industry Vertical, 2021 – 2032

  9.3.6.4 Italy

   9.3.6.4.1 Operations Advisory Service Market Size & Forecast, By Organization Size, 2021 – 2032

   9.3.6.4.2 Operations Advisory Service Market Size & Forecast, By Application, 2021 – 2032

   9.3.6.4.3 Operations Advisory Service Market Size & Forecast, By Service Type, 2021 – 2032

   9.3.6.4.4 Operations Advisory Service Market Size & Forecast, By Industry Vertical, 2021 – 2032

  9.3.6.5 Spain

   9.3.6.5.1 Operations Advisory Service Market Size & Forecast, By Organization Size, 2021 – 2032

   9.3.6.5.2 Operations Advisory Service Market Size & Forecast, By Application, 2021 – 2032

   9.3.6.5.3 Operations Advisory Service Market Size & Forecast, By Service Type, 2021 – 2032

   9.3.6.5.4 Operations Advisory Service Market Size & Forecast, By Industry Vertical, 2021 – 2032

  9.3.6.6 Russia

   9.3.6.6.1 Operations Advisory Service Market Size & Forecast, By Organization Size, 2021 – 2032

   9.3.6.6.2 Operations Advisory Service Market Size & Forecast, By Application, 2021 – 2032

   9.3.6.6.3 Operations Advisory Service Market Size & Forecast, By Service Type, 2021 – 2032

   9.3.6.6.4 Operations Advisory Service Market Size & Forecast, By Industry Vertical, 2021 – 2032

  9.3.6.7 Poland

   9.3.6.7.1 Operations Advisory Service Market Size & Forecast, By Organization Size, 2021 – 2032

   9.3.6.7.2 Operations Advisory Service Market Size & Forecast, By Application, 2021 – 2032

   9.3.6.7.3 Operations Advisory Service Market Size & Forecast, By Service Type, 2021 – 2032

   9.3.6.7.4 Operations Advisory Service Market Size & Forecast, By Industry Vertical, 2021 – 2032

  9.3.6.8 Rest of Europe

   9.3.6.8.1 Operations Advisory Service Market Size & Forecast, By Organization Size, 2021 – 2032

   9.3.6.8.2 Operations Advisory Service Market Size & Forecast, By Application, 2021 – 2032

   9.3.6.8.3 Operations Advisory Service Market Size & Forecast, By Service Type, 2021 – 2032

   9.3.6.8.4 Operations Advisory Service Market Size & Forecast, By Industry Vertical, 2021 – 2032   

9.4 Asia-Pacific

 9.4.1 Key Trends

 9.4.2 Operations Advisory Service Market Size & Forecast, By Organization Size, 2021 – 2032

 9.4.3 Operations Advisory Service Market Size & Forecast, By Application, 2021 – 2032

 9.4.4 Operations Advisory Service Market Size & Forecast, By Service Type, 2021 – 2032

 9.4.5 Operations Advisory Service Market Size & Forecast, By Industry Vertical, 2021 – 2032

 9.4.6 Operations Advisory Service Market Size & Forecast, By Country, 2021 – 2032

  9.4.6.1 China

   9.4.6.1.1 Operations Advisory Service Market Size & Forecast, By Organization Size, 2021 – 2032

   9.4.6.1.2 Operations Advisory Service Market Size & Forecast, By Application, 2021 – 2032

   9.4.6.1.3 Operations Advisory Service Market Size & Forecast, By Service Type, 2021 – 2032

   9.4.6.1.4 Operations Advisory Service Market Size & Forecast, By Industry Vertical, 2021 – 2032

  9.4.6.2 India

   9.4.6.2.1 Operations Advisory Service Market Size & Forecast, By Organization Size, 2021 – 2032

   9.4.6.2.2 Operations Advisory Service Market Size & Forecast, By Application, 2021 – 2032

   9.4.6.2.3 Operations Advisory Service Market Size & Forecast, By Service Type, 2021 – 2032

   9.4.6.2.4 Operations Advisory Service Market Size & Forecast, By Industry Vertical, 2021 – 2032

  9.4.6.3 Japan

   9.4.6.3.1 Operations Advisory Service Market Size & Forecast, By Organization Size, 2021 – 2032

   9.4.6.3.2 Operations Advisory Service Market Size & Forecast, By Application, 2021 – 2032

   9.4.6.3.3 Operations Advisory Service Market Size & Forecast, By Service Type, 2021 – 2032

   9.4.6.3.4 Operations Advisory Service Market Size & Forecast, By Industry Vertical, 2021 – 2032

  9.4.6.4 South Korea

   9.4.6.4.1 Operations Advisory Service Market Size & Forecast, By Organization Size, 2021 – 2032

   9.4.6.4.2 Operations Advisory Service Market Size & Forecast, By Application, 2021 – 2032

   9.4.6.4.3 Operations Advisory Service Market Size & Forecast, By Service Type, 2021 – 2032

   9.4.6.4.4 Operations Advisory Service Market Size & Forecast, By Industry Vertical, 2021 – 2032

  9.4.6.5 Australia

   9.4.6.5.1 Operations Advisory Service Market Size & Forecast, By Organization Size, 2021 – 2032

   9.4.6.5.2 Operations Advisory Service Market Size & Forecast, By Application, 2021 – 2032

   9.4.6.5.3 Operations Advisory Service Market Size & Forecast, By Service Type, 2021 – 2032

   9.4.6.5.4 Operations Advisory Service Market Size & Forecast, By Industry Vertical, 2021 – 2032

  9.4.6.6 ASEAN Countries

   9.4.6.6.1 Operations Advisory Service Market Size & Forecast, By Organization Size, 2021 – 2032

   9.4.6.6.2 Operations Advisory Service Market Size & Forecast, By Application, 2021 – 2032

   9.4.6.6.3 Operations Advisory Service Market Size & Forecast, By Service Type, 2021 – 2032

   9.4.6.6.4 Operations Advisory Service Market Size & Forecast, By Industry Vertical, 2021 – 2032

  9.4.6.7 Rest of Asia-Pacific

   9.4.6.7.1 Operations Advisory Service Market Size & Forecast, By Organization Size, 2021 – 2032

   9.4.6.7.2 Operations Advisory Service Market Size & Forecast, By Application, 2021 – 2032

   9.4.6.7.3 Operations Advisory Service Market Size & Forecast, By Service Type, 2021 – 2032

   9.4.6.7.4 Operations Advisory Service Market Size & Forecast, By Industry Vertical, 2021 – 2032

9.5 Latin America

 9.5.1 Key Trends

 9.5.2 Operations Advisory Service Market Size & Forecast, By Organization Size, 2021 – 2032

 9.5.3 Operations Advisory Service Market Size & Forecast, By Application, 2021 – 2032

 9.5.4 Operations Advisory Service Market Size & Forecast, By Service Type, 2021 – 2032

 9.5.5 Operations Advisory Service Market Size & Forecast, By Industry Vertical, 2021 – 2032

 9.5.6 Operations Advisory Service Market Size & Forecast, By Country, 2021 – 2032

  9.5.6.1 Brazil

   9.5.6.1.1 Operations Advisory Service Market Size & Forecast, By Organization Size, 2021 – 2032

   9.5.6.1.2 Operations Advisory Service Market Size & Forecast, By Application, 2021 – 2032

   9.5.6.1.3 Operations Advisory Service Market Size & Forecast, By Service Type, 2021 – 2032

   9.5.6.1.4 Operations Advisory Service Market Size & Forecast, By Industry Vertical, 2021 – 2032

  9.5.6.2 Argentina

   9.5.6.2.1 Operations Advisory Service Market Size & Forecast, By Organization Size, 2021 – 2032

   9.5.6.2.2 Operations Advisory Service Market Size & Forecast, By Application, 2021 – 2032

   9.5.6.2.3 Operations Advisory Service Market Size & Forecast, By Service Type, 2021 – 2032

   9.5.6.2.4 Operations Advisory Service Market Size & Forecast, By Industry Vertical, 2021 – 2032

  9.5.6.3 Mexico

   9.5.6.3.1 Operations Advisory Service Market Size & Forecast, By Organization Size, 2021 – 2032

   9.5.6.3.2 Operations Advisory Service Market Size & Forecast, By Application, 2021 – 2032

   9.5.6.3.3 Operations Advisory Service Market Size & Forecast, By Service Type, 2021 – 2032

   9.5.6.3.4 Operations Advisory Service Market Size & Forecast, By Industry Vertical, 2021 – 2032

  9.5.6.4 Colombia

   9.5.6.4.1 Operations Advisory Service Market Size & Forecast, By Organization Size, 2021 – 2032

   9.5.6.4.2 Operations Advisory Service Market Size & Forecast, By Application, 2021 – 2032

   9.5.6.4.3 Operations Advisory Service Market Size & Forecast, By Service Type, 2021 – 2032

   9.5.6.4.4 Operations Advisory Service Market Size & Forecast, By Industry Vertical, 2021 – 2032

  9.5.6.5 Rest of Latin America

   9.5.6.5.1 Operations Advisory Service Market Size & Forecast, By Organization Size, 2021 – 2032

   9.5.6.5.2 Operations Advisory Service Market Size & Forecast, By Application, 2021 – 2032

   9.5.6.5.3 Operations Advisory Service Market Size & Forecast, By Service Type, 2021 – 2032

   9.5.6.5.4 Operations Advisory Service Market Size & Forecast, By Industry Vertical, 2021 – 2032

9.6 Middle East & Africa

 9.6.1 Key Trends

 9.6.2 Operations Advisory Service Market Size & Forecast, By Organization Size, 2021 – 2032

 9.6.3 Operations Advisory Service Market Size & Forecast, By Application, 2021 – 2032

 9.6.4 Operations Advisory Service Market Size & Forecast, By Service Type, 2021 – 2032

 9.6.5 Operations Advisory Service Market Size & Forecast, By Industry Vertical, 2021 – 2032

 9.6.6 Operations Advisory Service Market Size & Forecast, By Country, 2021 – 2032

  9.6.6.1 UAE

   9.6.6.1.1 Operations Advisory Service Market Size & Forecast, By Organization Size, 2021 – 2032

   9.6.6.1.2 Operations Advisory Service Market Size & Forecast, By Application, 2021 – 2032

   9.6.6.1.3 Operations Advisory Service Market Size & Forecast, By Service Type, 2021 – 2032

   9.6.6.1.4 Operations Advisory Service Market Size & Forecast, By Industry Vertical, 2021 – 2032

  9.6.6.2 Saudi Arabia

   9.6.6.2.1 Operations Advisory Service Market Size & Forecast, By Organization Size, 2021 – 2032

   9.6.6.2.2 Operations Advisory Service Market Size & Forecast, By Application, 2021 – 2032

   9.6.6.2.3 Operations Advisory Service Market Size & Forecast, By Service Type, 2021 – 2032

   9.6.6.2.4 Operations Advisory Service Market Size & Forecast, By Industry Vertical, 2021 – 2032

  9.6.6.3 Qatar

   9.6.6.3.1 Operations Advisory Service Market Size & Forecast, By Organization Size, 2021 – 2032

   9.6.6.3.2 Operations Advisory Service Market Size & Forecast, By Application, 2021 – 2032

   9.6.6.3.3 Operations Advisory Service Market Size & Forecast, By Service Type, 2021 – 2032

   9.6.6.3.4 Operations Advisory Service Market Size & Forecast, By Industry Vertical, 2021 – 2032

  9.6.6.4 Egypt

   9.6.6.4.1 Operations Advisory Service Market Size & Forecast, By Organization Size, 2021 – 2032

   9.6.6.4.2 Operations Advisory Service Market Size & Forecast, By Application, 2021 – 2032

   9.6.6.4.3 Operations Advisory Service Market Size & Forecast, By Service Type, 2021 – 2032

   9.6.6.4.4 Operations Advisory Service Market Size & Forecast, By Industry Vertical, 2021 – 2032

  9.6.6.5 South Africa

   9.6.6.5.1 Operations Advisory Service Market Size & Forecast, By Organization Size, 2021 – 2032

   9.6.6.5.2 Operations Advisory Service Market Size & Forecast, By Application, 2021 – 2032

   9.6.6.5.3 Operations Advisory Service Market Size & Forecast, By Service Type, 2021 – 2032

   9.6.6.5.4 Operations Advisory Service Market Size & Forecast, By Industry Vertical, 2021 – 2032

  9.6.6.6 Rest of Middle East & Africa

   9.6.6.6.1 Operations Advisory Service Market Size & Forecast, By Organization Size, 2021 – 2032

   9.6.6.6.2 Operations Advisory Service Market Size & Forecast, By Application, 2021 – 2032

   9.6.6.6.3 Operations Advisory Service Market Size & Forecast, By Service Type, 2021 – 2032

   9.6.6.6.4 Operations Advisory Service Market Size & Forecast, By Industry Vertical, 2021 – 2032

10. Competitive Landscape

 10.1 Key Players' Positioning

 10.2 Competitive Developments

  10.2.1 Key Strategies Adopted (%), By Key Players, 2024

  10.2.2 Year-Wise Strategies & Development, 2021 – 2025

  10.2.3 Number Of Strategies Adopted By Key Players, 2024

 10.3 Market Share Analysis, 2024

 10.4 Product/Service & Application Benchmarking

  10.4.1 Product/Service Specifications & Features By Key Players

  10.4.2 Product/Service Heatmap By Key Players

  10.4.3 Application Heatmap By Key Players

 10.5 Industry Start-Up & Innovation Landscape

 10.6 Key Company Profiles

10.6 Key Company Profiles

 10.6.1 Deloitte

  10.6.1.1 Company Overview & Snapshot

  10.6.1.2 Product/Service Portfolio

  10.6.1.3 Key Company Financials

  10.6.1.4 SWOT Analysis

 10.6.2 PricewaterhouseCoopers (PwC)

  10.6.2.1 Company Overview & Snapshot

  10.6.2.2 Product/Service Portfolio

  10.6.2.3 Key Company Financials

  10.6.2.4 SWOT Analysis

 10.6.3 KPMG International

  10.6.3.1 Company Overview & Snapshot

  10.6.3.2 Product/Service Portfolio

  10.6.3.3 Key Company Financials

  10.6.3.4 SWOT Analysis

 10.6.4 McKinsey & Company

  10.6.4.1 Company Overview & Snapshot

  10.6.4.2 Product/Service Portfolio

  10.6.4.3 Key Company Financials

  10.6.4.4 SWOT Analysis

 10.6.5 Ernst & Young Global Limited (EY)

  10.6.5.1 Company Overview & Snapshot

  10.6.5.2 Product/Service Portfolio

  10.6.5.3 Key Company Financials

  10.6.5.4 SWOT Analysis

 10.6.6 A.T. Kearney, Inc.

  10.6.6.1 Company Overview & Snapshot

  10.6.6.2 Product/Service Portfolio

  10.6.6.3 Key Company Financials

  10.6.6.4 SWOT Analysis

 10.6.7 The Hackett Group

  10.6.7.1 Company Overview & Snapshot

  10.6.7.2 Product/Service Portfolio

  10.6.7.3 Key Company Financials

  10.6.7.4 SWOT Analysis

 10.6.8 Bain & Company

  10.6.8.1 Company Overview & Snapshot

  10.6.8.2 Product/Service Portfolio

  10.6.8.3 Key Company Financials

  10.6.8.4 SWOT Analysis

 10.6.9 Boston Consulting Group (BCG)

  10.6.9.1 Company Overview & Snapshot

  10.6.9.2 Product/Service Portfolio

  10.6.9.3 Key Company Financials

  10.6.9.4 SWOT Analysis

 10.6.10 Accenture

  10.6.10.1 Company Overview & Snapshot

  10.6.10.2 Product/Service Portfolio

  10.6.10.3 Key Company Financials

  10.6.10.4 SWOT Analysis

 10.6.11 IBM Global Business Services

  10.6.11.1 Company Overview & Snapshot

  10.6.11.2 Product/Service Portfolio

  10.6.11.3 Key Company Financials

  10.6.11.4 SWOT Analysis

 10.6.12 Capgemini SE

  10.6.12.1 Company Overview & Snapshot

  10.6.12.2 Product/Service Portfolio

  10.6.12.3 Key Company Financials

  10.6.12.4 SWOT Analysis

 10.6.13 Tata Consultancy Services (TCS)

  10.6.13.1 Company Overview & Snapshot

  10.6.13.2 Product/Service Portfolio

  10.6.13.3 Key Company Financials

  10.6.13.4 SWOT Analysis

 10.6.14 Infosys Consulting

  10.6.14.1 Company Overview & Snapshot

  10.6.14.2 Product/Service Portfolio

  10.6.14.3 Key Company Financials

  10.6.14.4 SWOT Analysis

 10.6.15 Cognizant Technology Solutions

  10.6.15.1 Company Overview & Snapshot

  10.6.15.2 Product/Service Portfolio

  10.6.15.3 Key Company Financials

  10.6.15.4 SWOT Analysis

 10.6.16 BearingPoint

  10.6.16.1 Company Overview & Snapshot

  10.6.16.2 Product/Service Portfolio

  10.6.16.3 Key Company Financials

  10.6.16.4 SWOT Analysis

 10.6.17 PA Consulting Group

  10.6.17.1 Company Overview & Snapshot

  10.6.17.2 Product/Service Portfolio

  10.6.17.3 Key Company Financials

  10.6.17.4 SWOT Analysis

 10.6.18 Alvarez & Marsal

  10.6.18.1 Company Overview & Snapshot

  10.6.18.2 Product/Service Portfolio

  10.6.18.3 Key Company Financials

  10.6.18.4 SWOT Analysis

 10.6.19 Roland Berger

  10.6.19.1 Company Overview & Snapshot

  10.6.19.2 Product/Service Portfolio

  10.6.19.3 Key Company Financials

  10.6.19.4 SWOT Analysis

 10.6.20 Huron Consulting Group

  10.6.20.1 Company Overview & Snapshot

  10.6.20.2 Product/Service Portfolio

  10.6.20.3 Key Company Financials

  10.6.20.4 SWOT Analysis

11. Analyst Recommendations

 11.1 SNS Insider Opportunity Map

 11.2 Industry Low-Hanging Fruit Assessment

 11.3 Market Entry & Growth Strategy

 11.4 Analyst Viewpoint & Suggestions On Market Growth

12. Assumptions

13. Disclaimer

14. Appendix

 14.1 List Of Tables

 14.2 List Of Figures

An accurate research report requires proper strategizing as well as implementation. There are multiple factors involved in the completion of good and accurate research report and selecting the best methodology to compete the research is the toughest part. Since the research reports we provide play a crucial role in any company’s decision-making process, therefore we at SNS Insider always believe that we should choose the best method which gives us results closer to reality. This allows us to reach at a stage wherein we can provide our clients best and accurate investment to output ratio.

Each report that we prepare takes a timeframe of 350-400 business hours for production. Starting from the selection of titles through a couple of in-depth brain storming session to the final QC process before uploading our titles on our website we dedicate around 350 working hours. The titles are selected based on their current market cap and the foreseen CAGR and growth.


The 5 steps process:

Step 1: Secondary Research:

Secondary Research or Desk Research is as the name suggests is a research process wherein, we collect data through the readily available information. In this process we use various paid and unpaid databases which our team has access to and gather data through the same. This includes examining of listed companies’ annual reports, Journals, SEC filling etc. Apart from this our team has access to various associations across the globe across different industries. Lastly, we have exchange relationships with various university as well as individual libraries.

Secondary Research

Step 2: Primary Research

When we talk about primary research, it is a type of study in which the researchers collect relevant data samples directly, rather than relying on previously collected data.  This type of research is focused on gaining content specific facts that can be sued to solve specific problems. Since the collected data is fresh and first hand therefore it makes the study more accurate and genuine.

We at SNS Insider have divided Primary Research into 2 parts.

Part 1 wherein we interview the KOLs of major players as well as the upcoming ones across various geographic regions. This allows us to have their view over the market scenario and acts as an important tool to come closer to the accurate market numbers. As many as 45 paid and unpaid primary interviews are taken from both the demand and supply side of the industry to make sure we land at an accurate judgement and analysis of the market.

This step involves the triangulation of data wherein our team analyses the interview transcripts, online survey responses and observation of on filed participants. The below mentioned chart should give a better understanding of the part 1 of the primary interview.

Primary Research

Part 2: In this part of primary research the data collected via secondary research and the part 1 of the primary research is validated with the interviews from individual consultants and subject matter experts.

Consultants are those set of people who have at least 12 years of experience and expertise within the industry whereas Subject Matter Experts are those with at least 15 years of experience behind their back within the same space. The data with the help of two main processes i.e., FGDs (Focused Group Discussions) and IDs (Individual Discussions). This gives us a 3rd party nonbiased primary view of the market scenario making it a more dependable one while collation of the data pointers.

Step 3: Data Bank Validation

Once all the information is collected via primary and secondary sources, we run that information for data validation. At our intelligence centre our research heads track a lot of information related to the market which includes the quarterly reports, the daily stock prices, and other relevant information. Our data bank server gets updated every fortnight and that is how the information which we collected using our primary and secondary information is revalidated in real time.

Data Bank Validation

Step 4: QA/QC Process

After all the data collection and validation our team does a final level of quality check and quality assurance to get rid of any unwanted or undesired mistakes. This might include but not limited to getting rid of the any typos, duplication of numbers or missing of any important information. The people involved in this process include technical content writers, research heads and graphics people. Once this process is completed the title gets uploader on our platform for our clients to read it.

Step 5: Final QC/QA Process:

This is the last process and comes when the client has ordered the study. In this process a final QA/QC is done before the study is emailed to the client. Since we believe in giving our clients a good experience of our research studies, therefore, to make sure that we do not lack at our end in any way humanly possible we do a final round of quality check and then dispatch the study to the client.

Key Segments: 

By Organization Size

  • Large Enterprises

  • Small & Medium-Sized Enterprises (SMEs)

By Industry Vertical

  • BFSI

  • IT and Telecom

  • Manufacturing

  • Retail and E-Commerce

  • Public Sector

  • Healthcare

  • Others (Energy and Utilities, Transportation and Logistics)

By Application

  • Supply Chain Operations

  • Financial Operations

  • Human Resource Operations

  • Project Management

  • Process Management

  • Manufacturing Operations

  • Others (Customer Service Operations, Compliance and Risk Operations)

By Service Type

  • Business Process Optimization

  • Operational Strategy Development

  • Technology Implementation & Integration

  • Change Management & Transformation

  • Risk & Compliance Management

  • Performance Measurement & Improvement

  • Others (Outsourcing Advisory, Quality Assurance)

Request for Segment Customization as per your Business Requirement: Segment Customization Request

Regional Coverage: 

North America

  • US

  • Canada

Europe

  • Germany

  • France

  • UK

  • Italy

  • Spain

  • Poland

  • Russia

  • Rest of Europe

Asia Pacific

  • China

  • India

  • Japan

  • South Korea

  • Australia

  • ASEAN Countries

  • Rest of Asia Pacific

Middle East & Africa

  • UAE

  • Saudi Arabia

  • Qatar

  • South Africa

  • Rest of Middle East & Africa

Latin America

  • Brazil

  • Argentina

  • Mexico

  • Colombia

  • Rest of Latin America

Request for Country Level Research Report: Country Level Customization Request

Available Customization 

With the given market data, SNS Insider offers customization as per the company’s specific needs. The following customization options are available for the report: 

  • Detailed Volume Analysis 

  • Criss-Cross segment analysis (e.g. Product X Application) 

  • Competitive Product Benchmarking 

  • Geographic Analysis 

  • Additional countries in any of the regions 

  • Customized Data Representation 

  • Detailed analysis and profiling of additional market players

Explore Key Insights.


  • Analyzes market trends, forecasts, and regional dynamics
  • Covers core offerings, innovations, and industry use cases
  • Profiles major players, value chains, and strategic developments
  • Highlights innovation trends, regulatory impacts, and growth opportunities
Request an Analyst Call