Ophthalmic Diagnostic Devices Market Report Scope & Overview:
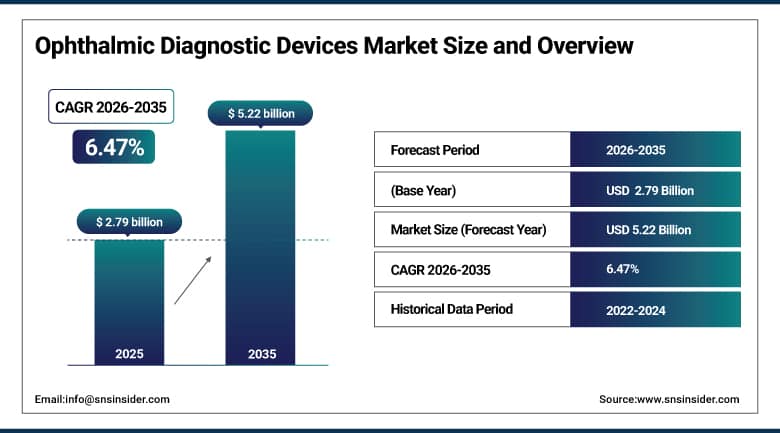
The Ophthalmic Diagnostic Devices Market size was valued at USD 2.79 billion in 2025 and is expected to reach USD 5.22 billion by 2035, growing at a CAGR of 6.47% over the forecast period of 2026–2035.
The global ophthalmic diagnostic devices market is experiencing robust expansion driven by the rising global prevalence of ocular diseases including glaucoma, diabetic retinopathy, age-related macular degeneration (AMD), and cataracts. With over 2.2 billion people worldwide affected by vision impairment or blindness, and an aging global population placing unprecedented pressure on eye care systems, the demand for advanced diagnostic solutions continues to accelerate. Market growth is further reinforced by the rapid integration of artificial intelligence into imaging platforms, the proliferation of portable and handheld ophthalmic devices, and expanding screening programs in emerging economies. Healthcare providers worldwide are increasing capital expenditures on next-generation optical coherence tomography systems, fundus cameras, and aberrometer technologies to achieve earlier disease detection, reduce preventable blindness, and improve patient throughput in high-volume clinical environments.
For instance, in January 2024, the World Health Organization reported that approximately 80 million people globally were living with glaucoma, with projections estimating this figure will rise to 111.8 million by 2040, creating a substantial and sustained demand for early-stage diagnostic ophthalmic devices across both developed and developing markets.
Ophthalmic Diagnostic Devices Market Size and Forecast:
-
Market Size in 2025: USD 2.79 billion
-
Market Size by 2035: USD 5.22 billion
-
CAGR: 6.47% from 2026 to 2035
-
Base Year: 2025
-
Forecast Period: 2026–2035
-
Historical Data: 2022–2024
To Get More Information On Ophthalmic Diagnostic Devices Market - Request Free Sample Report
Ophthalmic Diagnostic Devices Market Trends:
-
Widespread adoption of AI-assisted optical coherence tomography (OCT) and fundus imaging platforms to enable automated lesion detection, reducing diagnostic turnaround time by up to 40% in high-volume ophthalmic clinics.
-
Growing deployment of handheld and portable ophthalmic diagnostic devices in primary care settings, rural screening programs, and teleophthalmology initiatives to expand access beyond traditional hospital environments.
-
Integration of swept-source OCT and wide-field retinal imaging technologies into standard diagnostic workflows, allowing clinicians to visualize peripheral retinal pathologies with greater resolution and accuracy.
-
Rising adoption of multimodal imaging platforms that combine OCT, fundus autofluorescence, and fluorescein angiography into single-device solutions, improving diagnostic comprehensiveness and clinical efficiency.
-
Increased use of cloud-connected diagnostic systems enabling remote data access, tele-screening, and real-time specialist consultation across distributed care networks and multi-site hospital groups.
-
Surge in demand for corneal topography and wavefront aberrometry systems driven by the global boom in refractive surgery procedures, with over 10 million LASIK procedures performed annually worldwide.
-
Strengthening reimbursement frameworks in North America and Europe for advanced ophthalmic imaging procedures, encouraging provider investment in next-generation diagnostic technologies.
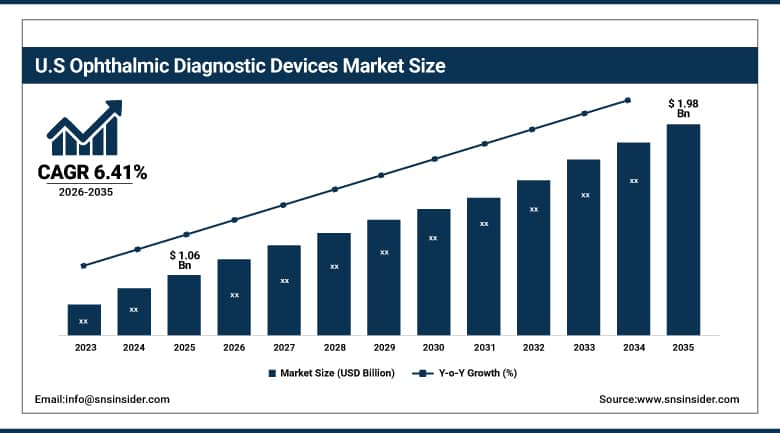
The U.S. Ophthalmic Diagnostic Devices Market was valued at USD 1.06 billion in 2025 and is expected to reach USD 1.98 billion by 2035, growing at a CAGR of 6.41% from 2026–2035. The United States dominates the regional landscape on the strength of a highly developed ophthalmic care infrastructure, favorable Medicare and private insurance reimbursement policies for diagnostic imaging, and a concentrated base of leading device manufacturers and academic medical centers conducting next-generation ophthalmic research. The prevalence of diabetes-related eye disease, which affects an estimated 8.2 million Americans aged 40 and older, continues to fuel clinical demand for retinal diagnostic platforms, while the country's robust adoption of electronic health records and imaging informatics systems supports seamless integration of ophthalmic devices into existing clinical workflows.
Ophthalmic Diagnostic Devices Market Growth Drivers:
-
Rising Global Burden of Ocular Diseases is Driving the Ophthalmic Diagnostic Devices Market Growth
The escalating global incidence of sight-threatening conditions represents the primary growth catalyst for the ophthalmic diagnostic devices market. Diabetic retinopathy currently affects approximately 103 million people worldwide, with projections indicating a rise to 160 million by 2045, while AMD affects over 196 million globally. These epidemiological trends are compelling health systems to invest in systematic, scalable diagnostic infrastructure. Government-led national eye health programs, population-wide diabetic eye screening mandates, and school-based vision testing initiatives are accelerating device procurement across hospitals, ophthalmic specialty clinics, and community screening centers, directly expanding the addressable market base for both premium and mid-range diagnostic platforms.
For instance, in March 2024, the U.S. Centers for Disease Control and Prevention (CDC) reported that only 60% of Americans with diabetes received the recommended annual dilated eye examination, underscoring a significant unmet screening need and the consequent market opportunity for automated, AI-enabled retinal diagnostic devices in primary care and endocrinology settings.
Ophthalmic Diagnostic Devices Market Restraints:
-
High Device Acquisition Costs and Limited Reimbursement in Emerging Markets are Hampering Ophthalmic Diagnostic Devices Market Growth
The elevated capital cost of advanced ophthalmic diagnostic platforms with premium OCT systems priced between USD 50,000 and USD 150,000 presents a significant barrier to adoption among smaller independent practices, community hospitals, and healthcare providers in low- and middle-income countries. Inconsistent or absent reimbursement frameworks for diagnostic imaging procedures in markets across Southeast Asia, Latin America, and Sub-Saharan Africa further constrain device penetration in regions with high disease burden. Additionally, the requirement for skilled ophthalmic technicians to operate sophisticated imaging equipment limits deployment in areas facing healthcare workforce shortages, restricting market expansion in otherwise high-potential geographies.
Ophthalmic Diagnostic Devices Market Opportunities:
-
AI Integration and Teleophthalmology Expansion Create Significant Future Growth Opportunities for the Ophthalmic Diagnostic Devices Market
The convergence of artificial intelligence, machine learning, and ophthalmic imaging technology is generating transformative market opportunities by enabling automated disease detection, risk stratification, and longitudinal monitoring at scale. AI algorithms trained on millions of retinal images have achieved diagnostic accuracy exceeding 90% for diabetic retinopathy and AMD, facilitating autonomous screening in primary care environments without on-site ophthalmologists. Simultaneously, the rapid expansion of teleophthalmology accelerated by pandemic-era adoption is driving demand for cloud-connected, remotely operated diagnostic devices capable of transmitting high-resolution images for specialist review. These combined trends are unlocking new deployment models in retail pharmacies, primary care networks, and mobile health units, meaningfully expanding the total addressable market beyond traditional ophthalmic care settings.
For instance, in July 2024, the FDA cleared a total of 17 AI-based ophthalmic diagnostic software solutions under its De Novo and 510(k) pathways, reflecting accelerating regulatory acceptance of autonomous diagnostic tools and opening new commercial channels for integrated AI-device platforms in the U.S. market.
Ophthalmic Diagnostic Devices Market Segment Analysis
-
By product type, optical coherence tomography held the largest share of approximately 37.82% in 2025, while the aberrometer & topography systems segment is expected to register the highest growth with a CAGR of 7.34%.
-
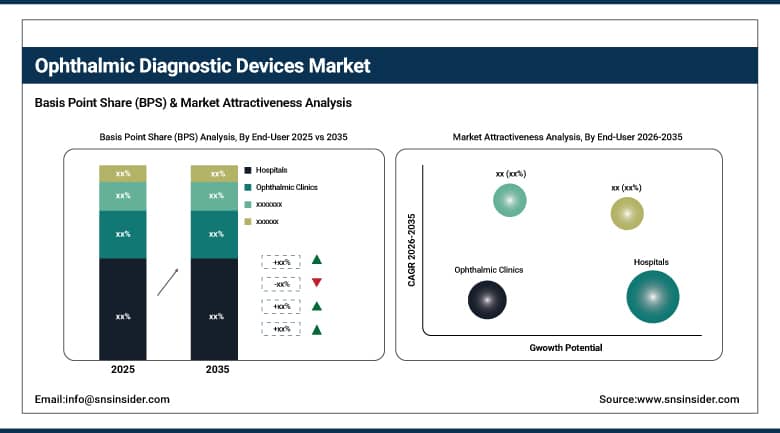
By end-user, hospitals dominated the market with approximately 51.64% share in 2025, while the ophthalmic clinics segment is expected to register the highest growth with a CAGR of 7.12%.
By End-User, Hospitals Lead, While Ophthalmic Clinics Register Fastest Growth
The hospitals segment accounted for the largest end-user share of approximately 51.64% in 2025, underpinned by high patient volumes, comprehensive reimbursement coverage, multi-disciplinary care integration, and the financial capacity to invest in premium imaging systems across ophthalmology, neurology, and endocrinology departments. Academic medical centers and large hospital networks also serve as early adopters of next-generation diagnostic platforms, influencing broader market uptake. Concurrently, the ophthalmic clinics segment is projected to grow at the fastest CAGR of 7.12% through 2035, as independent and group specialty practices expand their diagnostic capabilities to compete with hospital-based services, attract surgical referrals, and meet growing patient demand for comprehensive, one-stop ocular health evaluations in convenient outpatient settings.
By Product Type, Optical Coherence Tomography Leads the Market, While Aberrometer & Topography Systems Register Fastest Growth
The optical coherence tomography segment accounted for the highest revenue share of approximately 37.82% in 2025, attributed to its unmatched clinical utility in diagnosing glaucoma, AMD, diabetic macular edema, and vitreoretinal disorders at microscopic resolution. OCT has become the standard of care in retinal and glaucoma practices globally, with over 30 million OCT procedures performed annually in the U.S. alone, reinforcing its dominant market position. Swept-source OCT and OCT angiography variants are further broadening clinical applications, supporting premium pricing and sustained investment from leading manufacturers. In contrast, the aberrometer & topography systems segment is anticipated to achieve the highest CAGR of 7.34% during 2026–2035, driven by the global refractive surgery boom, rising demand for precise corneal mapping in cataract pre-operative planning, and growing adoption of wavefront-guided laser correction platforms by high-volume surgical eye centers.
Ophthalmic Diagnostic Devices Market Regional Highlights:
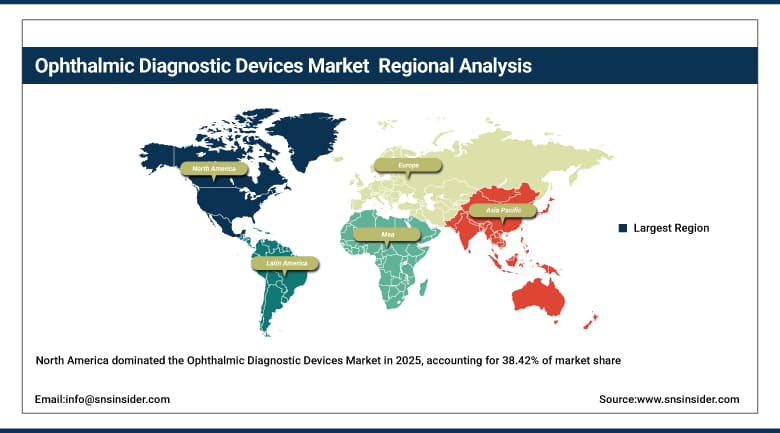
North America Ophthalmic Diagnostic Devices Market Insights:
North America held the largest revenue share of approximately 38.42% in 2025, driven by the combination of high disease prevalence, technologically advanced healthcare infrastructure, strong reimbursement policies under Medicare and commercial insurers, and the concentrated presence of global device manufacturers and R&D centers. The region benefits from robust early-adoption dynamics, with U.S. ophthalmologists among the earliest to integrate AI-enhanced OCT, ultra-widefield fundus imaging, and anterior segment tomography platforms into routine clinical practice. Regulatory clarity from the FDA and continued investment by major healthcare systems in ophthalmic diagnostic infrastructure are expected to sustain North America's market leadership across the forecast period.
Get Customized Report as Per Your Business Requirement - Enquiry Now
Asia Pacific Ophthalmic Diagnostic Devices Market Insights:
Asia Pacific is the fastest-growing region in the ophthalmic diagnostic devices market, projected to expand at a CAGR of 8.19% through 2035, fueled by a rapidly aging population, the world's highest burden of myopia—with over 1 billion people in East Asia currently affected and escalating rates of diabetic eye disease linked to the region's diabetes epidemic. China, India, Japan, and South Korea are primary growth contributors, supported by increasing government investment in national eye health programs, hospital infrastructure modernization, and the expansion of ophthalmic specialty clinic networks in tier-2 and tier-3 cities. Growing medical tourism for refractive and cataract surgery procedures, particularly in India and Thailand, is simultaneously driving device adoption in surgical planning and post-operative monitoring applications across the region.
Europe Ophthalmic Diagnostic Devices Market Insights:
Europe is the second-largest regional market for ophthalmic diagnostic devices, supported by well-established public health systems with structured diabetic retinopathy screening programs in the UK, Germany, France, and Scandinavia. The European market benefits from strong government-funded national screening initiatives, with the UK's NHS diabetic eye screening program examining over 3 million patients annually, creating consistent and high-volume demand for retinal imaging systems. GDPR-compliant cloud imaging platforms and EU Medical Device Regulation (MDR) compliance frameworks are shaping device procurement patterns, while growing investment in AI-driven diagnostic solutions across European academic ophthalmology centers is advancing market sophistication.
Latin America (LATAM) and Middle East & Africa (MEA) Ophthalmic Diagnostic Devices Market Insights:
In Latin America and the Middle East & Africa, expanding access to ophthalmic care through public health investment, growing private ophthalmology clinic networks, and international NGO-led vision screening programs are collectively supporting market development. Brazil and Mexico lead LATAM adoption, while the UAE, Saudi Arabia, and South Africa represent the primary MEA markets, driven by healthcare infrastructure modernization and growing medical tourism ecosystems. Affordably priced portable fundus cameras and cost-effective anterior segment diagnostic systems are gaining traction across both regions as providers seek scalable solutions for population-level eye disease screening within constrained healthcare budgets.
Ophthalmic Diagnostic Devices Market Competitive Landscape:
Carl Zeiss Meditec AG (est. 1846) is a global leader in ophthalmic medical technology, offering a comprehensive portfolio spanning OCT systems, fundus cameras, surgical microscopes, and refraction solutions. The company leverages its long-standing clinical partnerships, proprietary CIRRUS and CLARUS imaging platforms, and deep R&D investments to maintain its position at the forefront of ophthalmic diagnostics.
-
In February 2025, Carl Zeiss Meditec launched the CIRRUS HD-OCT 6000 with integrated AI-powered retinal layer segmentation and automated AMD progression tracking, expanding its diagnostic automation capabilities for high-volume retinal practices globally.
Topcon Corporation (est. 1932) is a multinational precision optics and medical imaging company delivering a broad range of ophthalmic diagnostic platforms including swept-source OCT, digital fundus cameras, corneal topographers, and slit lamps. Topcon strategically invests in cloud connectivity and AI analytics to enable network-wide retinal screening programs for large health systems and national diabetic eye disease initiatives.
-
In August 2024, Topcon Corporation introduced its Maestro2 OCT system with enhanced wide-field retinal imaging and automated diabetic retinopathy severity scoring, expanding deployment across primary care and endocrinology practices in North America and Europe.
Heidelberg Engineering GmbH (est. 1990) is a specialist ophthalmic imaging company recognized globally for its Spectralis OCT platform, confocal scanning laser ophthalmoscopy systems, and the Heidelberg Edge Perimeter. The company's focus on high-resolution multimodal retinal imaging and longitudinal disease monitoring tools has established it as the preferred platform among academic glaucoma and retinal research centers worldwide.
-
In November 2024, Heidelberg Engineering received CE Mark approval for its AI-based glaucoma progression analysis module within the Spectralis platform, enabling automated detection of structural retinal nerve fiber layer changes across longitudinal patient datasets.
Ophthalmic Diagnostic Devices Market Key Players:
-
Carl Zeiss Meditec AG
-
Topcon Corporation
-
Heidelberg Engineering GmbH
-
Nidek Co., Ltd.
-
Canon Medical Systems Corporation
-
Haag-Streit Group
-
Optovue, Inc.
-
Alcon Inc.
-
Bausch + Lomb
-
Optos plc
-
Icare Finland Oy
-
Kowa Company, Ltd.
-
Tomey Corporation
-
Reichert Technologies
-
Quantel Medical
-
Huvitz Co., Ltd.
-
Visionix Ltd.
-
CenterVue SpA
-
Lumenis Ltd.
-
Essilor Instruments
| Report Attributes | Details |
|---|---|
| Market Size in 2025 | USD 2.79 Billion |
| Market Size by 2035 | USD 5.22 Billion |
| CAGR | CAGR of 6.47% From 2026 to 2035 |
| Base Year | 2025 |
| Forecast Period | 2026-2035 |
| Historical Data | 2022-2024 |
| Report Scope & Coverage | Market Size, Segments Analysis, Competitive Landscape, Regional Analysis, DROC & SWOT Analysis, Forecast Outlook |
| Key Segments | • By Product Type (Optical Coherence Tomography, Aberrometer & Topography Systems, Fundus Camera, Ophthalmic Ultrasound, and Other Devices) • By End-user (Hospitals, Ophthalmic Clinics, and Others) |
| Regional Analysis/Coverage | North America (US, Canada, Mexico), Europe (Eastern Europe [Poland, Romania, Hungary, Turkey, Rest of Eastern Europe] Western Europe] Germany, France, UK, Italy, Spain, Netherlands, Switzerland, Austria, Rest of Western Europe]), Asia Pacific (China, India, Japan, South Korea, Vietnam, Singapore, Australia, Rest of Asia Pacific), Middle East & Africa (Middle East [UAE, Egypt, Saudi Arabia, Qatar, Rest of Middle East], Africa [Nigeria, South Africa, Rest of Africa], Latin America (Brazil, Argentina, Colombia, Rest of Latin America) |
| Company Profiles | Carl Zeiss Meditec AG, Topcon Corporation, Heidelberg Engineering GmbH, Nidek Co., Ltd., Canon Medical Systems Corporation, Haag-Streit Group, Optovue, Inc., Alcon Inc., Bausch + Lomb, Optos plc, Icare Finland Oy, Kowa Company, Ltd., Tomey Corporation, Reichert Technologies, Quantel Medical, Huvitz Co., Ltd., Visionix Ltd., CenterVue SpA, Lumenis Ltd., Essilor Instruments |
Frequently Asked Questions
The market was valued at USD 2.79 billion in 2025 and is projected to reach USD 5.22 billion by 2035, growing at a CAGR of 6.47%.
The market is primarily driven by the rising prevalence of eye diseases such as glaucoma, diabetic retinopathy, AMD, and cataracts, along with increasing adoption of AI-powered diagnostic imaging technologies.
High device costs and limited reimbursement in emerging markets are major barriers to widespread adoption.
Optical Coherence Tomography (OCT) leads with approximately 37.82% market share in 2025, supported by over 30 million OCT procedures annually in the U.S. alone.
Asia Pacific is growing at a CAGR of 8.19%, driven by over 1 billion people affected by myopia and rapidly increasing diabetic eye disease cases.
Get in Touch
