Over-the-top (OTT) Market Size & Overview:
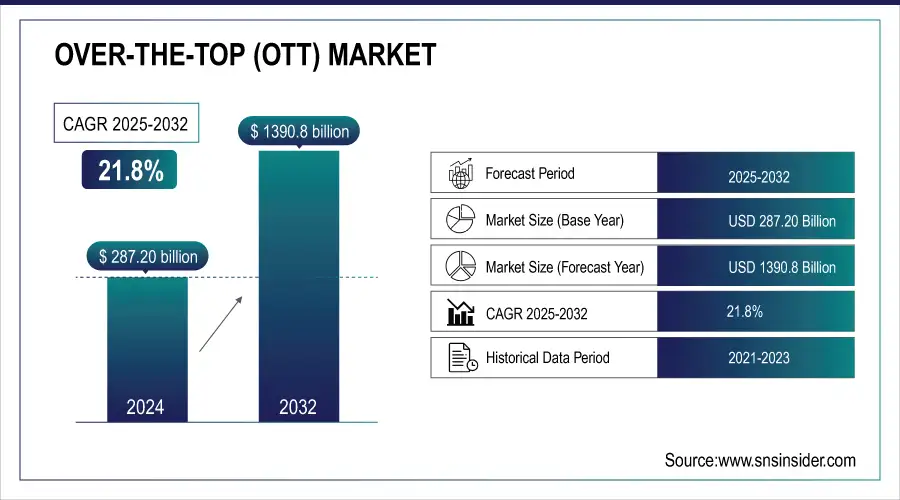
Over-the-Top (OTT) Market size was valued at USD 287.20 Billion in 2024 and is expected to grow to USD 1390.8 Billion by 2032 and grow at a CAGR of 21.8% over the forecast period of 2025-2032.

Get more information on Over-the-top (OTT) Market - Request Sample Report
The over-the-top market is growing with the increasing internet penetration rates and the rapid expansion of streaming services. According to the International Telecommunication Union 2023, global internet penetration reached 64% in 2023, with substantial growth observed in developing nations. The Federal Communications Commission states that more than 90% of Americans now have access to high-speed internet.

Key Trends Shaping the Over-the-Top (OTT) Market:
-
Content Diversification & Original Programming: Increasing demand for diverse and original content drives OTT platforms to invest heavily in exclusive shows, movies, and regional programming.
-
Rising Internet Penetration & Mobile Adoption: Expansion of high-speed internet and smartphone usage accelerates OTT consumption, enabling users to stream content anytime, anywhere.
-
Subscription & Freemium Models: Growing preference for flexible subscription plans and ad-supported freemium models allows platforms to attract a wider audience and increase revenue streams.
-
Technological Integration: Use of AI, machine learning, and recommendation algorithms enhances personalized viewing experiences and user engagement.
-
Multi-Device Streaming: Support for smartphones, smart TVs, tablets, and connected devices improves accessibility and convenience for viewers.
-
Competitive Landscape: Intense competition among global OTT platforms and local players drives partnerships, mergers, and innovative service offerings.
Over-the-Top (OTT) Market Drivers:
-
The increasing adoption of 3G, 4G, and 5G technologies is enhancing consumer access to cloud streaming platforms, leading to a significant shift from traditional media consumption to online streaming.
-
The trend towards targeted advertisement-based streaming apps allows for personalized content delivery, attracting a wider audience and enhancing user engagement.
One of the key drivers in the Over-the-Top market is the shifting preference for cloud streaming services. With the ongoing development of mobile and broadband technologies such as 4G and 5G, this shift allows OTT consumers to access a wider range of media formats, and view them on a variety of devices. More specifically, with 5G approaching, the streaming quality will undoubtedly improve, which refers to faster data speed and reduced latency. For example, this year, 14.0% of U.S. households have completely replaced traditional cable television with OTT, and the percentage of OTT users across the U.S. is over 48%, whereas the situation in India and China is less promising in terms of prospects. This is actively supported by Netflix, Hulu, and Amazon Prime Video, which continue to expand their original content and become even more competitive. In 2023, Amazon announced a collaboration with several regional OTT platforms in India, highlighting the growing integration of diverse content offerings tailored to local audiences.
One of the primary reasons for this is that such services are often offered to broad audiences and most of them on a freemium or free-trial basis, meaning that most of the online consumers try OTT service without any commitment. Overall, the shift in demand from traditional cable television to cloud-based consumption cannot just result in an improved experience but also provide unique opportunities for content providers to collect corresponding data and improve the personalization and recommendation algorithms.
Over-the-Top (OTT) Market Restraints:
-
The increasing number of OTT platforms leads to fierce competition, which may result in price wars and reduced profit margins for service providers.
-
The complexities surrounding content licensing and distribution rights can limit the availability of popular shows and movies, potentially affecting user satisfaction and subscription rates.
The significant restraint in the Over-the-Top market is related to content licensing and rights. The reason is the complexity and ongoing difficulties that arise in this sphere. Thus, numerous OTT platforms face challenges in imparting popular content due to the necessity to access the rights to it. Considering whether various legal matters are resolved, it is complex for the platforms to ensure that a given show or movie is accessible. For example, in 2023, the continuous disputes and negotiations on who has the licenses to provide a range of shows and films on streaming led to the extended delay in their arrival on many platforms. Another aspect of the problem is that the majority of OTT providers, inclusive of Netflix, Amazon Prime Video, and others, find it difficult to access the exclusive content and lose money on it or even potential subscribers in case it is not accessible. A recent survey indicated that 68% of consumers claim that the availability of exclusive content considerably defines the platform where it can be found. Therefore, the problem is crucial as licensing and rights are often distinguished for the problematic factors that influence the functioning.
Over-the-Top (OTT) Market Segment analysis
-
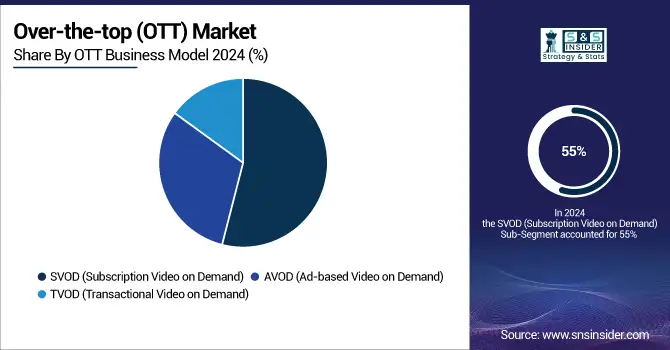
By OTT Business Model, Subscription Video-on-Demand Dominates, While Ad-Based Services Gain Traction
The subscription video-on-demand segment held the largest market share of 55% in 2024. The increasing growth of this segment can be attributed to the massive consumer preference for an ad-free on-demand facility wherein users can utilize the service to pick and watch their favorite shows and movies at their convenience. According to the report by the European Audiovisual Observatory, subscriptions to streaming services grew by over 20% in Europe between 2022 and 2023. The growth of giants such as Netflix, Amazon Prime Video, and Disney+ has led to the competitive landscape of consumers willing to shell out money for good content.
In addition, the ad-based video-on-demand is also anticipated to witness a significant growth rate during the forecast period. The report expects that the segment will grow at a significant CAGR from 2024 to 2032. The growth of this segment is attributed to the increasing popularity of free streaming facilities accompanied by heavy advertisements for people looking for budget-friendly options. The demand for ad-based video-on-demand options is also attributed to government initiatives to promote the production of local content. In 2023, the Australian government invested AUD 30 million to promote local content in streaming services. Various governments are doing this to assert the need for diverse media options. This dynamic shift in the OTT business model reflects a broader trend where consumers are gravitating towards customized viewing experiences, thereby influencing market growth.

-
By Service Verticals, Gaming Emerges as the Leading OTT Service Vertical, Driven by Cloud Gaming and Government Support
The Gaming service vertical held the largest share of the market within the OTT sector. The gaming industry has followed unprecedented growth, becoming one of the most rapidly expanding sectors and products throughout the past decade. As of 2023, the global gaming market’s value will exceed USD 200 billion, according to the ESA. In addition to the sector’s natural growth potential, the ascent of cloud gaming services, represented by Google Stadia, NVIDIA GeForce Now, and other analogs, have greatly facilitated access to high-quality game experience as individuals no longer require expensive consoles or a high-powered PC to play the latest games. The younger audiences, while being of interest to OTC providers for subscription opportunities, particularly benefit from the increased accessibility, resource efficiency, and convenience of cloud gaming. The growth of gaming revenues is further encouraged by various forms of governmental support, as the South Korean administrator recently pledged in the form of USD 1.5 billion to be invested in the local gaming sector as a part of the enhanced focus on the digital economy. In conjunction with the reports finding that over 70% of U.S. gamers are willing to invest in premium gaming experiences with their funds, the gaming service vertical promises one of the largest shares of the OTT market, already attracting a significant portion of the current gaming audience by taking advantage of the technological developments and a permissive regulatory environment.
-
By Platform, Smart TVs and Set-Top Boxes Lead, While Smartphones Drive Mobile OTT Consumption
In 2024, the Smart TVs and set-top boxes segment held the largest market share accounting for over 38%. The reason for the increasing popularity of the identified devices is that the progress in streaming has been achieved in combination with the growing number of smart TVs adopted by customers. In particular, the report reveals that by 2024, the sale of smart TVs is expected to exceed 200 million units, which demonstrates a significant tendency. This is also facilitated by government efforts aimed to support the implementation of corresponding digital television standards with the U.S. Federal Communications Commission leading the way to the all-digital broadcasting system.
The smartphone segment held a significant share in 2024, due to the growth of mobile devices used for streaming. For instance, as GSMA highlights, more than 6.5 billion people across the globe used smartphones while the consumption of mobile video OTT content increased by 40% in 2024. The ease of access to OTT services via smartphones has allowed users to consume content anytime and anywhere, further propelling the market. As both smart TVs and smartphones play pivotal roles in delivering OTT content, they will continue to shape the dynamics of the market.
Over-the-Top (OTT) Market Regional Analysis:
-
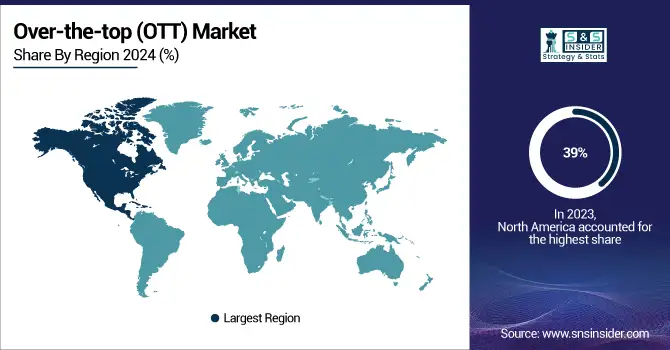
North America Over-the-Top (OTT) Market Insights
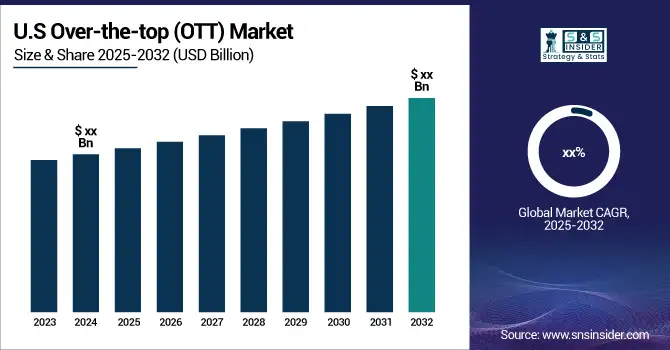
In 2024, North America dominates the Over-the-Top (OTT) Market with an estimated share of 39%, driven by high broadband penetration, technological adoption, and strong consumer preference for streaming platforms. The region benefits from established Over-the-Top (OTT) platforms, advanced digital infrastructure, and widespread smartphone and smart TV usage, enabling seamless streaming experiences. The United States leads the North American market due to the presence of global streaming giants like Netflix, Disney+, and Amazon Prime Video, high consumer willingness to pay for subscriptions, and strong content creation capabilities, reinforcing its position as a key market driver.

Need any customomization data on Over-the-top (OTT) Market - Enquiry Now
-
Asia Pacific Over-the-Top (OTT) Market Insights
Asia Pacific is the fastest-growing Over-the-Top (OTT) region with an estimated CAGR in 2024, driven by rising internet penetration, smartphone adoption, and growing demand for localized streaming content. Countries like China, India, and Japan are witnessing rapid digital transformation, government initiatives supporting digital media, and increasing entertainment consumption. China dominates the regional market due to its large population, widespread mobile internet access, and robust local Over-the-Top (OTT) platforms like iQIYI and Tencent Video, which cater to diverse consumer preferences and accelerate market growth.
-
Europe Over-the-Top (OTT) Market Insights
In 2024, Europe holds a significant share of the Over-the-Top (OTT) Market, driven by rising digital content consumption, high smartphone penetration, and increasing demand for on-demand services. Regulatory frameworks supporting local content production and cross-border streaming initiatives further drive growth. The United Kingdom dominates the European Over-the-Top (OTT) Market due to strong media production capabilities, high internet penetration, and early adoption of subscription-based streaming services. UK consumers show a strong willingness to pay for premium content, reinforcing the country’s leadership position in Europe.
-
Latin America and Middle East & Africa Over-the-Top (OTT) Market Insights
The Over-the-Top (OTT) Market in Latin America and Middle East & Africa is witnessing steady growth, driven by rising smartphone adoption, affordable internet, and increasing demand for mobile entertainment. Government initiatives and investments in digital infrastructure support market expansion. Brazil leads Latin America with its large subscriber base, growing mobile-first consumer segment, and expanding local content platforms. In Middle East & Africa, the United Arab Emirates dominates due to high digital connectivity, government smart initiatives, and increasing preference for international and regional streaming services.
Competitive Landscape Over-the-Top (OTT) Market:
Amazon Web Services (AWS):
Amazon Web Services (AWS) is a leading global cloud computing platform providing scalable infrastructure, storage, and computing solutions across industries, including media and entertainment. In the Over-the-Top (OTT) Market, AWS plays a pivotal role by offering cloud-based video streaming, content delivery networks, and analytics tools that enable media companies to distribute high-quality, on-demand content efficiently. Its flexible and secure cloud services support broadcasters, OTT platforms, and production houses in managing large-scale video workloads, optimizing performance, and reducing latency. AWS’s innovations in AI, machine learning, and serverless computing enhance user experiences, accelerate content delivery, and drive digital transformation in the OTT ecosystem.
-
In December 2024, Amazon Web Services (AWS) organized a conference featuring several services and announcements with various best practices shared by AWS executives, customers, and partners. The conference focused on three themes: generative artificial intelligence, digital sovereignty, and security.
Ultra Media & Entertainment Group:
Ultra Media & Entertainment Group is a prominent player in content creation, distribution, and media services, specializing in delivering high-quality entertainment across digital platforms. In the Over-the-Top (OTT) Market, the company focuses on producing and distributing streaming content, leveraging advanced technologies for video delivery, audience engagement, and content personalization. By integrating data analytics, AI-driven recommendations, and cloud-based infrastructure, Ultra Media & Entertainment Group enhances viewer experiences, optimizes content performance, and supports monetization strategies for streaming services. Its expertise in multi-platform content management and digital media solutions positions the company as a key contributor to the evolving OTT ecosystem.
-
In September 2024, Ultra Media & Entertainment Group announced investment of Rs 500 crore to launch two new over-the-top (OTT) platforms, Ultra Play and Ultra Gaane, while also bolstering its existing Marathi platform, Ultra Jhakaas.
Over-the-Top (OTT) Market Companies:
-
Disney+
-
Amazon Web Services (AWS)
-
Apple TV+
-
Ultra Media & Entertainment Group
-
Paramount+
-
Peacock
-
Sony Crackle
-
Vudu
-
Roku
-
Tubi TV
-
BBC iPlayer
-
Discovery+
-
Crunchyroll
-
FuboTV
-
BritBox
-
Funimation
-
Pluto TV
Report Attributes | Details |
Market Size in 2024 | USD 287.20 Billion |
Market Size by 2032 | USD 1390.8 Billion |
CAGR | CAGR of 21.8% From 2025 to 2032 |
Base Year | 2024 |
Forecast Period | 2025-2032 |
Historical Data | 2021-2023 |
Report Scope & Coverage | Market Size, Segments Analysis, Competitive Landscape, Regional Analysis, DROC & SWOT Analysis, Forecast Outlook |
Key Segments | • By Type (OTT Services, OTT Devices) • By Streaming Devices (Smartphones and Tablets, Desktops and Laptops, IPTV and Consoles) • By OTT Business Model (AVOD (Ad-based Video on Demand), SVOD (Subscription Video on Demand), TVOD (Transactional Video on Demand)) • By service verticals (Media and Entertainment, Education and Learning, Gaming, Service Utilities) • By Platform (Smart Phones, Smart TVs & Set-top Box, Desktop & Laptop, Others) |
Regional Analysis/Coverage | North America (US, Canada), Europe (Germany, UK, France, Italy, Spain, Russia, Poland, Rest of Europe), Asia Pacific (China, India, Japan, South Korea, Australia, ASEAN Countries, Rest of Asia Pacific), Middle East & Africa (UAE, Saudi Arabia, Qatar, South Africa, Rest of Middle East & Africa), Latin America (Brazil, Argentina, Mexico, Colombia, Rest of Latin America). |
Company Profiles |
Netflix, Amazon Prime Video, Disney+, Hulu, Apple TV+, HBO Max, YouTube, Paramount+, Peacock, Sony Crackle, Vudu, Roku, Tubi TV, BBC iPlayer, Discovery+, Crunchyroll, FuboTV, BritBox, Funimation, Pluto TV |
Table Of Contents
1. Introduction
1.1 Market Definition & Scope
1.2 Research Assumptions & Abbreviations
1.3 Research Methodology
2. Executive Summary
2.1 Market Snapshot
2.2 Market Absolute $ Opportunity Assessment & Y-o-Y Analysis, 2021–2032
2.3 Market Size & Forecast, By Segmentation, 2021–2032
2.3.1 Market Size By Type
2.3.2 Market Size By Streaming Devices
2.3.2 Market Size By OTT Business Model
2.3.2 Market Size By Service Verticals
2.3.2 Market Size By Platform
2.4 Market Share & BPS Analysis By Region, 2024
2.5 Industry Growth Scenarios – Conservative, Likely & Optimistic
2.6 Industry CxO’s Perspective
3. Market Overview
3.1 Market Dynamics
3.1.1 Drivers
3.1.2 Restraints
3.1.3 Opportunities
3.1.4 Key Market Trends
3.2 Industry PESTLE Analysis
3.3 Key Industry Forces (Porter’s) Impacting Market Growth
3.4 Industry Supply Chain Analysis
3.4.1 Raw Material Suppliers
3.4.2 Manufacturers
3.4.3 Distributors/Suppliers
3.4.4 Customers/End-Users
3.5 Industry Life Cycle Assessment
3.6 Parent Market Overview
3.7 Market Risk Assessment
4. Statistical Insights & Trends Reporting
4.1 Performance & Streaming Metrics
4.1.1 Average video streaming quality (resolution, bitrate, HDR support) by platform
4.1.2 Average buffering time (seconds) and playback latency (ms)
4.1.3 Average concurrent streams per account/device
4.1.4 CDN (Content Delivery Network) efficiency and regional content delivery speed (Mbps)
4.2 Adoption & Deployment Trends
4.2.1 Market share by content type: video-on-demand (VOD), live streaming, music, gaming (%)
4.2.2 Adoption rate by device type: smart TVs, smartphones, tablets, PCs, gaming consoles (%)
4.2.3 Year-on-year growth in OTT subscriptions globally and regionally
4.2.4 Share of subscription-based vs. ad-supported models (%)
4.3 Technology & Platform Metrics
4.3.1 Adoption rate of adaptive streaming technologies (HLS, DASH, CMAF) (%)
4.3.2 Integration rate with AI/ML for content recommendation and personalization (%)
4.3.3 Usage of cloud-based OTT platforms vs. on-premises streaming solutions (%)
4.3.4 Trends in multi-platform and cross-device streaming capabilities (%)
4.4 Cost & Revenue Metrics
4.4.1 Average subscription cost (USD/month) by platform type
4.4.2 Average revenue per user (ARPU) by region and platform
4.4.3 Cost breakdown: content acquisition, streaming infrastructure, marketing (%)
4.4.4 Regional variation in subscription prices and ad revenue share (%)
5. Over-the-Top (OTT) Market Segmental Analysis & Forecast, By Type, 2021 – 2032, Value (USD Billion)
5.1 Introduction
5.2 OTT Services
5.2.1 Key Trends
5.2.2 Market Size & Forecast, 2021 – 2032
5.3 OTT Devices
5.3.1 Key Trends
5.3.2 Market Size & Forecast, 2021 – 2032
6. Over-the-Top (OTT) Market Segmental Analysis & Forecast, By Streaming Devices, 2021 – 2032, Value (USD Billion)
6.1 Introduction
6.2 Smartphones and Tablets
6.2.1 Key Trends
6.2.2 Market Size & Forecast, 2021 – 2032
6.3 Desktops and Laptops
6.3.1 Key Trends
6.3.2 Market Size & Forecast, 2021 – 2032
6.4 IPTV and Consoles
6.4.1 Key Trends
6.4.2 Market Size & Forecast, 2021 – 2032
7. Over-the-Top (OTT) Market Segmental Analysis & Forecast, By OTT Business Model, 2021 – 2032, Value (USD Billion)
7.1 Introduction
7.2 AVOD (Ad-based Video on Demand)
7.2.1 Key Trends
7.2.2 Market Size & Forecast, 2021 – 2032
7.3 SVOD (Subscription Video on Demand)
7.3.1 Key Trends
7.3.2 Market Size & Forecast, 2021 – 2032
7.4 TVOD (Transactional Video on Demand)
7.4.1 Key Trends
7.4.2 Market Size & Forecast, 2021 – 2032
8. Over-the-Top (OTT) Market Segmental Analysis & Forecast, By service verticals, 2021 – 2032, Value (USD Billion)
8.1 Introduction
8.2 Media and Entertainment
8.2.1 Key Trends
8.2.2 Market Size & Forecast, 2021 – 2032
8.3 Education and Learning
8.3.1 Key Trends
8.3.2 Market Size & Forecast, 2021 – 2032
8.4 Gaming
8.4.1 Key Trends
8.4.2 Market Size & Forecast, 2021 – 2032
8.5 Service Utilities
8.5.1 Key Trends
8.5.2 Market Size & Forecast, 2021 – 2032
9. Over-the-Top (OTT) Market Segmental Analysis & Forecast, By Platform, 2021 – 2032, Value (USD Billion)
9.1 Introduction
9.2 Smart Phones
9.2.1 Key Trends
9.2.2 Market Size & Forecast, 2021 – 2032
9.3 Smart TVs & Set-top Box
9.3.1 Key Trends
9.3.2 Market Size & Forecast, 2021 – 2032
9.4 Desktop & Laptop
9.4.1 Key Trends
9.4.2 Market Size & Forecast, 2021 – 2032
9.5 Others
9.5.1 Key Trends
9.5.2 Market Size & Forecast, 2021 – 2032
10. Over-the-Top (OTT) Market Segmental Analysis & Forecast By Region, 2021 – 2032, Value (USD Billion)
10.1 Introduction
10.2 North America
10.2.1 Key Trends
10.2.2 Over-the-Top (OTT) Market Size & Forecast, By Type, 2021 – 2032
10.2.3 Over-the-Top (OTT) Market Size & Forecast, By Streaming Devices, 2021 – 2032
10.2.4 Over-the-Top (OTT) Market Size & Forecast, By OTT Business Model, 2021 – 2032
10.2.5 Over-the-Top (OTT) Market Size & Forecast, By service verticals, 2021 – 2032
10.2.6 Over-the-Top (OTT) Market Size & Forecast, By Platform, 2021 – 2032
10.2.7 Over-the-Top (OTT) Market Size & Forecast, By Country, 2021 – 2032
10.2.7.1 USA
10.2.7.1.1 Over-the-Top (OTT) Market Size & Forecast, By Type, 2021 – 2032
10.2.7.1.2 Over-the-Top (OTT) Market Size & Forecast, By Streaming Devices, 2021 – 2032
10.2.7.1.3 Over-the-Top (OTT) Market Size & Forecast, By OTT Business Model, 2021 – 2032
10.2.7.1.4 Over-the-Top (OTT) Market Size & Forecast, By service verticals, 2021 – 2032
10.2.7.1.5 Over-the-Top (OTT) Market Size & Forecast, By Platform, 2021 – 2032
10.2.7.2 Canada
10.2.7.2.1 Over-the-Top (OTT) Market Size & Forecast, By Type, 2021 – 2032
10.2.7.2.2 Over-the-Top (OTT) Market Size & Forecast, By Streaming Devices, 2021 – 2032
10.2.7.2.3 Over-the-Top (OTT) Market Size & Forecast, By OTT Business Model, 2021 – 2032
10.2.7.2.4 Over-the-Top (OTT) Market Size & Forecast, By service verticals, 2021 – 2032
10.2.7.2.5 Over-the-Top (OTT) Market Size & Forecast, By Platform, 2021 – 2032
10.3 Europe
10.3.1 Key Trends
10.3.2 Over-the-Top (OTT) Market Size & Forecast, By Type, 2021 – 2032
10.3.3 Over-the-Top (OTT) Market Size & Forecast, By Streaming Devices, 2021 – 2032
10.3.4 Over-the-Top (OTT) Market Size & Forecast, By OTT Business Model, 2021 – 2032
10.3.5 Over-the-Top (OTT) Market Size & Forecast, By service verticals, 2021 – 2032
10.3.6 Over-the-Top (OTT) Market Size & Forecast, By Platform, 2021 – 2032
10.3.7 Over-the-Top (OTT) Market Size & Forecast, By Country, 2021 – 2032
10.3.7.1 Germany
10.3.7.1.1 Over-the-Top (OTT) Market Size & Forecast, By Type, 2021 – 2032
10.3.7.1.2 Over-the-Top (OTT) Market Size & Forecast, By Streaming Devices, 2021 – 2032
10.3.7.1.3 Over-the-Top (OTT) Market Size & Forecast, By OTT Business Model, 2021 – 2032
10.3.7.1.4 Over-the-Top (OTT) Market Size & Forecast, By service verticals, 2021 – 2032
10.3.7.1.5 Over-the-Top (OTT) Market Size & Forecast, By Platform, 2021 – 2032
10.3.7.2 UK
10.3.7.2.1 Over-the-Top (OTT) Market Size & Forecast, By Type, 2021 – 2032
10.3.7.2.2 Over-the-Top (OTT) Market Size & Forecast, By Streaming Devices, 2021 – 2032
10.3.7.2.3 Over-the-Top (OTT) Market Size & Forecast, By OTT Business Model, 2021 – 2032
10.3.7.2.4 Over-the-Top (OTT) Market Size & Forecast, By service verticals, 2021 – 2032
10.3.7.2.5 Over-the-Top (OTT) Market Size & Forecast, By Platform, 2021 – 2032
10.3.7.3 France
10.3.7.3.1 Over-the-Top (OTT) Market Size & Forecast, By Type, 2021 – 2032
10.3.7.3.2 Over-the-Top (OTT) Market Size & Forecast, By Streaming Devices, 2021 – 2032
10.3.7.3.3 Over-the-Top (OTT) Market Size & Forecast, By OTT Business Model, 2021 – 2032
10.3.7.3.4 Over-the-Top (OTT) Market Size & Forecast, By service verticals, 2021 – 2032
10.3.7.3.5 Over-the-Top (OTT) Market Size & Forecast, By Platform, 2021 – 2032
10.3.7.4 Italy
10.3.7.4.1 Over-the-Top (OTT) Market Size & Forecast, By Type, 2021 – 2032
10.3.7.4.2 Over-the-Top (OTT) Market Size & Forecast, By Streaming Devices, 2021 – 2032
10.3.7.4.3 Over-the-Top (OTT) Market Size & Forecast, By OTT Business Model, 2021 – 2032
10.3.7.4.4 Over-the-Top (OTT) Market Size & Forecast, By service verticals, 2021 – 2032
10.3.7.4.5 Over-the-Top (OTT) Market Size & Forecast, By Platform, 2021 – 2032
10.3.7.5 Spain
10.3.7.5.1 Over-the-Top (OTT) Market Size & Forecast, By Type, 2021 – 2032
10.3.7.5.2 Over-the-Top (OTT) Market Size & Forecast, By Streaming Devices, 2021 – 2032
10.3.7.5.3 Over-the-Top (OTT) Market Size & Forecast, By OTT Business Model, 2021 – 2032
10.3.7.5.4 Over-the-Top (OTT) Market Size & Forecast, By service verticals, 2021 – 2032
10.3.7.5.5 Over-the-Top (OTT) Market Size & Forecast, By Platform, 2021 – 2032
10.3.7.6 Russia
10.3.7.6.1 Over-the-Top (OTT) Market Size & Forecast, By Type, 2021 – 2032
10.3.7.6.2 Over-the-Top (OTT) Market Size & Forecast, By Streaming Devices, 2021 – 2032
10.3.7.6.3 Over-the-Top (OTT) Market Size & Forecast, By OTT Business Model, 2021 – 2032
10.3.7.6.4 Over-the-Top (OTT) Market Size & Forecast, By service verticals, 2021 – 2032
10.3.7.6.5 Over-the-Top (OTT) Market Size & Forecast, By Platform, 2021 – 2032
10.3.7.7 Poland
10.3.7.7.1 Over-the-Top (OTT) Market Size & Forecast, By Type, 2021 – 2032
10.3.7.7.2 Over-the-Top (OTT) Market Size & Forecast, By Streaming Devices, 2021 – 2032
10.3.7.7.3 Over-the-Top (OTT) Market Size & Forecast, By OTT Business Model, 2021 – 2032
10.3.7.7.4 Over-the-Top (OTT) Market Size & Forecast, By service verticals, 2021 – 2032
10.3.7.7.5 Over-the-Top (OTT) Market Size & Forecast, By Platform, 2021 – 2032
10.3.7.8 Rest of Europe
10.3.7.8.1 Over-the-Top (OTT) Market Size & Forecast, By Type, 2021 – 2032
10.3.7.8.2 Over-the-Top (OTT) Market Size & Forecast, By Streaming Devices, 2021 – 2032
10.3.7.8.3 Over-the-Top (OTT) Market Size & Forecast, By OTT Business Model, 2021 – 2032
10.3.7.8.4 Over-the-Top (OTT) Market Size & Forecast, By service verticals, 2021 – 2032
10.3.7.8.5 Over-the-Top (OTT) Market Size & Forecast, By Platform, 2021 – 2032
10.4 Asia-Pacific
10.4.1 Key Trends
10.4.2 Over-the-Top (OTT) Market Size & Forecast, By Type, 2021 – 2032
10.4.3 Over-the-Top (OTT) Market Size & Forecast, By Streaming Devices, 2021 – 2032
10.4.4 Over-the-Top (OTT) Market Size & Forecast, By OTT Business Model, 2021 – 2032
10.4.5 Over-the-Top (OTT) Market Size & Forecast, By service verticals, 2021 – 2032
10.4.6 Over-the-Top (OTT) Market Size & Forecast, By Platform, 2021 – 2032
10.4.7 Over-the-Top (OTT) Market Size & Forecast, By Country, 2021 – 2032
10.4.7.1 China
10.4.7.1.1 Over-the-Top (OTT) Market Size & Forecast, By Type, 2021 – 2032
10.4.7.1.2 Over-the-Top (OTT) Market Size & Forecast, By Streaming Devices, 2021 – 2032
10.4.7.1.3 Over-the-Top (OTT) Market Size & Forecast, By OTT Business Model, 2021 – 2032
10.4.7.1.4 Over-the-Top (OTT) Market Size & Forecast, By service verticals, 2021 – 2032
10.4.7.1.5 Over-the-Top (OTT) Market Size & Forecast, By Platform, 2021 – 2032
10.4.7.2 India
10.4.7.2.1 Over-the-Top (OTT) Market Size & Forecast, By Type, 2021 – 2032
10.4.7.2.2 Over-the-Top (OTT) Market Size & Forecast, By Streaming Devices, 2021 – 2032
10.4.7.2.3 Over-the-Top (OTT) Market Size & Forecast, By OTT Business Model, 2021 – 2032
10.4.7.2.4 Over-the-Top (OTT) Market Size & Forecast, By service verticals, 2021 – 2032
10.4.7.2.5 Over-the-Top (OTT) Market Size & Forecast, By Platform, 2021 – 2032
10.4.7.3 Japan
10.4.7.3.1 Over-the-Top (OTT) Market Size & Forecast, By Type, 2021 – 2032
10.4.7.3.2 Over-the-Top (OTT) Market Size & Forecast, By Streaming Devices, 2021 – 2032
10.4.7.3.3 Over-the-Top (OTT) Market Size & Forecast, By OTT Business Model, 2021 – 2032
10.4.7.3.4 Over-the-Top (OTT) Market Size & Forecast, By service verticals, 2021 – 2032
10.4.7.3.5 Over-the-Top (OTT) Market Size & Forecast, By Platform, 2021 – 2032
10.4.7.4 South Korea
10.4.7.4.1 Over-the-Top (OTT) Market Size & Forecast, By Type, 2021 – 2032
10.4.7.4.2 Over-the-Top (OTT) Market Size & Forecast, By Streaming Devices, 2021 – 2032
10.4.7.4.3 Over-the-Top (OTT) Market Size & Forecast, By OTT Business Model, 2021 – 2032
10.4.7.4.4 Over-the-Top (OTT) Market Size & Forecast, By service verticals, 2021 – 2032
10.4.7.4.5 Over-the-Top (OTT) Market Size & Forecast, By Platform, 2021 – 2032
10.4.7.5 Australia
10.4.7.5.1 Over-the-Top (OTT) Market Size & Forecast, By Type, 2021 – 2032
10.4.7.5.2 Over-the-Top (OTT) Market Size & Forecast, By Streaming Devices, 2021 – 2032
10.4.7.5.3 Over-the-Top (OTT) Market Size & Forecast, By OTT Business Model, 2021 – 2032
10.4.7.5.4 Over-the-Top (OTT) Market Size & Forecast, By service verticals, 2021 – 2032
10.4.7.5.5 Over-the-Top (OTT) Market Size & Forecast, By Platform, 2021 – 2032
10.4.7.6 ASEAN Countries
10.4.7.6.1 Over-the-Top (OTT) Market Size & Forecast, By Type, 2021 – 2032
10.4.7.6.2 Over-the-Top (OTT) Market Size & Forecast, By Streaming Devices, 2021 – 2032
10.4.7.6.3 Over-the-Top (OTT) Market Size & Forecast, By OTT Business Model, 2021 – 2032
10.4.7.6.4 Over-the-Top (OTT) Market Size & Forecast, By service verticals, 2021 – 2032
10.4.7.6.5 Over-the-Top (OTT) Market Size & Forecast, By Platform, 2021 – 2032
10.4.7.7 Rest of Asia-Pacific
10.4.7.7.1 Over-the-Top (OTT) Market Size & Forecast, By Type, 2021 – 2032
10.4.7.7.2 Over-the-Top (OTT) Market Size & Forecast, By Streaming Devices, 2021 – 2032
10.4.7.7.3 Over-the-Top (OTT) Market Size & Forecast, By OTT Business Model, 2021 – 2032
10.4.7.7.4 Over-the-Top (OTT) Market Size & Forecast, By service verticals, 2021 – 2032
10.4.7.7.5 Over-the-Top (OTT) Market Size & Forecast, By Platform, 2021 – 2032
10.5 Latin America
10.5.1 Key Trends
10.5.2 Over-the-Top (OTT) Market Size & Forecast, By Type, 2021 – 2032
10.5.3 Over-the-Top (OTT) Market Size & Forecast, By Streaming Devices, 2021 – 2032
10.5.4 Over-the-Top (OTT) Market Size & Forecast, By OTT Business Model, 2021 – 2032
10.5.5 Over-the-Top (OTT) Market Size & Forecast, By service verticals, 2021 – 2032
10.5.6 Over-the-Top (OTT) Market Size & Forecast, By Platform, 2021 – 2032
10.5.7 Over-the-Top (OTT) Market Size & Forecast, By Country, 2021 – 2032
10.5.7.1 Brazil
10.5.7.1.1 Over-the-Top (OTT) Market Size & Forecast, By Type, 2021 – 2032
10.5.7.1.2 Over-the-Top (OTT) Market Size & Forecast, By Streaming Devices, 2021 – 2032
10.5.7.1.3 Over-the-Top (OTT) Market Size & Forecast, By OTT Business Model, 2021 – 2032
10.5.7.1.4 Over-the-Top (OTT) Market Size & Forecast, By service verticals, 2021 – 2032
10.5.7.1.5 Over-the-Top (OTT) Market Size & Forecast, By Platform, 2021 – 2032
10.5.7.2 Argentina
10.5.7.2.1 Over-the-Top (OTT) Market Size & Forecast, By Type, 2021 – 2032
10.5.7.2.2 Over-the-Top (OTT) Market Size & Forecast, By Streaming Devices, 2021 – 2032
10.5.7.2.3 Over-the-Top (OTT) Market Size & Forecast, By OTT Business Model, 2021 – 2032
10.5.7.2.4 Over-the-Top (OTT) Market Size & Forecast, By service verticals, 2021 – 2032
10.5.7.2.5 Over-the-Top (OTT) Market Size & Forecast, By Platform, 2021 – 2032
10.5.7.3 Mexico
10.5.7.3.1 Over-the-Top (OTT) Market Size & Forecast, By Type, 2021 – 2032
10.5.7.3.2 Over-the-Top (OTT) Market Size & Forecast, By Streaming Devices, 2021 – 2032
10.5.7.3.3 Over-the-Top (OTT) Market Size & Forecast, By OTT Business Model, 2021 – 2032
10.5.7.3.4 Over-the-Top (OTT) Market Size & Forecast, By service verticals, 2021 – 2032
10.5.7.3.5 Over-the-Top (OTT) Market Size & Forecast, By Platform, 2021 – 2032
10.5.7.4 Colombia
10.5.7.4.1 Over-the-Top (OTT) Market Size & Forecast, By Type, 2021 – 2032
10.5.7.4.2 Over-the-Top (OTT) Market Size & Forecast, By Streaming Devices, 2021 – 2032
10.5.7.4.3 Over-the-Top (OTT) Market Size & Forecast, By OTT Business Model, 2021 – 2032
10.5.7.4.4 Over-the-Top (OTT) Market Size & Forecast, By service verticals, 2021 – 2032
10.5.7.4.5 Over-the-Top (OTT) Market Size & Forecast, By Platform, 2021 – 2032
10.5.7.5 Rest of Latin America
10.5.7.5.1 Over-the-Top (OTT) Market Size & Forecast, By Type, 2021 – 2032
10.5.7.5.2 Over-the-Top (OTT) Market Size & Forecast, By Streaming Devices, 2021 – 2032
10.5.7.5.3 Over-the-Top (OTT) Market Size & Forecast, By OTT Business Model, 2021 – 2032
10.5.7.5.4 Over-the-Top (OTT) Market Size & Forecast, By service verticals, 2021 – 2032
10.5.7.5.5 Over-the-Top (OTT) Market Size & Forecast, By Platform, 2021 – 2032
10.6 Middle East & Africa
10.6.1 Key Trends
10.6.2 Over-the-Top (OTT) Market Size & Forecast, By Type, 2021 – 2032
10.6.3 Over-the-Top (OTT) Market Size & Forecast, By Streaming Devices, 2021 – 2032
10.6.4 Over-the-Top (OTT) Market Size & Forecast, By OTT Business Model, 2021 – 2032
10.6.5 Over-the-Top (OTT) Market Size & Forecast, By service verticals, 2021 – 2032
10.6.6 Over-the-Top (OTT) Market Size & Forecast, By Platform, 2021 – 2032
10.6.7 Over-the-Top (OTT) Market Size & Forecast, By Country, 2021 – 2032
10.6.7.1 UAE
10.6.7.1.1 Over-the-Top (OTT) Market Size & Forecast, By Type, 2021 – 2032
10.6.7.1.2 Over-the-Top (OTT) Market Size & Forecast, By Streaming Devices, 2021 – 2032
10.6.7.1.3 Over-the-Top (OTT) Market Size & Forecast, By OTT Business Model, 2021 – 2032
10.6.7.1.4 Over-the-Top (OTT) Market Size & Forecast, By service verticals, 2021 – 2032
10.6.7.1.5 Over-the-Top (OTT) Market Size & Forecast, By Platform, 2021 – 2032
10.6.7.2 Saudi Arabia
10.6.7.2.1 Over-the-Top (OTT) Market Size & Forecast, By Type, 2021 – 2032
10.6.7.2.2 Over-the-Top (OTT) Market Size & Forecast, By Streaming Devices, 2021 – 2032
10.6.7.2.3 Over-the-Top (OTT) Market Size & Forecast, By OTT Business Model, 2021 – 2032
10.6.7.2.4 Over-the-Top (OTT) Market Size & Forecast, By service verticals, 2021 – 2032
10.6.7.2.5 Over-the-Top (OTT) Market Size & Forecast, By Platform, 2021 – 2032
10.6.7.3 Qatar
10.6.7.3.1 Over-the-Top (OTT) Market Size & Forecast, By Type, 2021 – 2032
10.6.7.3.2 Over-the-Top (OTT) Market Size & Forecast, By Streaming Devices, 2021 – 2032
10.6.7.3.3 Over-the-Top (OTT) Market Size & Forecast, By OTT Business Model, 2021 – 2032
10.6.7.3.4 Over-the-Top (OTT) Market Size & Forecast, By service verticals, 2021 – 2032
10.6.7.3.5 Over-the-Top (OTT) Market Size & Forecast, By Platform, 2021 – 2032
10.6.7.4 Egypt
10.6.7.4.1 Over-the-Top (OTT) Market Size & Forecast, By Type, 2021 – 2032
10.6.7.4.2 Over-the-Top (OTT) Market Size & Forecast, By Streaming Devices, 2021 – 2032
10.6.7.4.3 Over-the-Top (OTT) Market Size & Forecast, By OTT Business Model, 2021 – 2032
10.6.7.4.4 Over-the-Top (OTT) Market Size & Forecast, By service verticals, 2021 – 2032
10.6.7.4.5 Over-the-Top (OTT) Market Size & Forecast, By Platform, 2021 – 2032
10.6.7.5 South Africa
10.6.7.5.1 Over-the-Top (OTT) Market Size & Forecast, By Type, 2021 – 2032
10.6.7.5.2 Over-the-Top (OTT) Market Size & Forecast, By Streaming Devices, 2021 – 2032
10.6.7.5.3 Over-the-Top (OTT) Market Size & Forecast, By OTT Business Model, 2021 – 2032
10.6.7.5.4 Over-the-Top (OTT) Market Size & Forecast, By service verticals, 2021 – 2032
10.6.7.5.5 Over-the-Top (OTT) Market Size & Forecast, By Platform, 2021 – 2032
10.6.7.6 Rest of Middle East & Africa
10.6.7.6.1 Over-the-Top (OTT) Market Size & Forecast, By Type, 2021 – 2032
10.6.7.6.2 Over-the-Top (OTT) Market Size & Forecast, By Streaming Devices, 2021 – 2032
10.6.7.6.3 Over-the-Top (OTT) Market Size & Forecast, By OTT Business Model, 2021 – 2032
10.6.7.6.4 Over-the-Top (OTT) Market Size & Forecast, By service verticals, 2021 – 2032
10.6.7.6.5 Over-the-Top (OTT) Market Size & Forecast, By Platform, 2021 – 2032
11. Competitive Landscape
11.1 Key Players' Positioning
11.2 Competitive Developments
11.2.1 Key Strategies Adopted (%), By Key Players, 2024
11.2.2 Year-Wise Strategies & Development, 2021 – 2025
11.2.3 Number Of Strategies Adopted By Key Players, 2024
11.3 Market Share Analysis, 2024
11.4 Product/Service & Application Benchmarking
11.4.1 Product/Service Specifications & Features By Key Players
11.4.2 Product/Service Heatmap By Key Players
11.4.3 Application Heatmap By Key Players
11.5 Industry Start-Up & Innovation Landscape
11.6 Key Company Profiles
11.6.1 Netflix
11.6.1.1 Company Overview & Snapshot
11.6.1.2 Product/Service Portfolio
11.6.1.3 Key Company Financials
11.6.1.4 SWOT Analysis
11.6.2 Amazon Prime Video
11.6.2.1 Company Overview & Snapshot
11.6.2.2 Product/Service Portfolio
11.6.2.3 Key Company Financials
11.6.2.4 SWOT Analysis
11.6.3 Disney+
11.6.3.1 Company Overview & Snapshot
11.6.3.2 Product/Service Portfolio
11.6.3.3 Key Company Financials
11.6.3.4 SWOT Analysis
11.6.4 Amazon Web Services (AWS)
11.6.4.1 Company Overview & Snapshot
11.6.4.2 Product/Service Portfolio
11.6.4.3 Key Company Financials
11.6.4.4 SWOT Analysis
11.6.5 Apple TV+
11.6.5.1 Company Overview & Snapshot
11.6.5.2 Product/Service Portfolio
11.6.5.3 Key Company Financials
11.6.5.4 SWOT Analysis
11.6.6 Ultra Media & Entertainment Group
11.6.6.1 Company Overview & Snapshot
11.6.6.2 Product/Service Portfolio
11.6.6.3 Key Company Financials
11.6.6.4 SWOT Analysis
11.6.7 YouTube
11.6.7.1 Company Overview & Snapshot
11.6.7.2 Product/Service Portfolio
11.6.7.3 Key Company Financials
11.6.7.4 SWOT Analysis
11.6.8 Paramount+
11.6.8.1 Company Overview & Snapshot
11.6.8.2 Product/Service Portfolio
11.6.8.3 Key Company Financials
11.6.8.4 SWOT Analysis
11.6.9 Peacock
11.6.9.1 Company Overview & Snapshot
11.6.9.2 Product/Service Portfolio
11.6.9.3 Key Company Financials
11.6.9.4 SWOT Analysis
11.6.10 Sony Crackle
11.6.10.1 Company Overview & Snapshot
11.6.10.2 Product/Service Portfolio
11.6.10.3 Key Company Financials
11.6.10.4 SWOT Analysis
11.6.11 Vudu
11.6.11.1 Company Overview & Snapshot
11.6.11.2 Product/Service Portfolio
11.6.11.3 Key Company Financials
11.6.11.4 SWOT Analysis
11.6.12 Roku
11.6.12.1 Company Overview & Snapshot
11.6.12.2 Product/Service Portfolio
11.6.12.3 Key Company Financials
11.6.12.4 SWOT Analysis
11.6.13 Tubi TV
11.6.13.1 Company Overview & Snapshot
11.6.13.2 Product/Service Portfolio
11.6.13.3 Key Company Financials
11.6.13.4 SWOT Analysis
11.6.14 BBC iPlayer
11.6.14.1 Company Overview & Snapshot
11.6.14.2 Product/Service Portfolio
11.6.14.3 Key Company Financials
11.6.14.4 SWOT Analysis
11.6.15 Discovery+
11.6.15.1 Company Overview & Snapshot
11.6.15.2 Product/Service Portfolio
11.6.15.3 Key Company Financials
11.6.15.4 SWOT Analysis
11.6.16 Crunchyroll
11.6.16.1 Company Overview & Snapshot
11.6.16.2 Product/Service Portfolio
11.6.16.3 Key Company Financials
11.6.16.4 SWOT Analysis
11.6.17 FuboTV
11.6.17.1 Company Overview & Snapshot
11.6.17.2 Product/Service Portfolio
11.6.17.3 Key Company Financials
11.6.17.4 SWOT Analysis
11.6.18 BritBox
11.6.18.1 Company Overview & Snapshot
11.6.18.2 Product/Service Portfolio
11.6.18.3 Key Company Financials
11.6.18.4 SWOT Analysis
11.6.19 Funimation
11.6.19.1 Company Overview & Snapshot
11.6.19.2 Product/Service Portfolio
11.6.19.3 Key Company Financials
11.6.19.4 SWOT Analysis
11.6.20 Pluto TV
11.6.20.1 Company Overview & Snapshot
11.6.20.2 Product/Service Portfolio
11.6.20.3 Key Company Financials
11.6.20.4 SWOT Analysis
12. Analyst Recommendations
12.1 SNS Insider Opportunity Map
12.2 Industry Low-Hanging Fruit Assessment
12.3 Market Entry & Growth Strategy
12.4 Analyst Viewpoint & Suggestions On Market Growth
13. Assumptions
14. Disclaimer
15. Appendix
15.1 List Of Tables
15.2 List Of Figure
Key Segments:
By Type
-
OTT Services
-
OTT Devices
By Streaming Devices
-
Smartphones and Tablets
-
Desktops and Laptops
-
IPTV and Consoles
By OTT Business Model
-
AVOD (Ad-based Video on Demand)
-
SVOD (Subscription Video on Demand)
-
TVOD (Transactional Video on Demand)
By service verticals
-
Media and Entertainment
-
Education and Learning
-
Gaming
-
Service Utilities
By Platform
-
Smart Phones
-
Smart TVs & Set-top Box
-
Desktop & Laptop
-
Others
Request for Segment Customization as per your Business Requirement: Segment Customization Request
REGIONAL COVERAGE:
North America
-
US
-
Canada
-
Mexico
Europe
-
Eastern Europe
-
Poland
-
Romania
-
Hungary
-
Turkey
-
Rest of Eastern Europe
-
-
Western Europe
-
Germany
-
France
-
UK
-
Italy
-
Spain
-
Netherlands
-
Switzerland
-
Austria
-
Rest of Western Europe
-
Asia Pacific
-
China
-
India
-
Japan
-
South Korea
-
Vietnam
-
Singapore
-
Australia
-
Rest of Asia Pacific
Middle East & Africa
-
Middle East
-
UAE
-
Egypt
-
Saudi Arabia
-
Qatar
-
Rest of the Middle East
-
-
Africa
-
Nigeria
-
South Africa
-
Rest of Africa
-
Latin America
-
Brazil
-
Argentina
-
Colombia
Request for Country Level Research Report: Country Level Customization Request
Available Customization
With the given market data, SNS Insider offers customization as per the company’s specific needs. The following customization options are available for the report:
-
Product Analysis
-
Criss-Cross segment analysis (e.g. Product X Application)
-
Product Matrix which gives a detailed comparison of product portfolio of each company
-
Geographic Analysis
-
Additional countries in any of the regions
-
Company Information
-
Detailed analysis and profiling of additional market players (Up to five)
An accurate research report requires proper strategizing as well as implementation. There are multiple factors involved in the completion of good and accurate research report and selecting the best methodology to compete the research is the toughest part. Since the research reports we provide play a crucial role in any company’s decision-making process, therefore we at SNS Insider always believe that we should choose the best method which gives us results closer to reality. This allows us to reach at a stage wherein we can provide our clients best and accurate investment to output ratio.
Each report that we prepare takes a timeframe of 350-400 business hours for production. Starting from the selection of titles through a couple of in-depth brain storming session to the final QC process before uploading our titles on our website we dedicate around 350 working hours. The titles are selected based on their current market cap and the foreseen CAGR and growth.
The 5 steps process:
Step 1: Secondary Research:
Secondary Research or Desk Research is as the name suggests is a research process wherein, we collect data through the readily available information. In this process we use various paid and unpaid databases which our team has access to and gather data through the same. This includes examining of listed companies’ annual reports, Journals, SEC filling etc. Apart from this our team has access to various associations across the globe across different industries. Lastly, we have exchange relationships with various university as well as individual libraries.

Step 2: Primary Research
When we talk about primary research, it is a type of study in which the researchers collect relevant data samples directly, rather than relying on previously collected data. This type of research is focused on gaining content specific facts that can be sued to solve specific problems. Since the collected data is fresh and first hand therefore it makes the study more accurate and genuine.
We at SNS Insider have divided Primary Research into 2 parts.
Part 1 wherein we interview the KOLs of major players as well as the upcoming ones across various geographic regions. This allows us to have their view over the market scenario and acts as an important tool to come closer to the accurate market numbers. As many as 45 paid and unpaid primary interviews are taken from both the demand and supply side of the industry to make sure we land at an accurate judgement and analysis of the market.
This step involves the triangulation of data wherein our team analyses the interview transcripts, online survey responses and observation of on filed participants. The below mentioned chart should give a better understanding of the part 1 of the primary interview.

Part 2: In this part of primary research the data collected via secondary research and the part 1 of the primary research is validated with the interviews from individual consultants and subject matter experts.
Consultants are those set of people who have at least 12 years of experience and expertise within the industry whereas Subject Matter Experts are those with at least 15 years of experience behind their back within the same space. The data with the help of two main processes i.e., FGDs (Focused Group Discussions) and IDs (Individual Discussions). This gives us a 3rd party nonbiased primary view of the market scenario making it a more dependable one while collation of the data pointers.
Step 3: Data Bank Validation
Once all the information is collected via primary and secondary sources, we run that information for data validation. At our intelligence centre our research heads track a lot of information related to the market which includes the quarterly reports, the daily stock prices, and other relevant information. Our data bank server gets updated every fortnight and that is how the information which we collected using our primary and secondary information is revalidated in real time.

Step 4: QA/QC Process
After all the data collection and validation our team does a final level of quality check and quality assurance to get rid of any unwanted or undesired mistakes. This might include but not limited to getting rid of the any typos, duplication of numbers or missing of any important information. The people involved in this process include technical content writers, research heads and graphics people. Once this process is completed the title gets uploader on our platform for our clients to read it.
Step 5: Final QC/QA Process:
This is the last process and comes when the client has ordered the study. In this process a final QA/QC is done before the study is emailed to the client. Since we believe in giving our clients a good experience of our research studies, therefore, to make sure that we do not lack at our end in any way humanly possible we do a final round of quality check and then dispatch the study to the client.