Pearlescent Pigment Market Report Scope & Overview:
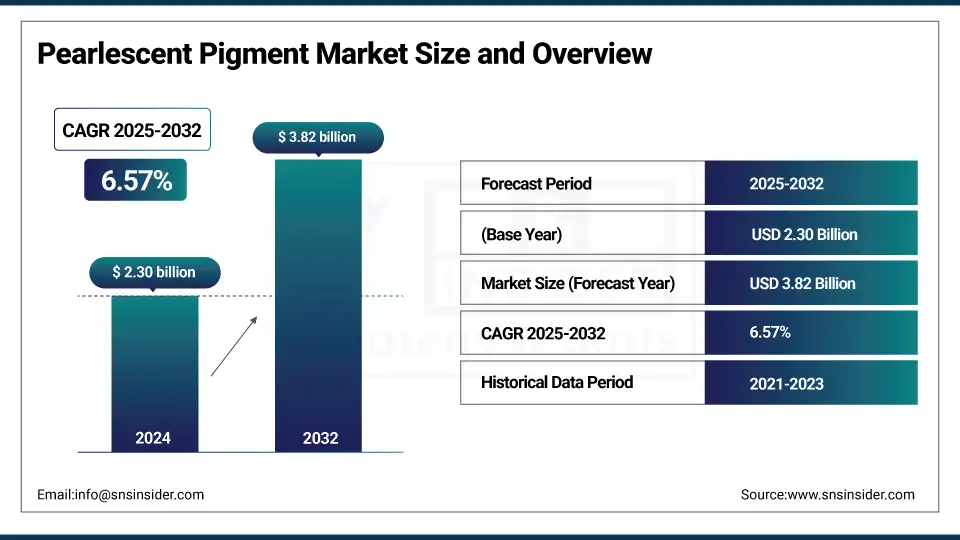
The Pearlescent Pigment market size was valued at USD 2.30 billion in 2024 and is expected to reach USD 3.82 billion by 2032, growing at a CAGR of 6.57% over the forecast period of 2025-2032.
Driven by sustainable pigment solutions, the pearlescent pigment market is witnessing rising demand for automotive coatings and decorative paints, supported by functional pigments delivering advanced interference pigments and superior surface finish. BASF’s February 2025 bulletin highlighted titanium dioxide–coated pigments enhancing chemical stability. According to the American Coatings Association, U.S. paint and coatings shipments reached $31.6 billion in 2022, boosting the pearlescent pigment market size.
Pearlescent Pigment Market Size and Forecast
-
Market Size in 2024: USD 2.30 Billion
-
Market Size by 2032: USD 3.82 Billion
-
CAGR: 6.57% from 2025 to 2032
-
Base Year: 2024
-
Forecast Period: 2025–2032
-
Historical Data: 2021–2023
To Get more information On Pearlescent Pigment Market - Request Free Sample Report
Pearlescent Pigment Market Trends
-
Rising demand in automotive coatings for deeper gloss, color travel, and durability.
-
Growing use in decorative paints for residential and commercial interiors.
-
Expansion in cosmetics and luxury packaging driven by visual appeal and color depth.
-
Innovation in sustainable pigments, including low‑VOC and eco-friendly formulations.
-
Adoption of functional pigments for UV resistance, scratch resistance, and weatherability.
-
Rapid growth in Asia Pacific markets, led by China and India, fueled by industrialization and coating demand.
Growing use of cosmetic pigments and industrial coatings, along with mica-based pigments for vivid visuals, is increasing the pearlescent pigment market share. In 2018, the FDA approved mica flakes coated with titanium dioxide for cosmetics. The pearlescent pigment market trends reflect innovation by pearlescent pigment companies, while the American Coatings Association’s 2025 report noted a USD 202 billion coatings industry, emphasizing pearlescent pigment market growth. Investments across Asia support new decorative paints and specialty packaging. This pearlescent pigment market analysis confirms expanding global influence.
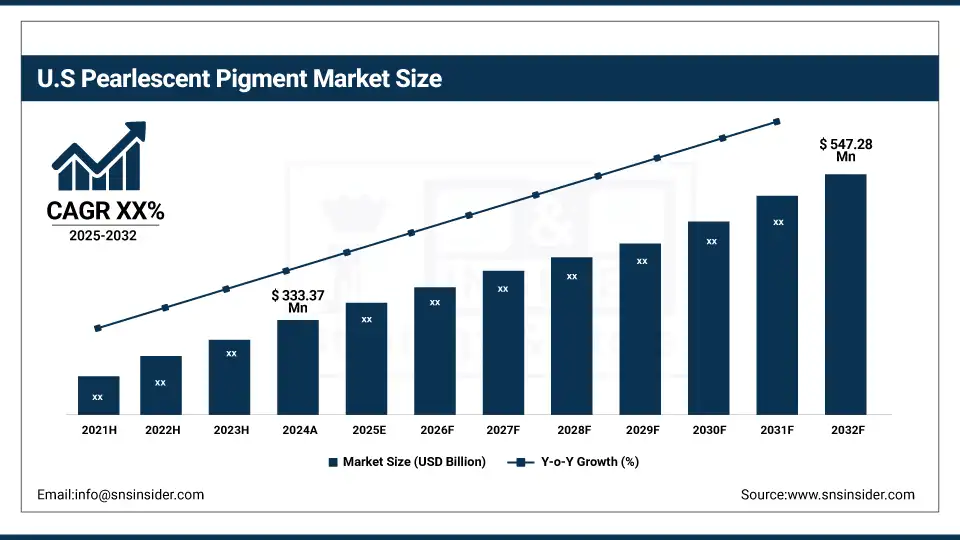
The United States dominates regional consumption by holding a market share of about 72% with a market value of USD 333.37 million in 2024 and is projected to reach a value of USD 547.28 million by 2032.
Pearlescent Pigment Market Drivers:
-
Rising Demand for Metallic Automotive Coatings Fuels Pearlescent Pigment Market Growth
The pearlescent pigment market growth is supported by innovation in metallic automotive coatings, delivering deeper gloss and color travel. In January 2025, Axalta unveiled new functional pigments improving surface finish and scratch resistance in EV paint lines. Decorative paints and cosmetic pigments segments also see benefits from next-generation interference pigments. Titanium dioxide–based solutions continue to anchor product launches as pearlescent pigments companies target premium segments. This innovation-led approach strengthens the pearlescent pigment market trends across global automotive design.
-
Expanding Use of Pearlescent Pigments in Decorative Paints Strengthens Market Position
The pearlescent pigment market benefits from decorative paints embracing functional pigments for walls, furniture, and architectural features. Sherwin-Williams’ February 2025 update introduced titanium dioxide–enhanced finishes for superior surface finish and light reflection. Mica-based pigments support durable, vibrant colors aligned with interior design trends. This demand uplift illustrates how pearlescent pigment market trends capture both residential and commercial projects, reinforcing the segment’s importance in adding depth and elegance to everyday spaces.
Pearlescent Pigment Market Restraints:
-
Regulatory Scrutiny Over Titanium Dioxide Challenges Pearlescent Pigment Market Analysis
Tighter EU labeling rules for titanium dioxide as a suspected carcinogen add cost and complexity for pearlescent pigments companies. The European Chemicals Agency’s classification pressures producers to reformulate interference pigments, potentially impacting the pearlescent pigment market growth. Despite strong demand for automotive coatings and decorative paints, manufacturers must navigate evolving compliance landscapes, which constrain product innovation and raise operational expenses. These dynamic shapes the broader pearlescent pigment market analysis and future competitive strategies.
Pearlescent Pigment Market Segmentation Analysis:
By Product
Synthetic held a dominant Pearlescent Pigment Market share of 69.8% in 2024 due to titanium dioxide–based formulations that enhance brilliance and weather resistance in automotive coatings and decorative paints. BASF’s February 2025 bulletin introduced synthetic pearlescent pigments with higher chemical durability, supporting growing OEM demand. The American Coatings Association confirms synthetic pigments outperform natural pigments in scalability and cost efficiency. This dominance is further strengthened by rising adoption of synthetic mica-based pigments in high-end cosmetic pigments and functional pigments.
However, synthetic pigments are the fastest growing with the highest CAGR of 6.61% during the forecast period over 2025 to 2032, driven by innovation in sustainable automotive coatings and cosmetic pigments. BASF’s 2025 product line focuses on low-VOC synthetic pearlescent pigments for luxury EV coatings and packaging. FDA’s earlier approval of titanium dioxide in synthetic pigments for cosmetics further accelerates adoption. Pearlescent Pigments Companies benefit from expanding decorative paints demand, aligning sustainability trends with advanced surface finish performance.
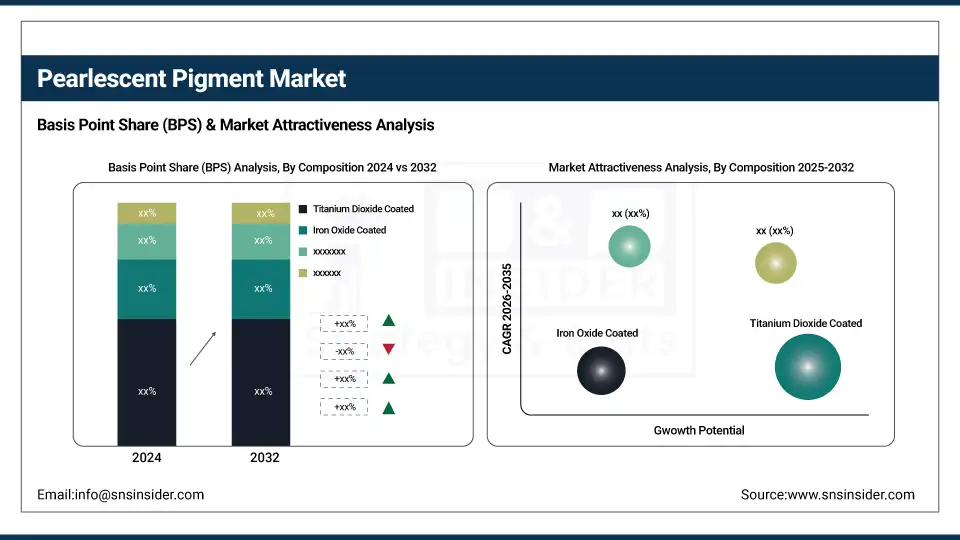
By Composition
Titanium dioxide coated pigments held a dominant Pearlescent Pigment Market share of 51.7% in 2024 due to high opacity, vibrant interference pigments, and superior UV resistance. BASF’s February 2025 update highlighted titanium dioxide-coated pigments developed for luxury automotive coatings, boosting color depth and durability. The American Coatings Association reports steady demand for these pigments in architectural and industrial coatings. This subsegment’s proven chemical stability ensures it remains essential for premium decorative paints and functional pigments.
Silica-based pigments are the fastest growing with the highest CAGR of 6.97% during the forecast period over 2025 to 2032, driven by lightweight, eco-friendly design advantages. FDA’s earlier clearance of silica substrates in cosmetic pigments supports expanding luxury packaging and skincare lines. Pearlescent Pigments Companies leverage silica’s lower density for improved surface finish and flexibility. The American Coatings Association notes rising decorative paints demand for silica-based systems, reflecting sustainability-led innovation trends in interference pigments.
By Structure Type
Multilayer pigments held a dominant Pearlescent Pigment Market share of 56.1% in 2024 due to complex color travel and premium surface finish preferred in luxury automotive coatings. Axalta’s January 2025 launch showcased multilayer pigments engineered for scratch resistance and brilliance in EV paints. The American Coatings Association observes multilayer structures outperform monolayer pigments in weatherable industrial coatings. This subsegment leads due to its versatility in functional pigments, supporting both automotive coatings and decorative paints.
However, multilayer pigments are the fastest growing with the highest CAGR of 6.66% during the forecast period over 2025 to 2032, driven by demand for advanced cosmetic pigments and luxury packaging. BASF’s new multilayer products launched in 2025 feature stronger durability and enhanced brilliance. Responsible Mica Initiative reports wider certified mica-based multilayer pigments adoption for ethical sourcing. This growth aligns with consumer trends for color-shifting interference pigments and unique surface finish across decorative paints and automotive coatings.
By Substrate
Mica-based pigments held a dominant Pearlescent Pigment Market share of 59.6% in 2024 due to natural brilliance, cost-effectiveness, and stable supply for decorative paints and industrial coatings. Responsible Mica Initiative’s 2024 report highlighted strong industry commitment to traceable mica, reinforcing global demand. Titanium dioxide-coated mica subsegments lead within mica-based pigments, praised by the American Coatings Association for UV durability and aesthetic depth. Their balance of sustainability and optical performance keeps mica-based pigments ahead.
Glass flake-based pigments are the fastest growing with the highest CAGR of 6.88% during the forecast period over 2025 to 2032, driven by intense sparkle and color depth in premium automotive coatings and packaging. Axalta’s January 2025 announcement showcased glass-based multilayer pigments targeting luxury EV finishes. The American Coatings Association highlights rising demand for high-gloss decorative paints, while titanium dioxide-coated glass flakes remain the subsegment driving innovation and functional pigments demand.
By Application
Paints & coatings held a dominant Pearlescent Pigment Market share of 45.9% in 2024 due to premium automotive coatings and decorative paints adoption. Sherwin-Williams’ February 2025 launch featured titanium dioxide-rich pigments enhancing color brilliance and weather durability. The American Coatings Association reports paints & coatings as the largest end user of pearlescent pigments, especially for high-end exterior finishes. This demand solidifies paints & coatings as the subsegment anchoring overall functional pigments growth.
Cosmetics are the fastest growing with the highest CAGR of 7.19% during the forecast period over 2025 to 2032, driven by luxury packaging and skincare. FDA’s 2018 approval of mica-based titanium dioxide pigments in cosmetics strengthened market confidence. Pearlescent Pigments Companies now target high-purity cosmetic pigments for eye, face, and specialty packaging. The American Coatings Association also notes spillover demand in decorative paints, highlighting cosmetics as the next frontier for interference pigments and surface finish innovation.
Pearlescent Pigment Market Regional Analysis
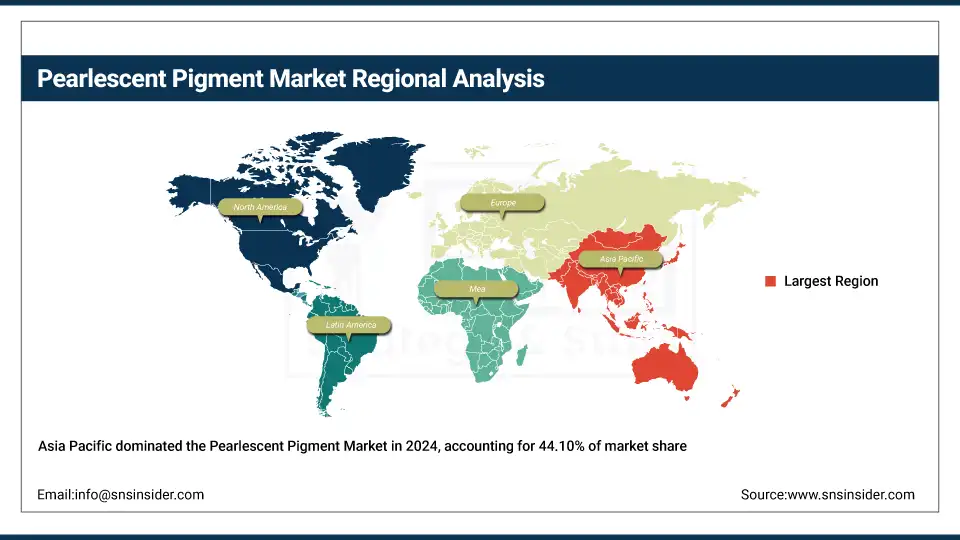
Asia Pacific remains the largest and fastest-growing region with a dominant pearlescent pigment market share of 44.10% and the highest pearlescent pigment market growth. China and India lead demand due to booming automotive coatings and decorative paints. Japan’s advanced cosmetic pigments segment boosts titanium dioxide–coated output. Pearlescent Pigments Companies in Asia expand capacity for mica-based pigments, meeting local environmental standards and delivering cutting-edge interference pigments. Regional trends favor lightweight functional pigments with unique surface finish performance.
Get Customized Report as per Your Business Requirement - Enquiry Now
Europe holds the second dominating Pearlescent Pigment Market Share of 23.50% driven by strict sustainability norms favoring mica-based pigments and decorative paints. Germany dominates Europe’s output, emphasizing high-value automotive coatings and cosmetic pigments certified under REACH. Pearlescent pigment market trends indicate growing titanium dioxide–coated innovations by pearlescent pigment companies. The European Coatings Association reports consistent demand for functional pigments that deliver superior surface finish and color travel, reinforcing Europe’s position as the second key hub.
North America is the third dominating region with a pearlescent pigment market share of 20.30% due to sustained innovation in automotive coatings and industrial coatings. The growth is with rising titanium dioxide–based pigments for premium vehicles and decorative paints. Canada shows notable Pearlescent Pigment Market Growth supported by the American Coatings Association’s regulatory updates. Pearlescent Pigments Companies such as BASF expand functional pigments facilities in North America, driving advanced surface finish and interference pigments applications.
Pearlescent Pigment Market Key Players:
The major pearlescent pigment market competitors include Merck KGaA, BASF SE, Sun Chemical Performance Pigments (DIC Corporation), DIC Corporation, ALTANA AG, Sudarshan Chemical Industries Ltd., Fujian Kuncai Material Technology Co., Ltd., Oxen Special Chemicals Co., Ltd., CHESIR, Pritty Pearlescent Pigments Co., Ltd., Geotech International B.V., Zhejiang Ruicheng Effect Pigment Co., Ltd., Sinpearl Pearlescent Pigment Co., Ltd., Smarol Technology Co., Ltd., Nanyang Lingbao Pearl Pigment Co., Ltd., Shanghai Zhuerna High-Tech Powder Material Co., Ltd., RIKA Technology Co., Ltd., Kolortek (Huaian Concord Cosmetics Product Co., Ltd.), Lansco Colors, and CRISTAL
Recent Developments:
-
In July 2024, Merck KGaA signed an agreement on July 25 2024 to sell its Surface Solutions (pearlescent pigment) business to Global New Material International (GNMI) for €665 million
-
In March 2024, Sun Chemical (DIC Corporation) showcased its latest sustainable effect pigments, including new pearlescent formulations, at the American Coatings Show 2024
| Report Attributes | Details |
|---|---|
| Market Size in 2024 | USD 2.30 billion |
| Market Size by 2032 | USD 3.82 billion |
| CAGR | CAGR of 6.57% From 2025 to 2032 |
| Base Year | 2024 |
| Forecast Period | 2025-2032 |
| Historical Data | 2021-2023 |
| Report Scope & Coverage | Market Size, Segments Analysis, Competitive Landscape, Regional Analysis, DROC & SWOT Analysis, Forecast Outlook |
| Key Segments | •By Product (Natural, Synthetic) •By Composition (Titanium Dioxide Coated, Iron Oxide Coated, Silica-Based, Others) •By Structure Type (Substrate-free, Monolayer, Multilayer) •By Substrate (Mica-Based, Glass Flake-Based, Alumina-Based, Others) •By Application (Paints & Coatings, Plastics, Printing Inks, Cosmetics, Others) |
| Regional Analysis/Coverage | North America (US, Canada, Mexico), Europe (Germany, France, UK, Italy, Spain, Poland, Turkey, Rest of Europe), Asia Pacific (China, India, Japan, South Korea, Singapore, Australia, Rest of Asia Pacific), Middle East & Africa (UAE, Saudi Arabia, Qatar, South Africa, Rest of Middle East & Africa), Latin America (Brazil, Argentina, Rest of Latin America) |
| Company Profiles | Merck KGaA, BASF SE, Sun Chemical Performance Pigments (DIC Corporation), DIC Corporation, ALTANA AG, Sudarshan Chemical Industries Ltd., Fujian Kuncai Material Technology Co., Ltd., Oxen Special Chemicals Co., Ltd., CHESIR, Pritty Pearlescent Pigments Co., Ltd., Geotech International B.V., Zhejiang Ruicheng Effect Pigment Co., Ltd., Sinpearl Pearlescent Pigment Co., Ltd., Smarol Technology Co., Ltd., Nanyang Lingbao Pearl Pigment Co., Ltd., Shanghai Zhuerna High-Tech Powder Material Co., Ltd., RIKA Technology Co., Ltd., Kolortek (Huaian Concord Cosmetics Product Co., Ltd.), Lansco Colors, and CRISTAL |
Frequently Asked Questions
Sustainability drives demand for eco-friendly mica-based pigments, silica-based pigments, and low-VOC functional pigments, aligning with global environmental regulations and design trends.
Titanium dioxide-coated pigments dominate due to high opacity, UV durability, and rich interference pigments preferred in luxury automotive coatings and cosmetics.
Asia Pacific leads with 44.10% market share, followed by Europe at 23.50% and North America at 20.30%, supported by automotive coatings and decorative paints.
FDA’s mica-based titanium dioxide approvals boost cosmetic pigments, helping brands launch vibrant eye, face, and skincare products with premium surface finish.
Innovation in sustainable titanium dioxide coatings, booming automotive coatings, and decorative paints demand drive the pearlescent pigment market growth alongside rising luxury packaging needs.
Get in Touch
