image

Pension Real Estate Market Size, Share & Segmentation By Type of Pension Plans (Defined Benefit Plans, Defined Contribution Plans, Hybrid Plans, Government Pension Plans, and Corporate Pension Plans), Investment Strategy (Conservative Strategies, Aggressive Strategies, Balanced Strategies, Income-focused Investments, and Growth-oriented Investments), Types of Real Estate Assets (Residential Properties, Commercial Properties, Industrial Properties, Mixed-use Developments, and Retail Properties), Investor Type (Institutional Investors, Individual Investors, Real Estate Investment Trusts (REITs), Pension Fund Managers, and Family Offices), Risk Tolerance (Low-risk Tolerance Investments, Moderate-risk Tolerance Investments, High-risk Tolerance Investments, Value-add Investments, and Core Investments), and Region | Global Forecast 2025-2032

Date: July 2025 Report Code: SNS/ICT/7789 Page 320

Pension Real Estate Market Report Scope & Overview:

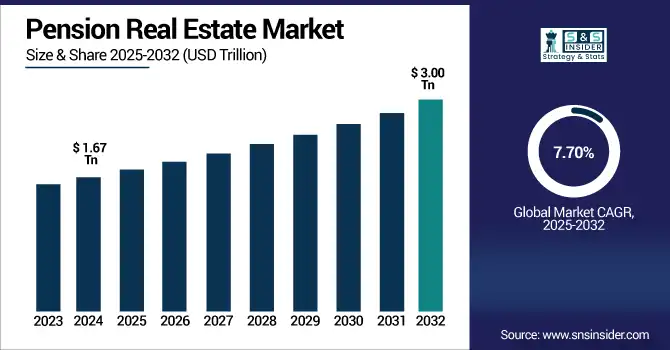
The Pension Real Estate Market was valued at USD 1.67 trillion in 2024 and is expected to reach USD 3.00 trillion by 2032, growing at a CAGR of 7.70% over 2025–2032.

The Pension Real Estate Market growth is d rising global life expectancy and an expanding aging population, which are increasing the need for stable, long-term income sources. Pension funds are now diversifying their portfolios to invest in real estate, hoping to benefit from more stable return costs and hedge against inflation. This change is part of a wider move to real assets, which provide stability, capital preservation and defensible income under a cloudier market outlook.

  • Notably, 76% of institutional investors use real estate for portfolio diversification, with it being the most common hedge against inflation, according to S&P and Preqin.

  • Defined Benefit plans in the U.K. are gradually increasing their exposure to REITs, with asset weight share rising from 60% in January 2020 to 70% by January 2025, and count share growing from 39% to 51%.

  • Recent New York Fed data highlights that U.S. pension real estate portfolios hold approximately 4.4% in multifamily affordable housing, with expectations to increase to 5.0% by June 2025.

  • Additionally, the Government Pension Investment Fund (Japan), the world’s largest pension fund reported USD 1.73 trillion in assets under management as of 2024, reflecting the scale and investment potential of global pension entities.

Positive reforms, increasing defined contribution inflows, urbanization, infrastructure expansion, and demand for sustainable, mixed-use assets fuel market growth, while real assets act as a stabilizing asset class, providing significant risk-adjusted returns.

The U.S. Pension Real Estate Market size was valued at USD 0.46 trillion in 2024 and is expected to reach USD 0.81 trillion by 2032, growing at a CAGR of 7.46% over 2025-2032. 

The U.S. Pension Real Estate Market growth is driven by growing retirement savings, growing allocations to real assets for un-correlated and stable returns, and demand for income-generating properties. Positive demographics and investments in urban infrastructure increase the attractiveness of real estate as an asset class for pension funds.

Market Dynamics:

Drivers:

  • Aging Global Population Drives Consistent Demand for Retirement Housing and Long-Term Care Real Estate Investments Across Developed Markets

Rising demand for senior living and long-term care properties is being fueled by an aging global population, especially in developed nations. That is part of the reason that pension funds have been gravitating towards these stable, yield generating assets. The advantage of purpose-built housing is that it is a sure source of tenants over time, as life expectancy rises and therefore a steady source of rental income. This demographic trend is strong for pension portfolio diversification and inflation protection. As the sector continues to be resilient and matches their goal, pension funds are expected to maintain confidence and be active buyers within the pension real estate market.

  • As of 2024, there are over 1 million residents in the U.S. assisted living facilities, with median annual costs of USD 64,200.

  • Governments in Asia, such as China, are expanding senior care services including home care, dementia facilities, and subsidies to meet growing demand from a rapidly aging population of 400 million aged 60+ by 2035.

  • According to the World Health Organization, between 2015 and 2050, the share of the global population aged over 60 will nearly double from 12% to 22%.

Restraints:

  • Regulatory Constraints and Zoning Limitations Restrict New Real Estate Developments for Pension-Backed Investment Expansion

Changing regulations and strict zoning laws limit the growth potential of pension real estate investments. This obviously impacts returns as long approval processes and land-use restrictions hinder the development process. Similarly, pension funds have fiduciary duties and investment limits by jurisdiction that restrict real estate allocations. These restrictions lessen operational agility and repel from entering high-potential markets. This regulatory friction not only limits the size and velocity of fresh investments, but continues to impede a key ingredient of pension real estate portfolio expansion in particularly permitting-challenged markets.

  • A UCLA–Anderson study found the average approval time across all multifamily housing projects in Los Angeles was 652 days (1.8 years), with total development averaging 3.9 years.

  • Moreover, 97% of developers report construction delays due to permitting issues, with nearly 18 months on average required to build an apartment building.

Opportunities:

  • Growth of Urban Retirement Communities Presents Scalable Investment Potential for Pension Real Estate in Emerging and Developed Markets

Demand for urban integrated retirement communities is fueled by rising urbanization, alongside changing retirement demands, making this a scalable opportunity for private equity real estate steered by pensions. Seniors who want to remain engaged with the urban environment they inhabited prior to retirement boost demand for mixed-use senior housing by seeking urban healthcare and amenities. Rental income and capital gains provide pension funds with stable long-term returns. In aging societies, vertical retirement villages and community-focused developments have emerged as a natural synergy between pension funds investing in urban infrastructure that is socially impactful, whilst also ensuring a demographic dividend of the graph are aligned with investment goals.

  • As of 2024, the U.S. population aged 65+ rose 3.1% to 61.2 million, while the under‑18 group declined slightly indicative of a shifting demographic structure.

  • In 2024, the national median cost for assisted living was about USD 70,800/year, with occupancy rates climbing from 77% to 84% year-over-year. Maplewood Senior Living’s portfolio achieved 95% occupancy in late 2023, far above national averages.

Challenges:

  • Volatility in Interest Rates Impacts Pension Real Estate Valuations and Deters Consistent Capital Allocation Strategies

Pension investments in real estate are affected by fluctuating interest rates by affecting asset valuations and financing costs. Increased borrowing costs with rising rates therefore push down property values and squeeze out return and add to timing challenges. Such valuation shifts are difficult for pension funds with fixed liabilities to absorb. On the flipside, lower rates may create or aggravate asset bubbles or postpone corrections. Such volatility leaves little room for long-term capital planning and compels pension managers to implement strategy changes with alarming frequency, often at the expense of stability. Consequently, the uncertainty restricts the possibility of fast-paced growth and unfortunately destabilizes pension property investment frameworks.

  • Between March 2022 and July 2023, the Fed raised rates by over 525 bps, causing significant valuation compression in commercial real estate. Property values declined approximately 25–30% since 2019 peaks, with office buildings being the hardest hit.

Segmentation Analysis

By Type of Pension Plans

Defined Benefit Plans dominated the Pension Real Estate Market share in 2024 of a 31%, owing to their long-term liability profiles and specific cash flow requirements, which makes the stable cash flow characteristics produced by real estate well suited as an investment. Real estate assets seem to benefit from these plans in terms of diversification, income stability and inflation hedging, helping them achieve risk-adjusted return objectives.

Defined Contribution Plans are expected to grow at the fastest CAGR of 9.41% over 2025–2032, driven by rising personal control over retirement assets and the rising interest in alternative investment products, including real estate. The growing desire for inflation-hedged returns, digital investment platforms, and increasing interest in flexibility are attracting greater participation in real estate exposure in defined contribution structures.

By Investment Strategy

Conservative Strategies held the highest revenue share of 24% in 2024, as pension funds prioritize stability, capital preservation, and predictable income. This approach fits the fiduciary responsibility of pension managers to minimize risk while meeting long-term obligations, leading to strong preferences for core real estate investments with stable tenants and long leases in low-volatility markets.

Growth-oriented Investments are projected to grow at the fastest CAGR of 10.71% over 2025–2032, owing to a growing desire for long-term capital gain and higher returns. But with inflation still concerns, low yields from traditional fixed income assets and a need for diversification pension funds are looking at more opportunistic and development-based assets in high growth urban areas, combined with significant hedging of any exchange risk as this should be treated as a true domestic exposure.

By Types of Real Estate Assets

Residential Properties dominated the market in 2024 with a 25% revenue share, owing to its stable demand, near-zero vacancy rates and stable rental income. Multi-family housing and senior living developments have become appealing investment opportunities amid urban housing shortages and the aging tenant population, ensuring stable and long, pandemic-resistant returns for pension portfolios in search of reliable, income-generating assets.

Industrial Properties are expected to grow at the fastest CAGR of 10.41% over 2025–2032, as rising e-commerce, logistics networks, and last-mile delivery infrastructure are driving demand for parking lots, fulfillment centers, and warehouses. Pension funds are missing out on warehouses, distribution centers and datacenters as high-yielding assets with rising rents and a demand that is well-known to be pandemic-proof in the new digital economy.
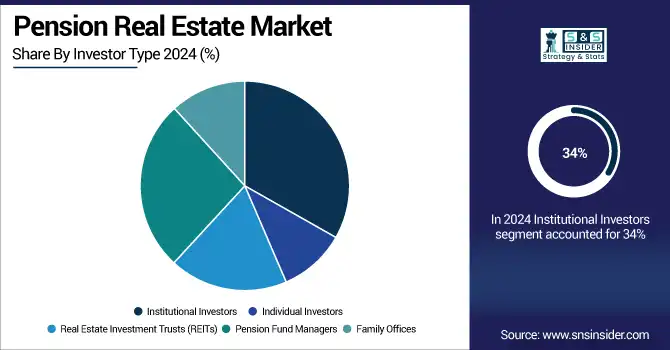
By Investor Type

Institutional Investors led the market in 2024 with a 34% revenue share, due to their substantial asset bases and long-term investment timelines, in addition to their professional management skills. Such investors are heavy allocators to real estate for asset class diversification and reliable income, and enjoy scale benefits, direct access to large transactions, and development of proven risk management systems.

Family Offices are expected to grow at the fastest CAGR of 10.27% over 2025–2032, due to the increasing need for diversification and investments related to legacy. This is in line with their inherent flexibility in investment decisions, longevity of wealth play, and shift toward investing in alternative assets, such as real estate, particularly in value-rich or emerging segments that are tied to pensions.

By Risk Tolerance

Low-risk Tolerance Investments led the market in 2024 with a 29% revenue share, as pension funds are focused on capital preservation, income stability, and downside protection. It is this that has been attractive to retirees and older funds and so the focus is in core real estate such as stabilized office buildings and residential properties with long-term leases and credit tenants.

Value-add Investments are expected to grow at the fastest CAGR of 10.22% over 2025–2032, as pension funds are strategically channeling Oak and transitioning into higher return profiles supported with a solid narrative from the perspective of the liabilities and inflation drivers. This allows funds to add the upside through renovations, operational enhancements, and market repositioning while providing the benefits of necessary diversification and improved risk-adjusted returns.

Regional Analysis:

North America

North America dominated the Pension Real Estate Market in 2024 with a 39% revenue share due to its mature pension system, locally deep institutional investor base and stable property environment in this region. Through legislative support and relatively higher transparency, the region became highly attractive to pension funds by providing consistent, long-term income and risk-adjusted returns from diversified real estate sectors, such as office, residential, and industrial.

  • According to the 2022 Private Pension Plan Bulletin, reported Form 5500 schedules show that defined benefit (DB) plans held USD 52.5 billion in real estate, while defined contribution (DC) plans accounted for another USD 17.1 billion totaling USD 69.6 billion in pension real estate assets, underlining the significant exposure of U.S. pensions to this asset class.

The U.S. is dominating the Pension Real Estate Market due to its large institutional base, mature real estate sector, and stable long-term investment environment.

Asia Pacific

Asia Pacific is expected to grow at the fastest CAGR of 9.89% over 2025–2032, due to rapid urbanization, the expanding middle class demographic, and growing allocations of pension funds into real assets.

  • A study surveying 75 government and public-sector pension schemes (including 23 in APAC) revealed that only 17% of APAC plans currently allocate over 20% of assets to real assets but 67% globally plan to increase allocations in the next two years, with APAC leading this trend.

Japan leads the Asia Pacific Pension Real Estate Market, driven by its vast pension assets, mature property sector, and a stable investment climate amid regional growth in infrastructure, housing, and logistics.

Europe

Europe holds a significant share in the Pension Real Estate Market owing to the longstanding pension systems in place in various countries, stable regulations, and the wider scope of availabilities of real estate options to investors looking for stability and income.

  • According to EIOPA, European insurers dedicate 5.7% of their assets to real estate through funds, mortgages, and property within a broader 16% allocation to alternative assets.

  • European pension schemes predominantly invest in core real estate, with allocations ranging from 3% in Germany to over 12% in Finland, delivering an average annualized return of 7.8% for pan-European core real estate.

The U.K. is dominating the Pension Real Estate Market in Europe due to its strong pension infrastructure, deep capital markets, and a diversified real estate portfolio.

Middle East & Africa and Latin America

Pension Real Estate Market trends in the Middle East & Africa and Latin America show steady growth, supported by emerging pension reforms, increasing institutional interest and growing demand for infrastructure, residential and commercial assets in rapidly urbanizing economies within the regions.

Key Players:

Pension Real Estate Market companies are China Poly Group Corporation, China Vanke Co. Ltd, China Resources Land Holdings Limited, Capital Land Limited, Greenland Holdings Corporation Limited, Zhejiang Yuntian Group Co. Ltd, Del E. Webb Construction Company, Groupe Primonial, Cofinimmo, Korian, Orpea, Domusvi, Silver Care, Dussmann, and Tertianum Group.

Recent Developments:

  • In 2023, Vanke launched a pioneering “life‑cycle housing maintenance” pilot program, integrating eldercare solutions into its rental and property‑management services, aiming to enhance tenant well‑being across diverse residential properties.

  • In 2024, Vanke sold approximately 19,000 sqm of land at a 29% discount; this strategic move supports pension‑style asset recycling and reinforces the company’s financial health and long‑term stability.

Pension Real Estate Market Report Scope:

Report Attributes Details
Market Size in 2024 USD 1.67 Trillion 
Market Size by 2032 USD 3.00 Trillion  
CAGR CAGR of 7.70% From 2025 to 2032
Base Year 2024
Forecast Period 2025-2032
Historical Data 2021-2023
Report Scope & Coverage Market Size, Segments Analysis, Competitive Landscape, Regional Analysis, DROC & SWOT Analysis, Forecast Outlook
Key Segments • By Type of Pension Plans (Defined Benefit Plans, Defined Contribution Plans, Hybrid Plans, Government Pension Plans, Corporate Pension Plans)
• By Investment Strategy (Conservative Strategies, Aggressive Strategies, Balanced Strategies, Income-focused Investments, Growth-oriented Investments)
• By Types of Real Estate Assets (Residential Properties, Commercial Properties, Industrial Properties, Mixed-use Developments, Retail Properties)
• By Investor Type (Institutional Investors, Individual Investors, Real Estate Investment Trusts (REITs), Pension Fund Managers, Family Offices)
• By Risk Tolerance (Low-risk Tolerance Investments, Moderate-risk Tolerance Investments, High-risk Tolerance Investments, Value-add Investments, Core Investments)
Regional Analysis/Coverage North America (US, Canada, Mexico), Europe (Germany, France, UK, Italy, Spain, Poland, Turkey, Rest of Europe), Asia Pacific (China, India, Japan, South Korea, Singapore, Australia, Rest of Asia Pacific), Middle East & Africa (UAE, Saudi Arabia, Qatar, South Africa, Rest of Middle East & Africa), Latin America (Brazil, Argentina, Rest of Latin America)
Company Profiles China Poly Group Corporation, China Vanke Co. Ltd, China Resources Land Holdings Limited, Capital Land Limited, Greenland Holdings Corporation Limited, Zhejiang Yuntian Group Co. Ltd, Del E. Webb Construction Company, Groupe Primonial, Cofinimmo, Korian, Orpea, Domusvi, Silver Care, Dussmann, Tertianum Group

Frequently Asked Questions

Ans: The Pension Real Estate Market is projected to grow at a CAGR of 7.70% during 2025-2032, driven by rising pension allocations

Ans: In 2024, the Pension Real Estate Market was valued at USD 1.67 trillion, with steady global investments in stable, income-generating real estate assets.

Ans: Increasing global life expectancy and aging populations are driving higher demand for stable, long-term real estate investments by pension funds.

Ans: Defined Benefit Plans dominated in 2024 with a 31% share due to their preference for stable, long-duration real estate returns.

Ans: North America led the market in 2024 with 39% revenue share, backed by a mature pension system and strong real estate infrastructure.

Table of Contents:

1. Introduction

1.1 Market Definition

1.2 Scope (Inclusion and Exclusions)

1.3 Research Assumptions

2. Executive Summary

2.1 Market Overview

2.2 Regional Synopsis

2.3 Competitive Summary

3. Research Methodology

3.1 Top-Down Approach

3.2 Bottom-up Approach

3.3. Data Validation

3.4 Primary Interviews

4. Market Dynamics Impact Analysis

4.1 Market Driving Factors Analysis

4.1.1 Drivers

4.1.2 Restraints

4.2 PESTLE Analysis

4.3 Porter’s Five Forces Model

5. Statistical Insights and Trends Reporting

5.1 Transaction & Deal Flow Statistics

5.2 Asset Management Cost Statistics

5.3 Development vs. Acquisition Stats

5.4 Geopolitical/Regulatory Exposure

5.5 Insurance and Disaster Resilience

5.7 Risk & Exposure Indicators

6. Competitive Landscape

6.1 List of Major Companies, By Region

6.2 Market Share Analysis, By Region

6.3 Product Benchmarking

6.3.1 Product specifications and features

6.3.2 Pricing

6.4 Strategic Initiatives

6.4.1 Marketing and promotional activities

6.4.2 Distribution and supply chain strategies

6.4.3 Expansion plans and new product launches

6.4.4 Strategic partnerships and collaborations

6.5 Technological Advancements

6.6 Market Positioning and Branding

7. Pension Real Estate Market Segmentation, By Type of Pension Plans

7.1 Chapter Overview

7.2 Defined Benefit Plans

7.2.1 Defined Benefit Plans Market Trends Analysis (2020-2032)

7.2.2 Defined Benefit Plans Market Size Estimates and Forecasts to 2032 (USD Trillion)

7.3 Defined Contribution Plans

7.3.1 Defined Contribution Plans Market Trends Analysis (2020-2032)

7.3.2 Defined Contribution Plans Market Size Estimates and Forecasts to 2032 (USD Trillion)

7.4 Hybrid Plans

7.4.1 Hybrid Plans Market Trends Analysis (2020-2032)

7.4.2 Hybrid Plans Market Size Estimates and Forecasts to 2032 (USD Trillion)

7.5 Government Pension Plans

7.5.1 Government Pension Plans Market Trends Analysis (2020-2032)

7.5.2 Government Pension Plans Market Size Estimates and Forecasts to 2032 (USD Trillion)

7.6 Corporate Pension Plans

7.6.1 Corporate Pension Plans Market Trends Analysis (2020-2032)

7.6.2 Corporate Pension Plans Market Size Estimates and Forecasts to 2032 (USD Trillion)

8. Pension Real Estate Market Segmentation, By Investment Strategy

8.1 Chapter Overview

8.2 Conservative Strategies

8.2.1 Conservative Strategies Market Trends Analysis (2020-2032)

8.2.2 Conservative Strategies Market Size Estimates And Forecasts To 2032 (USD Trillion)

8.3 Aggressive Strategies

8.3.1 Aggressive Strategies Market Trends Analysis (2020-2032)

8.3.2 Aggressive Strategies Market Size Estimates And Forecasts To 2032 (USD Trillion)

8.4 Balanced Strategies

8.4.1 Balanced Strategies Market Trends Analysis (2020-2032)

8.4.2 Balanced Strategies Market Size Estimates And Forecasts To 2032 (USD Trillion)

8.5 Income-focused Investments

8.5.1 Income-focused Investments Market Trends Analysis (2020-2032)

8.5.2 Income-focused Investments Market Size Estimates And Forecasts To 2032 (USD Trillion)

8.6 Growth-oriented Investments

8.6.1 Growth-oriented Investments Market Trends Analysis (2020-2032)

8.6.2 Growth-oriented Investments Market Size Estimates And Forecasts To 2032 (USD Trillion)

9. Pension Real Estate Market Segmentation, By Types of Real Estate Assets

9.1 Chapter Overview

9.2 Residential Properties

9.2.1 Residential Properties Market Trends Analysis (2020-2032)

9.2.2 Residential Properties Market Size Estimates And Forecasts To 2032 (USD Trillion)

9.3 Commercial Properties

9.3.1 Commercial Properties Market Trends Analysis (2020-2032)

9.3.2 Commercial Properties Market Size Estimates And Forecasts To 2032 (USD Trillion)

9.4 Industrial Properties

9.4.1 Industrial Properties Market Trends Analysis (2020-2032)

9.4.2 Industrial Properties Market Size Estimates And Forecasts To 2032 (USD Trillion)

9.5 Mixed-use Developments

9.5.1 Mixed-use Developments Market Trends Analysis (2020-2032)

9.5.2 Mixed-use Developments Market Size Estimates And Forecasts To 2032 (USD Trillion)

9.6 Retail Properties

9.6.1 Retail Properties Market Trends Analysis (2020-2032)

9.6.2 Retail Properties Market Size Estimates And Forecasts To 2032 (USD Trillion)

10. Pension Real Estate Market Segmentation, By Investor Type

10.1 Chapter Overview

10.2 Institutional Investors

10.2.1 Institutional Investors Market Trends Analysis (2020-2032)

10.2.2 Institutional Investors Market Size Estimates And Forecasts To 2032 (USD Trillion)

10.3 Individual Investors

10.3.1 Individual Investors Market Trends Analysis (2020-2032)

10.3.2 Individual Investors Market Size Estimates And Forecasts To 2032 (USD Trillion)

10.4 Real Estate Investment Trusts (REITs)

10.4.1 Real Estate Investment Trusts (REITs) Market Trends Analysis (2020-2032)

10.4.2 Real Estate Investment Trusts (REITs) Market Size Estimates And Forecasts To 2032 (USD Trillion)

10.5 Pension Fund Managers

10.5.1 Pension Fund Managers Market Trends Analysis (2020-2032)

10.5.2 Pension Fund Managers Market Size Estimates And Forecasts To 2032 (USD Trillion)

10.6 Family Offices

10.6.1 Family Offices Market Trends Analysis (2020-2032)

10.6.2 Family Offices Market Size Estimates And Forecasts To 2032 (USD Trillion)

11. Pension Real Estate Market Segmentation, By Risk Tolerance

11.1 Chapter Overview

11.2 Low-risk Tolerance Investments

11.2.1 Low-risk Tolerance Investments Market Trends Analysis (2020-2032)

11.2.2 Low-risk Tolerance Investments Market Size Estimates And Forecasts To 2032 (USD Trillion)

11.3 Moderate-risk Tolerance Investments

11.3.1 Moderate-risk Tolerance Investments Market Trends Analysis (2020-2032)

11.3.2 Moderate-risk Tolerance Investments Market Size Estimates And Forecasts To 2032 (USD Trillion)

11.4 High-risk Tolerance Investments

11.4.1 High-risk Tolerance Investments Market Trends Analysis (2020-2032)

11.4.2 High-risk Tolerance Investments Market Size Estimates And Forecasts To 2032 (USD Trillion)

11.5 Value-add Investments

11.5.1 Value-add Investments Market Trends Analysis (2020-2032)

11.5.2 Value-add Investments Market Size Estimates And Forecasts To 2032 (USD Trillion)

11.6 Core Investments

11.6.1 Core Investments Market Trends Analysis (2020-2032)

11.6.2 Core Investments Market Size Estimates And Forecasts To 2032 (USD Trillion)

12. Regional Analysis

12.1 Chapter Overview

12.2 North America

12.2.1 Trends Analysis

12.2.2 North America Pension Real Estate Market Estimates And Forecasts, By Country (2020-2032) (USD Trillion)

12.2.3 North America Pension Real Estate Market Estimates And Forecasts, By Type of Pension Plans (2020-2032) (USD Trillion)

12.2.4 North America Pension Real Estate Market Estimates And Forecasts, By Investment Strategy (2020-2032) (USD Trillion)

12.2.5 North America Pension Real Estate Market Estimates And Forecasts, By Types of Real Estate Assets (2020-2032) (USD Trillion)

12.2.6 North America Pension Real Estate Market Estimates And Forecasts, By Investor Type (2020-2032) (USD Trillion)

12.2.7 North America Pension Real Estate Market Estimates And Forecasts, By Risk Tolerance (2020-2032) (USD Trillion)

12.2.8 USA

12.2.8.1 USA Pension Real Estate Market Estimates And Forecasts, By Type of Pension Plans (2020-2032) (USD Trillion)

12.2.8.2 USA Pension Real Estate Market Estimates And Forecasts, By Investment Strategy (2020-2032) (USD Trillion)

12.2.8.3 USA Pension Real Estate Market Estimates And Forecasts, By Types of Real Estate Assets (2020-2032) (USD Trillion)

12.2.8.4 USA Pension Real Estate Market Estimates And Forecasts, By Investor Type (2020-2032) (USD Trillion)

12.2.8.5 USA Pension Real Estate Market Estimates And Forecasts, By Risk Tolerance (2020-2032) (USD Trillion)

12.2.9 Canada

12.2.9.1 Canada Pension Real Estate Market Estimates And Forecasts, By Type of Pension Plans (2020-2032) (USD Trillion)

12.2.9.2 Canada Pension Real Estate Market Estimates And Forecasts, By Investment Strategy (2020-2032) (USD Trillion)

12.2.9.3 Canada Pension Real Estate Market Estimates And Forecasts, By Types of Real Estate Assets (2020-2032) (USD Trillion)

12.2.9.4 Canada Pension Real Estate Market Estimates And Forecasts, By Investor Type (2020-2032) (USD Trillion)

12.2.9.5 Canada Pension Real Estate Market Estimates And Forecasts, By Risk Tolerance (2020-2032) (USD Trillion)

12.2.10 Mexico

12.2.10.1 Mexico Pension Real Estate Market Estimates And Forecasts, By Type of Pension Plans (2020-2032) (USD Trillion)

12.2.10.2 Mexico Pension Real Estate Market Estimates And Forecasts, By Investment Strategy (2020-2032) (USD Trillion)

12.2.10.3 Mexico Pension Real Estate Market Estimates And Forecasts, By Types of Real Estate Assets (2020-2032) (USD Trillion)

12.2.10.4 Mexico Pension Real Estate Market Estimates And Forecasts, By Investor Type (2020-2032) (USD Trillion)

12.2.10.5 Mexico Pension Real Estate Market Estimates And Forecasts, By Risk Tolerance (2020-2032) (USD Trillion)

12.3 Europe

12.3.1 Trends Analysis

12.3.2 Eastern Europe Pension Real Estate Market Estimates And Forecasts, By Country (2020-2032) (USD Trillion)

12.3.3 Eastern Europe Pension Real Estate Market Estimates And Forecasts, By Type of Pension Plans (2020-2032) (USD Trillion)

12.3.4 Eastern Europe Pension Real Estate Market Estimates And Forecasts, By Investment Strategy (2020-2032) (USD Trillion)

12.3.5 Eastern Europe Pension Real Estate Market Estimates And Forecasts, By Types of Real Estate Assets (2020-2032) (USD Trillion)

12.3.6 Eastern Europe Pension Real Estate Market Estimates And Forecasts, By Investor Type (2020-2032) (USD Trillion)

12.3.7 Eastern Europe Pension Real Estate Market Estimates And Forecasts, By Risk Tolerance (2020-2032) (USD Trillion)

12.3.8 Poland

12.3.8.1 Poland Pension Real Estate Market Estimates And Forecasts, By Type of Pension Plans (2020-2032) (USD Trillion)

12.3.8.2 Poland Pension Real Estate Market Estimates And Forecasts, By Investment Strategy (2020-2032) (USD Trillion)

12.3.8.3 Poland Pension Real Estate Market Estimates And Forecasts, By Types of Real Estate Assets (2020-2032) (USD Trillion)

12.3.8.4 Poland Pension Real Estate Market Estimates And Forecasts, By Investor Type (2020-2032) (USD Trillion)

12.3.8.5 Poland Pension Real Estate Market Estimates And Forecasts, By Risk Tolerance (2020-2032) (USD Trillion)

12.3.9 Turkey

12.3.9.1 Turkey Pension Real Estate Market Estimates And Forecasts, By Type of Pension Plans (2020-2032) (USD Trillion)

12.3.9.2 Turkey Pension Real Estate Market Estimates And Forecasts, By Investment Strategy (2020-2032) (USD Trillion)

12.3.9.3 Turkey Pension Real Estate Market Estimates And Forecasts, By Types of Real Estate Assets (2020-2032) (USD Trillion)

12.3.9.4 Turkey Pension Real Estate Market Estimates And Forecasts, By Investor Type (2020-2032) (USD Trillion)

12.3.9.5 Turkey Pension Real Estate Market Estimates And Forecasts, By Risk Tolerance (2020-2032) (USD Trillion)

12.3.10 Germany

12.3.10.1 Germany Pension Real Estate Market Estimates And Forecasts, By Type of Pension Plans (2020-2032) (USD Trillion)

12.3.10.2 Germany Pension Real Estate Market Estimates And Forecasts, By Investment Strategy (2020-2032) (USD Trillion)

12.3.10.3 Germany Pension Real Estate Market Estimates And Forecasts, By Types of Real Estate Assets (2020-2032) (USD Trillion)

12.3.10.4 Germany Pension Real Estate Market Estimates And Forecasts, By Investor Type (2020-2032) (USD Trillion)

12.3.10.5 Germany Pension Real Estate Market Estimates And Forecasts, By Risk Tolerance (2020-2032) (USD Trillion)

12.3.11 France

12.3.11.1 France Pension Real Estate Market Estimates And Forecasts, By Type of Pension Plans (2020-2032) (USD Trillion)

12.3.11.2 France Pension Real Estate Market Estimates And Forecasts, By Investment Strategy (2020-2032) (USD Trillion)

12.3.11.3 France Pension Real Estate Market Estimates And Forecasts, By Types of Real Estate Assets (2020-2032) (USD Trillion)

12.3.11.4 France Pension Real Estate Market Estimates And Forecasts, By Investor Type (2020-2032) (USD Trillion)

12.3.11.5 France Pension Real Estate Market Estimates And Forecasts, By Risk Tolerance (2020-2032) (USD Trillion)

12.3.12 UK

12.3.12.1 UK Pension Real Estate Market Estimates And Forecasts, By Type of Pension Plans (2020-2032) (USD Trillion)

12.3.12.2 UK Pension Real Estate Market Estimates And Forecasts, By Investment Strategy (2020-2032) (USD Trillion)

12.3.12.3 UK Pension Real Estate Market Estimates And Forecasts, By Types of Real Estate Assets (2020-2032) (USD Trillion)

12.3.12.4 UK Pension Real Estate Market Estimates And Forecasts, By Investor Type (2020-2032) (USD Trillion)

12.3.12.5 UK Pension Real Estate Market Estimates And Forecasts, By Risk Tolerance (2020-2032) (USD Trillion)

12.3.13 Italy

12.3.13.1 Italy Pension Real Estate Market Estimates And Forecasts, By Type of Pension Plans (2020-2032) (USD Trillion)

12.3.13.2 Italy Pension Real Estate Market Estimates And Forecasts, By Investment Strategy (2020-2032) (USD Trillion)

12.3.13.3 Italy Pension Real Estate Market Estimates And Forecasts, By Types of Real Estate Assets (2020-2032) (USD Trillion)

12.3.13.4 Italy Pension Real Estate Market Estimates And Forecasts, By Investor Type (2020-2032) (USD Trillion)

12.3.13.5 Italy Pension Real Estate Market Estimates And Forecasts, By Risk Tolerance (2020-2032) (USD Trillion)

12.3.14 Spain

12.3.14.1 Spain Pension Real Estate Market Estimates And Forecasts, By Type of Pension Plans (2020-2032) (USD Trillion)

12.3.14.2 Spain Pension Real Estate Market Estimates And Forecasts, By Investment Strategy (2020-2032) (USD Trillion)

12.3.14.3 Spain Pension Real Estate Market Estimates And Forecasts, By Types of Real Estate Assets (2020-2032) (USD Trillion)

12.3.14.4 Spain Pension Real Estate Market Estimates And Forecasts, By Investor Type (2020-2032) (USD Trillion)

12.3.14.5 Spain Pension Real Estate Market Estimates And Forecasts, By Risk Tolerance (2020-2032) (USD Trillion)

12.3.15 Rest Of Europe

12.3.15.1 Rest Of Western Europe Pension Real Estate Market Estimates And Forecasts, By Type of Pension Plans (2020-2032) (USD Trillion)

12.3.15.2 Rest Of Western Europe Pension Real Estate Market Estimates And Forecasts, By Investment Strategy (2020-2032) (USD Trillion)

12.3.15.3 Rest Of Western Europe Pension Real Estate Market Estimates And Forecasts, By Types of Real Estate Assets (2020-2032) (USD Trillion)

12.3.15.4 Rest Of Western Europe Pension Real Estate Market Estimates And Forecasts, By Investor Type (2020-2032) (USD Trillion)

12.3.15.5 Rest Of Western Europe Pension Real Estate Market Estimates And Forecasts, By Risk Tolerance (2020-2032) (USD Trillion)

12.4 Asia Pacific

12.4.1 Trends Analysis

12.4.2 Asia Pacific Pension Real Estate Market Estimates And Forecasts, By Country (2020-2032) (USD Trillion)

12.4.3 Asia Pacific Pension Real Estate Market Estimates And Forecasts, By Type of Pension Plans (2020-2032) (USD Trillion)

12.4.4 Asia Pacific Pension Real Estate Market Estimates And Forecasts, By Investment Strategy (2020-2032) (USD Trillion)

12.4.5 Asia Pacific Pension Real Estate Market Estimates And Forecasts, By Types of Real Estate Assets (2020-2032) (USD Trillion)

12.4.6 Asia Pacific Pension Real Estate Market Estimates And Forecasts, By Investor Type (2020-2032) (USD Trillion)

12.4.7 Asia Pacific Pension Real Estate Market Estimates And Forecasts, By Risk Tolerance (2020-2032) (USD Trillion)

12.4.8 China

12.4.8.1 China Pension Real Estate Market Estimates And Forecasts, By Type of Pension Plans (2020-2032) (USD Trillion)

12.4.8.2 China Pension Real Estate Market Estimates And Forecasts, By Investment Strategy (2020-2032) (USD Trillion)

12.4.8.3 China Pension Real Estate Market Estimates And Forecasts, By Types of Real Estate Assets (2020-2032) (USD Trillion)

12.4.8.4 China Pension Real Estate Market Estimates And Forecasts, By Investor Type (2020-2032) (USD Trillion)

12.4.8.5 China Pension Real Estate Market Estimates And Forecasts, By Risk Tolerance (2020-2032) (USD Trillion)

12.4.9 India

12.4.9.1 India Pension Real Estate Market Estimates And Forecasts, By Type of Pension Plans (2020-2032) (USD Trillion)

12.4.9.2 India Pension Real Estate Market Estimates And Forecasts, By Investment Strategy (2020-2032) (USD Trillion)

12.4.9.3 India Pension Real Estate Market Estimates And Forecasts, By Types of Real Estate Assets (2020-2032) (USD Trillion)

12.4.9.4 India Pension Real Estate Market Estimates And Forecasts, By Investor Type (2020-2032) (USD Trillion)

12.4.9.5 India Pension Real Estate Market Estimates And Forecasts, By Risk Tolerance (2020-2032) (USD Trillion)

12.4.10 Japan

12.4.10.1 Japan Pension Real Estate Market Estimates And Forecasts, By Type of Pension Plans (2020-2032) (USD Trillion)

12.4.10.2 Japan Pension Real Estate Market Estimates And Forecasts, By Investment Strategy (2020-2032) (USD Trillion)

12.4.10.3 Japan Pension Real Estate Market Estimates And Forecasts, By Types of Real Estate Assets (2020-2032) (USD Trillion)

12.4.10.4 Japan Pension Real Estate Market Estimates And Forecasts, By Investor Type (2020-2032) (USD Trillion)

12.4.10.5 Japan Pension Real Estate Market Estimates And Forecasts, By Risk Tolerance (2020-2032) (USD Trillion)

12.4.11 South Korea

12.4.11.1 South Korea Pension Real Estate Market Estimates And Forecasts, By Type of Pension Plans (2020-2032) (USD Trillion)

12.4.11.2 South Korea Pension Real Estate Market Estimates And Forecasts, By Investment Strategy (2020-2032) (USD Trillion)

12.4.11.3 South Korea Pension Real Estate Market Estimates And Forecasts, By Types of Real Estate Assets (2020-2032) (USD Trillion)

12.4.11.4 South Korea Pension Real Estate Market Estimates And Forecasts, By Investor Type (2020-2032) (USD Trillion)

12.4.11.5 South Korea Pension Real Estate Market Estimates And Forecasts, By Risk Tolerance (2020-2032) (USD Trillion)

12.4.12 Singapore

12.4.12.1 Singapore Pension Real Estate Market Estimates And Forecasts, By Type of Pension Plans (2020-2032) (USD Trillion)

12.4.12.2 Singapore Pension Real Estate Market Estimates And Forecasts, By Investment Strategy (2020-2032) (USD Trillion)

12.4.12.3 Singapore Pension Real Estate Market Estimates And Forecasts, By Types of Real Estate Assets (2020-2032) (USD Trillion)

12.4.12.4 Singapore Pension Real Estate Market Estimates And Forecasts, By Investor Type (2020-2032) (USD Trillion)

12.4.12.5 Singapore Pension Real Estate Market Estimates And Forecasts, By Risk Tolerance (2020-2032) (USD Trillion)

12.4.13 Australia

12.4.13.1 Australia Pension Real Estate Market Estimates And Forecasts, By Type of Pension Plans (2020-2032) (USD Trillion)

12.4.13.2 Australia Pension Real Estate Market Estimates And Forecasts, By Investment Strategy (2020-2032) (USD Trillion)

12.4.13.3 Australia Pension Real Estate Market Estimates And Forecasts, By Types of Real Estate Assets (2020-2032) (USD Trillion)

12.4.13.4 Australia Pension Real Estate Market Estimates And Forecasts, By Investor Type (2020-2032) (USD Trillion)

12.4.13.5 Australia Pension Real Estate Market Estimates And Forecasts, By Risk Tolerance (2020-2032) (USD Trillion)

12.4.14 Rest Of Asia Pacific

12.4.14.1 Rest Of Asia Pacific Pension Real Estate Market Estimates And Forecasts, By Type of Pension Plans (2020-2032) (USD Trillion)

12.4.14.2 Rest Of Asia Pacific Pension Real Estate Market Estimates And Forecasts, By Investment Strategy (2020-2032) (USD Trillion)

12.4.14.3 Rest Of Asia Pacific Pension Real Estate Market Estimates And Forecasts, By Types of Real Estate Assets (2020-2032) (USD Trillion)

12.4.14.4 Rest Of Asia Pacific Pension Real Estate Market Estimates And Forecasts, By Investor Type (2020-2032) (USD Trillion)

12.4.14.5 Rest Of Asia Pacific Pension Real Estate Market Estimates And Forecasts, By Risk Tolerance (2020-2032) (USD Trillion)

12.5 Middle East And Africa

12.5.1 Trends Analysis

12.5.2 Middle East And Africa Pension Real Estate Market Estimates And Forecasts, By Country (2020-2032) (USD Trillion)

12.5.3 Middle East And Africa Pension Real Estate Market Estimates And Forecasts, By Type of Pension Plans (2020-2032) (USD Trillion)

12.5.4 Middle East And Africa  Pension Real Estate Market Estimates And Forecasts, By Investment Strategy (2020-2032) (USD Trillion)

12.5.5 Middle East And Africa Pension Real Estate Market Estimates And Forecasts, By Types of Real Estate Assets (2020-2032) (USD Trillion)

12.5.6 Middle East And Africa Pension Real Estate Market Estimates And Forecasts, By Investor Type (2020-2032) (USD Trillion)

12.5.7 Middle East And Africa Pension Real Estate Market Estimates And Forecasts, By Risk Tolerance (2020-2032) (USD Trillion)

12.5.8 UAE

12.5.8.1 UAE Pension Real Estate Market Estimates And Forecasts, By Type of Pension Plans (2020-2032) (USD Trillion)

12.5.8.2 UAE Pension Real Estate Market Estimates And Forecasts, By Investment Strategy (2020-2032) (USD Trillion)

12.5.8.3 UAE Pension Real Estate Market Estimates And Forecasts, By Types of Real Estate Assets (2020-2032) (USD Trillion)

12.5.8.4 UAE Pension Real Estate Market Estimates And Forecasts, By Investor Type (2020-2032) (USD Trillion)

12.5.8.5 UAE Pension Real Estate Market Estimates And Forecasts, By Risk Tolerance (2020-2032) (USD Trillion)

12.5.9 Saudi Arabia

12.5.9.1 Saudi Arabia Pension Real Estate Market Estimates And Forecasts, By Type of Pension Plans (2020-2032) (USD Trillion)

12.5.9.2 Saudi Arabia Pension Real Estate Market Estimates And Forecasts, By Investment Strategy (2020-2032) (USD Trillion)

12.5.9.3 Saudi Arabia Pension Real Estate Market Estimates And Forecasts, By Types of Real Estate Assets (2020-2032) (USD Trillion)

12.5.9.4 Saudi Arabia Pension Real Estate Market Estimates And Forecasts, By Investor Type (2020-2032) (USD Trillion)

12.5.9.5 Saudi Arabia Pension Real Estate Market Estimates And Forecasts, By Risk Tolerance (2020-2032) (USD Trillion)

12.5.10 Qatar

12.5.10.1 Qatar Pension Real Estate Market Estimates And Forecasts, By Type of Pension Plans (2020-2032) (USD Trillion)

12.5.10.2 Qatar Pension Real Estate Market Estimates And Forecasts, By Investment Strategy (2020-2032) (USD Trillion)

12.5.10.3 Qatar Pension Real Estate Market Estimates And Forecasts, By Types of Real Estate Assets (2020-2032) (USD Trillion)

12.5.10.4 Qatar Pension Real Estate Market Estimates And Forecasts, By Investor Type (2020-2032) (USD Trillion)

12.5.10.5 Qatar Pension Real Estate Market Estimates And Forecasts, By Risk Tolerance (2020-2032) (USD Trillion)

12.5.11 South Africa

12.5.11.1 South Africa Pension Real Estate Market Estimates And Forecasts, By Type of Pension Plans (2020-2032) (USD Trillion)

12.5.11.2 South Africa Pension Real Estate Market Estimates And Forecasts, By Investment Strategy (2020-2032) (USD Trillion)

12.5.11.3 South Africa Pension Real Estate Market Estimates And Forecasts, By Types of Real Estate Assets (2020-2032) (USD Trillion)

12.5.11.4 South Africa Pension Real Estate Market Estimates And Forecasts, By Investor Type (2020-2032) (USD Trillion)

12.5.11.5 South Africa Pension Real Estate Market Estimates And Forecasts, By Risk Tolerance (2020-2032) (USD Trillion)

12.5.12 Rest Of Africa

12.5.12.1 Rest Of Africa Pension Real Estate Market Estimates And Forecasts, By Type of Pension Plans (2020-2032) (USD Trillion)

12.5.12.2 Rest Of Africa Pension Real Estate Market Estimates And Forecasts, By Investment Strategy (2020-2032) (USD Trillion)

12.5.12.3 Rest Of Africa Pension Real Estate Market Estimates And Forecasts, By Types of Real Estate Assets (2020-2032) (USD Trillion)

12.5.12.4 Rest Of Africa Pension Real Estate Market Estimates And Forecasts, By Investor Type (2020-2032) (USD Trillion)

12.5.12.5 Rest Of Africa Pension Real Estate Market Estimates And Forecasts, By Risk Tolerance (2020-2032) (USD Trillion)

12.6 Latin America

12.6.1 Trends Analysis

12.6.2 Latin America Pension Real Estate Market Estimates And Forecasts, By Country (2020-2032) (USD Trillion)

12.6.3 Latin America Pension Real Estate Market Estimates And Forecasts, By Type of Pension Plans (2020-2032) (USD Trillion)

12.6.4 Latin America Pension Real Estate Market Estimates And Forecasts, By Investment Strategy (2020-2032) (USD Trillion)

12.6.5 Latin America Pension Real Estate Market Estimates And Forecasts, By Types of Real Estate Assets (2020-2032) (USD Trillion)

12.6.6 Latin America Pension Real Estate Market Estimates And Forecasts, By Investor Type (2020-2032) (USD Trillion)

12.6.7 Latin America Pension Real Estate Market Estimates And Forecasts, By Risk Tolerance (2020-2032) (USD Trillion)

12.6.8 Brazil

12.6.8.1 Brazil Pension Real Estate Market Estimates And Forecasts, By Type of Pension Plans (2020-2032) (USD Trillion)

12.6.8.2 Brazil Pension Real Estate Market Estimates And Forecasts, By Investment Strategy (2020-2032) (USD Trillion)

12.6.8.3 Brazil Pension Real Estate Market Estimates And Forecasts, By Types of Real Estate Assets (2020-2032) (USD Trillion)

12.6.8.4 Brazil Pension Real Estate Market Estimates And Forecasts, By Investor Type (2020-2032) (USD Trillion)

12.6.8.5 Brazil Pension Real Estate Market Estimates And Forecasts, By Risk Tolerance (2020-2032) (USD Trillion)

12.6.9 Argentina

12.6.9.1 Argentina Pension Real Estate Market Estimates And Forecasts, By Type of Pension Plans (2020-2032) (USD Trillion)

12.6.9.2 Argentina Pension Real Estate Market Estimates And Forecasts, By Investment Strategy (2020-2032) (USD Trillion)

12.6.9.3 Argentina Pension Real Estate Market Estimates And Forecasts, By Types of Real Estate Assets (2020-2032) (USD Trillion)

12.6.9.4 Argentina Pension Real Estate Market Estimates And Forecasts, By Investor Type (2020-2032) (USD Trillion)

12.6.9.5 Argentina Pension Real Estate Market Estimates And Forecasts, By Risk Tolerance (2020-2032) (USD Trillion)

12.6.10 Rest Of Latin America

12.6.10.1 Rest Of Latin America Pension Real Estate Market Estimates And Forecasts, By Type of Pension Plans (2020-2032) (USD Trillion)

12.6.10.2 Rest Of Latin America Pension Real Estate Market Estimates And Forecasts, By Investment Strategy (2020-2032) (USD Trillion)

12.6.10.3 Rest Of Latin America Pension Real Estate Market Estimates And Forecasts, By Types of Real Estate Assets (2020-2032) (USD Trillion)

12.6.10.4 Rest Of Latin America Pension Real Estate Market Estimates And Forecasts, By Investor Type (2020-2032) (USD Trillion)

12.6.10.5 Rest Of Latin America Pension Real Estate Market Estimates And Forecasts, By Risk Tolerance (2020-2032) (USD Trillion)

13. Company Profiles

     13.1 China Poly Group Corporation

13.1.1 Company Overview

13.1.2 Financial

13.1.3 Products/ Defined Contribution Plans Offered

13.1.4 SWOT Analysis

    13.2 China Vanke Co. Ltd,         

13.2.1 Company Overview

13.2.2 Financial

13.2.3 Products/ Defined Contribution Plans Offered

13.2.4 SWOT Analysis

   13.3 China Resources Land Holdings Limited

13.3.1 Company Overview

13.3.2 Financial

13.3.3 Products/ Defined Contribution Plans Offered

13.3.4 SWOT Analysis

  13.4 Capital Land Limited

13.4.1 Company Overview

13.4.2 Financial

13.4.3 Products/ Defined Contribution Plans Offered

13.4.4 SWOT Analysis

  13.5 Greenland Holdings Corporation Limited

13.5.1 Company Overview

13.5.2 Financial

13.5.3 Products/ Defined Contribution Plans Offered

13.5.4 SWOT Analysis

  13.6 Zhejiang Yuntian Group Co. Ltd

13.6.1 Company Overview

13.6.2 Financial

13.6.3 Products/ Defined Contribution Plans Offered

13.6.4 SWOT Analysis

 13.7 Groupe Primonial

13.7.1 Company Overview

13.7.2 Financial

13.7.3 Products/ Defined Contribution Plans Offered

13.7.4 SWOT Analysis

 13.8 Cofinimmo

13.8.1 Company Overview

13.8.2 Financial

13.8.3 Products/ Defined Contribution Plans Offered

13.8.4 SWOT Analysis

 13.9 Korian

13.9.1 Company Overview

13.9.2 Financial

13.9.3 Products/ Defined Contribution Plans Offered

13.9.4 SWOT Analysis

  13.10 Orpea

13.10.1 Company Overview

13.10.2 Financial

13.10.3 Products/ Defined Contribution Plans Offered

13.10.4 SWOT Analysis

14. Use Cases and Best Practices

15. Conclusion

An accurate research report requires proper strategizing as well as implementation. There are multiple factors involved in the completion of good and accurate research report and selecting the best methodology to compete the research is the toughest part. Since the research reports we provide play a crucial role in any company’s decision-making process, therefore we at SNS Insider always believe that we should choose the best method which gives us results closer to reality. This allows us to reach at a stage wherein we can provide our clients best and accurate investment to output ratio.

Each report that we prepare takes a timeframe of 350-400 business hours for production. Starting from the selection of titles through a couple of in-depth brain storming session to the final QC process before uploading our titles on our website we dedicate around 350 working hours. The titles are selected based on their current market cap and the foreseen CAGR and growth.


The 5 steps process:

Step 1: Secondary Research:

Secondary Research or Desk Research is as the name suggests is a research process wherein, we collect data through the readily available information. In this process we use various paid and unpaid databases which our team has access to and gather data through the same. This includes examining of listed companies’ annual reports, Journals, SEC filling etc. Apart from this our team has access to various associations across the globe across different industries. Lastly, we have exchange relationships with various university as well as individual libraries.

Secondary Research

Step 2: Primary Research

When we talk about primary research, it is a type of study in which the researchers collect relevant data samples directly, rather than relying on previously collected data.  This type of research is focused on gaining content specific facts that can be sued to solve specific problems. Since the collected data is fresh and first hand therefore it makes the study more accurate and genuine.

We at SNS Insider have divided Primary Research into 2 parts.

Part 1 wherein we interview the KOLs of major players as well as the upcoming ones across various geographic regions. This allows us to have their view over the market scenario and acts as an important tool to come closer to the accurate market numbers. As many as 45 paid and unpaid primary interviews are taken from both the demand and supply side of the industry to make sure we land at an accurate judgement and analysis of the market.

This step involves the triangulation of data wherein our team analyses the interview transcripts, online survey responses and observation of on filed participants. The below mentioned chart should give a better understanding of the part 1 of the primary interview.

Primary Research

Part 2: In this part of primary research the data collected via secondary research and the part 1 of the primary research is validated with the interviews from individual consultants and subject matter experts.

Consultants are those set of people who have at least 12 years of experience and expertise within the industry whereas Subject Matter Experts are those with at least 15 years of experience behind their back within the same space. The data with the help of two main processes i.e., FGDs (Focused Group Discussions) and IDs (Individual Discussions). This gives us a 3rd party nonbiased primary view of the market scenario making it a more dependable one while collation of the data pointers.

Step 3: Data Bank Validation

Once all the information is collected via primary and secondary sources, we run that information for data validation. At our intelligence centre our research heads track a lot of information related to the market which includes the quarterly reports, the daily stock prices, and other relevant information. Our data bank server gets updated every fortnight and that is how the information which we collected using our primary and secondary information is revalidated in real time.

Data Bank Validation

Step 4: QA/QC Process

After all the data collection and validation our team does a final level of quality check and quality assurance to get rid of any unwanted or undesired mistakes. This might include but not limited to getting rid of the any typos, duplication of numbers or missing of any important information. The people involved in this process include technical content writers, research heads and graphics people. Once this process is completed the title gets uploader on our platform for our clients to read it.

Step 5: Final QC/QA Process:

This is the last process and comes when the client has ordered the study. In this process a final QA/QC is done before the study is emailed to the client. Since we believe in giving our clients a good experience of our research studies, therefore, to make sure that we do not lack at our end in any way humanly possible we do a final round of quality check and then dispatch the study to the client.

Key Segments: 

By Type of Pension Plans

  • Defined Benefit Plans

  • Defined Contribution Plans

  • Hybrid Plans

  • Government Pension Plans

  • Corporate Pension Plans

By Investment Strategy

  • Conservative Strategies

  • Aggressive Strategies

  • Balanced Strategies

  • Income-focused Investments

  • Growth-oriented Investments

By Types of Real Estate Assets

  • Residential Properties

  • Commercial Properties

  • Industrial Properties

  • Mixed-use Developments

  • Retail Properties

By Investor Type

  • Institutional Investors

  • Individual Investors

  • Real Estate Investment Trusts (REITs)

  • Pension Fund Managers

  • Family Offices

By Risk Tolerance

  • Low-risk Tolerance Investments

  • Moderate-risk Tolerance Investments

  • High-risk Tolerance Investments

  • Value-add Investments

  • Core Investments


Request for Segment Customization as per your Business Requirement: Segment Customization Request

Regional Coverage: 

North America

  • US

  • Canada

  • Mexico

Europe

  • Germany

  • France

  • UK

  • Italy

  • Spain

  • Poland

  • Turkey

  • Rest of Europe

Asia Pacific

  • China

  • India

  • Japan

  • South Korea

  • Singapore

  • Australia

  • Rest of Asia Pacific

Middle East & Africa

  • UAE

  • Saudi Arabia

  • Qatar

  • South Africa

  • Rest of Middle East & Africa

Latin America

  • Brazil

  • Argentina

  • Rest of Latin America

Request for Country Level Research Report: Country Level Customization Request

Available Customization 

With the given market data, SNS Insider offers customization as per the company’s specific needs. The following customization options are available for the report: 

  • Detailed Volume Analysis 

  • Criss-Cross segment analysis (e.g. Product X Application) 

  • Competitive Product Benchmarking 

  • Geographic Analysis 

  • Additional countries in any of the regions 

  • Customized Data Representation 

  • Detailed analysis and profiling of additional market players

Explore Key Insights.


  • Analyzes market trends, forecasts, and regional dynamics
  • Covers core offerings, innovations, and industry use cases
  • Profiles major players, value chains, and strategic developments
  • Highlights innovation trends, regulatory impacts, and growth opportunities
Request an Analyst Call