Performing Art Companies Market Report Scope & Overview:
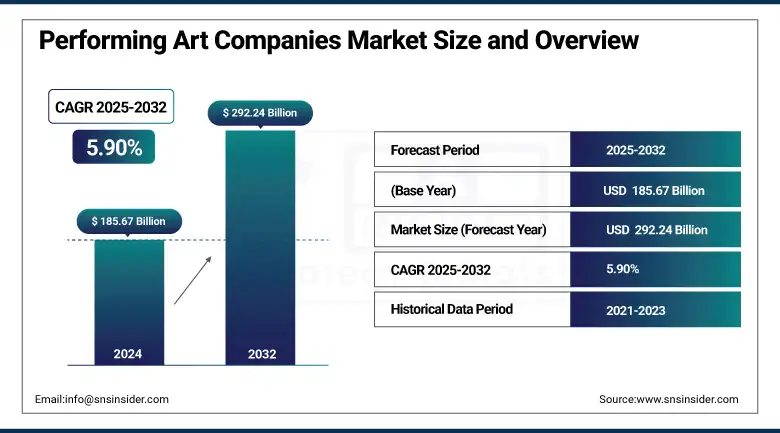
The Performing Art Companies Market Size was valued at USD 185.67 billion in 2024 and is expected to reach USD 292.24 billion by 2032 and grow at a CAGR of 5.90% over the forecast period 2025-2032.
The global performing art companies market showcases a dynamic blend of tradition and innovation. Encompassing theater, dance, opera, and live music, it thrives on cultural demand, tourism, and rising digital access. Companies in this space vary from small ensembles to renowned institutions, adapting to evolving audience preferences and tech-driven platforms. While economic fluctuations and shifting entertainment habits pose challenges, virtual performances and cross-border collaborations are opening new avenues. The market continues to play a pivotal role in preserving cultural heritage while pushing creative boundaries, offering growth opportunities through global outreach and diversified revenue streams in both physical and digital formats.
To Get more information On Performing Art Companies Market - Request Free Sample Report
According to research, the performing art companies market includes over 50,000 organizations globally, employing more than 1.2 million people across theater, dance, opera, and live music. These companies produce approximately 3 million performances annually, attracting audiences exceeding 500 million worldwide. The rise of digital platforms has led to a 40% increase in online viewership for live and recorded shows in recent years. While traditional in nature, the market is evolving through technological integration and global collaboration. Despite economic and operational challenges, performing arts remain a vital cultural force, with hybrid and virtual formats contributing to sustained audience engagement.
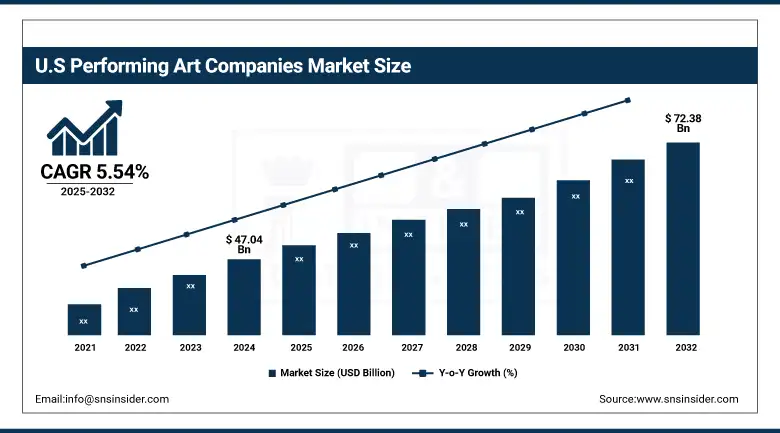
The U.S. Performing Art Companies Market size was USD 47.04 billion in 2024 and is expected to reach USD 72.38 billion by 2032, growing at a CAGR of 5.54% over the forecast period of 2025–2032. A key driving factor for the U.S. Performing Art Companies Market is the high consumer spending on arts, entertainment, and cultural experiences. The U.S. dominates the North American market due to its extensive infrastructure, and strong public and private funding support. Additionally, major urban centers like New York and Los Angeles serve as cultural hubs, attracting millions of attendees annually.
Market Dynamics
Key Drivers:
-
Rising Consumer Spending and Cultural Engagement in Urban Centers Drives Performing Art Companies Market Growth
The increasing demand for cultural experiences, particularly in major urban areas, continues to drive the growth of the performing art company’s market. As more consumers seek meaningful and immersive entertainment, live performances such as theater, dance, and music have gained popularity. This shift is particularly evident among younger demographics and tourists who view performing arts as a way to engage with culture and community. Urban centers such as New York City, Chicago, and Los Angeles offer world-renowned venues, contributing significantly to high attendance rates. Moreover, philanthropic contributions, government grants, and sponsorships have reinforced this trend by enabling innovation in programming and audience outreach. As cultural engagement becomes more experiential and personalized, performing art companies are leveraging new technologies to enhance live experiences.
In October 2022, Lincoln Center in New York reopened the newly renovated David Geffen Hall, offering modern acoustics and enhanced accessibility, boosting audience engagement and attendance.
Restraints:
High Operating Costs and Labor Expenses Restrain Growth of the Performing Art Companies Market
The U.S. performing art companies market faces significant restraints due to rising operational costs and labor-related expenditures. Maintaining a performing arts company involves substantial ongoing costs such as venue rentals, production design, licensing fees, insurance, and salaries for artistic and administrative staff. Labor, in particular, constitutes a large portion of expenses, given the highly skilled nature of performance and production roles. These high costs often limit the ability of companies to expand programming or invest in innovative formats. Smaller and mid-sized companies especially struggle to maintain profitability while delivering quality performances. Inflation and wage pressures have only intensified financial strain post-pandemic, pushing organizations to rely more heavily on donations and grants, which are not always consistent. Additionally, unionized labor negotiations for performers, technicians, and support staff often require higher compensation packages, which further tighten budgets. While demand remains strong, the cost-intensive nature of operations poses a consistent barrier to sustainable growth, particularly in a competitive and ever-evolving entertainment landscape.
Opportunities:
-
Digital Expansion and Virtual Ticketing Platforms Create New Revenue Streams for Performing Art Companies Market
The digital transformation of the performing arts industry presents a major opportunity for U.S. companies to diversify revenue and reach broader audiences. As consumers become more comfortable with virtual platforms, performing art companies are investing in livestreams, virtual reality experiences, and on-demand recorded performances. This shift not only increases accessibility for those unable to attend in person but also unlocks new monetization models such as digital ticketing, subscriptions, and global licensing. Digital innovation enables companies to analyze viewer data, customize offerings, and deepen engagement through interactive content. These technologies provide additional flexibility in programming and marketing, allowing companies to adapt quickly to market demand.
Challenges:
-
Dependence on Seasonal Attendance and Uncertain Sponsorships Challenge Stability of the U.S. Performing Art Companies Market
A major challenge for the U.S. performing art companies market is its heavy dependence on seasonal attendance and unpredictable funding sources. Most companies operate on seasonal schedules, with revenue often concentrated around specific months or events. This cyclical model makes financial planning difficult and leaves organizations vulnerable during off-peak periods.
Additionally, much of the industry’s funding comes from sponsorships, grants, and donations, which can fluctuate based on economic conditions and changing philanthropic priorities. When corporate sponsors shift their focus or economic downturns occur, performing art companies may experience abrupt revenue shortfalls. This dependency also limits long-term investments in new productions, marketing strategies, and talent development. Many companies are forced to scale back operations or delay projects due to funding uncertainties. Furthermore, audience attendance can vary depending on local economic conditions, weather, and competing entertainment options. These instabilities challenge the overall sustainability of the sector, requiring companies to diversify income streams and plan more resilient operating models.
Segmentation Analysis:
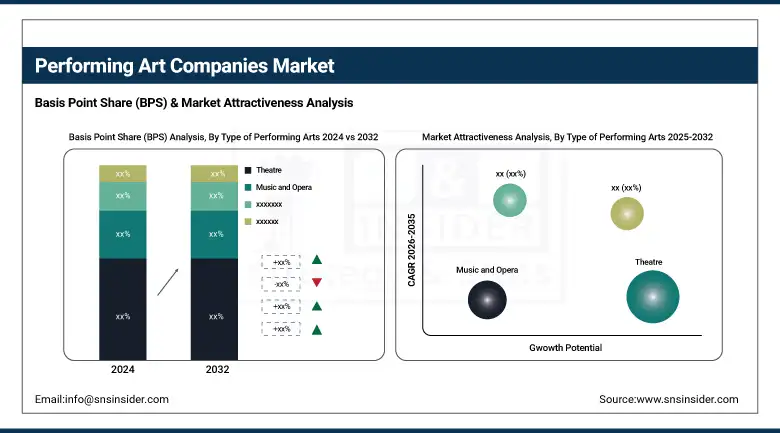
By Type of Performing Arts
The theatre segment holds the largest revenue share at 35% in 2024, driven by high urban demand and iconic institutions like Broadway and regional repertory companies. The launch of immersive theatre formats by companies such as Punchdrunk and the 2023 renovation of Broadway’s James Earl Jones Theatre have elevated audience experiences. Modern stagecraft, live streaming integration, and partnerships with film producers further enhance theatre’s market impact, making it a cornerstone of the U.S. Performing Art Companies Market.
The dance segment is growing at the highest CAGR of 8.55% in the forecasted period, fueled by rising youth interest, cultural fusion trends, and digital visibility. In 2023, the Alvin Ailey American Dance Theater expanded its touring model and launched virtual masterclasses, increasing access nationwide. Companies are blending classical and contemporary styles while incorporating AR/VR to reach new audiences. This dynamic growth positions dance as a transformative force within the U.S. Performing Art Companies Market.
By Performing Arts Company Type
The medical & healthcare segment leads with a 25% revenue share in 2024 and shows the fastest growth through 2032. This is driven by the integration of art therapies and performance-based rehabilitation in clinical settings. In 2024, Healing Arts NYC partnered with major hospitals to launch “Movement for Recovery” dance programs. These initiatives boost mental and emotional well-being, aligning the performing arts with wellness trends and expanding the market’s reach into the healthcare ecosystem.
By Venue Type
Theatres dominate the venue type segment with a 43% revenue share in 2024, owing to their historical significance, acoustics, and production capabilities. Renovations of major venues like The Orpheum Theatre in Minneapolis (2023) and the expansion of regional playhouses have supported premium experiences. Performing art companies are optimizing theatre use through mixed-format shows, subscription packages, and tech-enhanced performances, reinforcing theatres’ central role in the U.S. Performing Art Companies Market’s revenue and audience growth.
Stadiums are growing at the highest CAGR of 7.56% within the forecasted period due to large-scale productions and crossover events like music-theater hybrids. In April 2024, a major dance opera event held at SoFi Stadium drew 60,000 attendees, showcasing stadium viability for artistic programming. Companies are now developing stadium-friendly set designs and leveraging LED tech to enhance visibility. This evolving venue strategy expands capacity, audience diversity, and geographic outreach within the Performing Art Companies Market.
By Ticket Pricing
The mid-range ticket pricing segment holds a 41.3% revenue share in 2024, supported by broad consumer affordability and value-focused offerings. Organizations like the Kennedy Center and regional ballet companies introduced tiered pricing and loyalty programs in 2023, making live art more accessible. These mid-range strategies attract middle-income households, boosting footfall while maintaining profitability. Their balance between cost and experience makes mid-range pricing a strategic anchor for steady revenue in the U.S. Performing Art Companies Market.
The premium ticket segment is growing at the highest CAGR of 7.63%, driven by demand for exclusive, high-end performance experiences. In May 2024, the Metropolitan Opera introduced luxury box suites with gourmet dining and private lounges, attracting affluent patrons. Companies are offering VIP access, artist meet-and-greets, and bespoke seating. As audiences seek personalized and elite experiences, premium pricing becomes a key growth lever, especially in major cities, reinforcing the upscale trajectory of the Performing Art Companies Market.
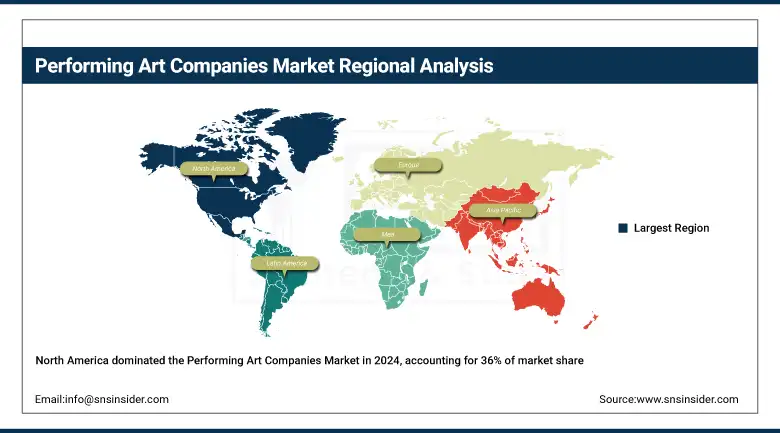
Regional Analysis:
North America holds a dominant 36% share of the Performing Art Companies Market in 2024, driven by strong cultural infrastructure, high consumer spending on live entertainment, and consistent government and private funding of the arts. The U.S. leads the region, supported by a well-established network of performing arts institutions, widespread audience engagement, and major cities like New York and Los Angeles acting as global cultural hubs. The presence of globally recognized venues and touring companies reinforces the U.S.'s leadership in North America’s performing arts ecosystem.
Get Customized Report as per Your Business Requirement - Enquiry Now
Asia Pacific is the fastest-growing region in the Performing Art Companies Market in 2024, with a projected CAGR of 7.89% over 2025–2032. The region benefits from rapid urbanization, increasing investments in cultural infrastructure, and growing middle-class interest in diverse entertainment formats. China dominates this growth due to large-scale government-backed cultural expansion, modernization of traditional art forms, and the development of state-of-the-art performance venues in cities like Shanghai and Beijing. Digital ticketing and hybrid performance platforms are further propelling China’s leadership in the region’s performing arts expansion.
Europe remains a key contributor to the Performing Art Companies Market in 2024, fueled by cross-border cultural programs, high tourism, and well-funded national arts policies. The United Kingdom leads the regional market, backed by iconic institutions like the West End, National Theatre, and the Royal Opera House. With strong support from public grants, a vibrant production scene, and a high concentration of international performances, the UK continues to strengthen its role as a central player in Europe’s performing arts landscape.
The Middle East & Africa and Latin America are emerging markets in the Performing Art Companies Market in 2024, driven by increasing investments in cultural revival and infrastructure development. In the Middle East, the UAE and Saudi Arabia are establishing flagship projects such as the Dubai Opera and Riyadh Season to foster cultural tourism and local talent. In Latin America, Brazil and Mexico are revitalizing national arts programs, upgrading performance venues, and hosting large-scale festivals that are boosting local engagement and international recognition.
Key Players:
The Performing Art Companies Market companies are The Royal Shakespeare Company (RSC), Cirque du Soleil, The Metropolitan Opera, The Bolshoi Theatre, National Theatre (UK), Lincoln Center for the Performing Arts, Sydney Opera House Trust, Shanghai Grand Theatre Performing Arts Group, Opéra National de Paris, Berlin Philharmonic Foundation, American Ballet Theatre (ABT), Mariinsky Theatre, La Scala (Teatro alla Scala), New York City Ballet, Sadler's Wells Theatre, San Francisco Opera, Royal Opera House, Broadway Across America (a part of the John Gore Organization), Nederlander Organization, Stage Entertainment, and others.
Recent Developments:
-
In January 2025, the RSC introduced an inclusive initiative by offering 25,000 tickets priced at £25, aiming to lower barriers and diversify audiences. Co-artistic directors Daniel Evans and Tamara Harvey are leading this drive to revitalize Shakespeare through affordability and global collaboration.
-
In June 2025, Cirque du Soleil partnered with The Sandbox metaverse platform to adapt its signature shows into two new interactive games, expanding its theatrical legacy into immersive digital entertainment and reaching global audiences virtually.
Get in Touch
