Phosphoramidite Market Report Scope & Overview:
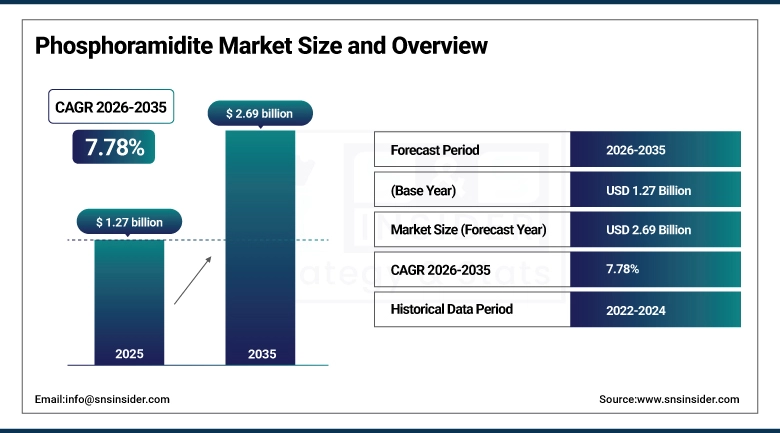
The Phosphoramidite market was valued at USD 1.27 billion in 2025 and is expected to reach USD 2.69 billion by 2035, growing at a CAGR of 7.78% over the forecast period of 2026-2035.
The rising use of oligonucleotide therapeutics, use of gene editing tools such as CRISPR, and advancements in mRNA vaccines are major factors contributing to the growth of the global phosphoramidite market. Some of the major trends in the phosphoramidite market include the popularity of GMP-grade reagents, an increase in the demand for custom-modified phosphoramidites, and investments in synthetic biology. The demand for diagnostic applications in the pharma, biotech, and academic sectors is rising due to research funding.
For instance, in March 2025, over 15 oligonucleotide drugs are in late-stage trials, with 6 approvals expected in 2025, significantly boosting demand for GMP-grade phosphoramidites globally.
For instance, in May 2025, the U.S. holds 52% of global oligonucleotide API capacity, driven by USD 2.1B investments in GMP-grade phosphoramidite manufacturing by major players including TriLink and IDT.
Phosphoramidite Market Size and Forecast:
-
Market Size in 2025: USD 1.27 Billion
-
Market Size by 2035: USD 2.69 Billion
-
CAGR: 7.78% from 2026 to 2035
-
Base Year: 2025
-
Forecast Period: 2026–2035
-
Historical Data: 2022–2025
To Get more information on Phosphoramidite Market - Request Free Sample Report
Key Phosphoramidite Market Trends
-
Rising integration of advanced fluorescence and labeling chemistries accelerates oligonucleotide synthesis efficiency, enhancing research and diagnostic applications.
-
Development of eco-friendly, stable phosphoramidite reagents meets increasing demand for sustainable, high-purity nucleic acid building blocks.
-
Expansion of automated synthesis platforms improves throughput, reduces human error, and ensures reproducibility in oligo production.
-
Adoption of predictive analytics in probe design allows targeted, high-specificity nucleic acid sequences for diagnostics and therapeutics.
-
Growing utilization of temperature- and chemical-resistant phosphoramidites facilitates complex applications across qPCR, RNA detection, and molecular biology workflows.
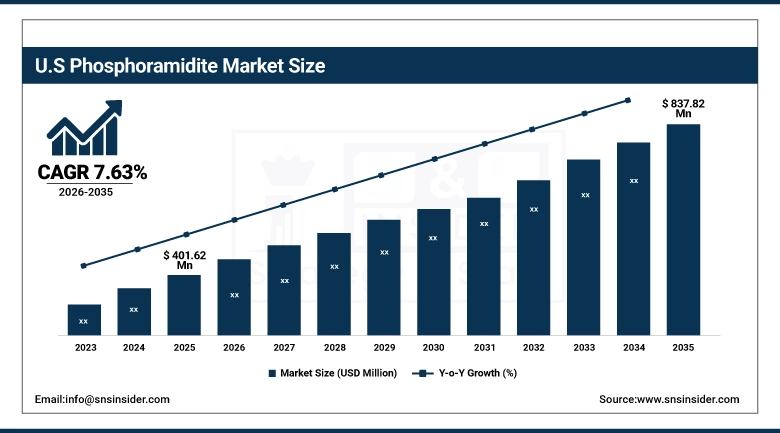
U.S. Phosphoramidite Market Insights
The U.S. phosphoramidite market was valued at USD 401.62 million in 2025 and is expected to reach USD 837.82 million by 2035, growing at a CAGR of 7.63% over 2026-2035. The U.S. is a dominant region in the phosphoramidite market due to its strong pharmaceutical R&D base, presence of major market players including Thermo Fisher and IDT, along with high demand for oligonucleotide therapeutics. Supportive FDA policies and mRNA, CRISPR, and Synthetic Biology investments accelerate the market upwards. The U.S. Phosphoramidite Market Analysis highlights innovation and production capacity at the forefront of global trade.
Phosphoramidite Market Growth Drivers:
-
Increased Funding for Genomics Research is Driving the Phosphoramidite Market Growth
The increasing expenditure on genomics research is fueling the growth of the phosphoramidite market to a significant extent, with an increase in grants from the government, as well as investments from institutions and private players, worldwide. The demand for high-purity phosphoramidite for DNA/RNA synthesis is thus fueled by this expenditure.
For instance, in January 2025, NHGRI allocated USD 250M (+22%) for genome sequencing, and Sept 2024, the EU invested USD 150M (+19%) in oligonucleotide synthesis, boosting phosphoramidite demand.
Phosphoramidite Market Restraints:
-
Supply Chain Vulnerabilities are Hampering the Phosphoramidite Market Growth
One of the primary restraints in the phosphoramidite market is supply chain vulnerability owing to the access to special raw materials, including protected nucleosides and sensitive reagents. This could drive a slower approach to manufacturing and lead to delays and inflated costs due to geopolitical instability, export restrictions, or logistical disruptions. Given the fact that each of these problems leads to inconsistent supply and poor scalability, it has a direct bearing on production timelines and hence limits both the phosphoramidite market share in emerging and resource-limited regions.
For instance, in May 2025, 37% of oligo manufacturers faced phosphoramidite delays due to raw material shortages, causing a 5%–7% dip in market share across emerging regions.
Phosphoramidite Market Segment Analysis
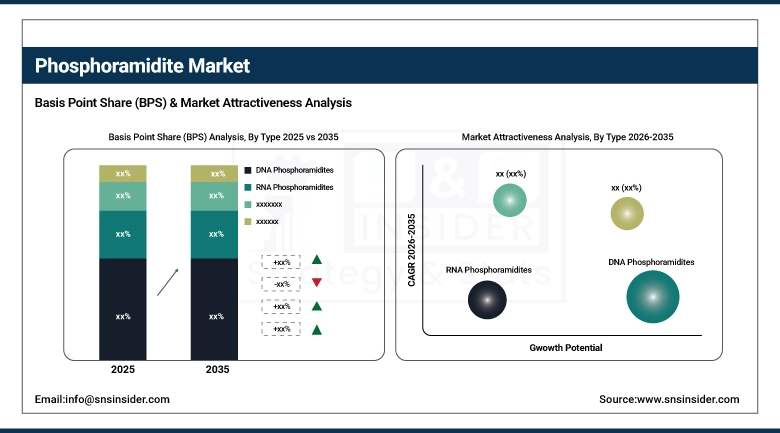
By Type
DNA phosphoramidites are the dominant segment in the global phosphoramidite market, with a 36.94% share in 2024, owing to their promiscuous use in diagnostic oligonucleotide synthesis, PCR primers, gene editing, and therapeutic development. The rise in demand for DNA-based applications, including synthetic biology and CRISPR technologies, is one of the primary driving factors. They are also the preferred methodological choice across research, biotech, and pharmaceutical domains globally, owing to their versatility and value for money.
The RNA phosphoramidites segment is emerging as the fastest growing with a CAGR of 8.64% in the global phosphoramidite market, fueled by the fast uptake of mRNA vaccines, siRNA therapeutics, and RNA-based diagnostics. Post-COVID-19, demand for modified RNA molecules is high in drug delivery and gene silencing. In addition, the increased use of high-purity and stable RNA phosphoramidites to produce RNA therapeutics and advanced synthesis platforms has further fueled this expansion.
By Purity
Standard research grade held a dominant phosphoramidite market share of 35.94% in 2024, due to its popularity in academic, institutional, and early-stage biotech research. The principal reason for that is due to its lower price and purity, which is good enough for non-clinical applications, including PCR, sequencing, and gene synthesis, among others. The largest demand here is for universities and R&D labs to consume a lot, leading to the tip, muscle segment taking the lead in the market.
GMP-Grade is emerging as the fastest-growing segment in the global phosphoramidite market, registering a CAGR of 8.51% over the forecast period, driven by the growth of oligonucleotide-based therapeutics, including siRNA, ASOs, and mRNA drugs. The demand for regulatory-compliant and high-purity reagents has mushroomed as pharma and biotech companies grow their clinical pipelines. Rigorous guidelines over the FDA/EMA and capacity increase of the CDMO to be conducted during this segment's fast growth stage also act as a further catalyst.
By Application
In 2025, the drug discovery & development dominated the phosphoramidite industry, due to its foundational role in synthesizing therapeutic oligonucleotides, aptamers, and antisense drugs. The driving factor is the growing demand for precision medicine and targeted therapies, where synthetic DNA sequences are essential for preclinical screening, gene modulation, and high-throughput drug discovery platforms across pharma and biotech industries.
Diagnostics Development is emerging as the fastest-growing segment in the phosphoramidite market, registering a CAGR of 8.30 % over the forecast period, driven by the increasing requisition of molecular tests including qPCR, NGS, and probe assays. Phosphoramidite-based oligo synthesis is used extensively for the detection of infectious diseases, cancer biomarkers, and genetic disorders owing to the demand for fast and accurate detection. Among a rapidly growing segment of the market, increasing investment in personalized diagnostics and decentralized testing is driving growth.
By End-user
Pharmaceutical & biotechnology companies are the largest segment of the phosphoramidite industry, as a pioneer in oligonucleotide-based drugs, mRNA vaccines, and gene therapies. The main catalyst is the increase in clinical pipelines involving siRNA, ASOs, and CRISPR technologies. This has made second-generation companies the largest and most reliable end-users of ultra-pure, GMP-grade Phosphoramidites, which provide services that scale as they transition over discovery to development.
The academic & research institutes segment is witnessing the highest growth in the global phosphoramidite market, driven by rising genomics, synthetic biology, and molecular diagnostics government and private funding. The rising demand for custom DNA/RNA oligonucleotides to support their in-house research and innovation is the chief driver of the market. The need for economic, research-grade phosphoramidites is expanding as universities drive progress in gene editing and diagnostics.
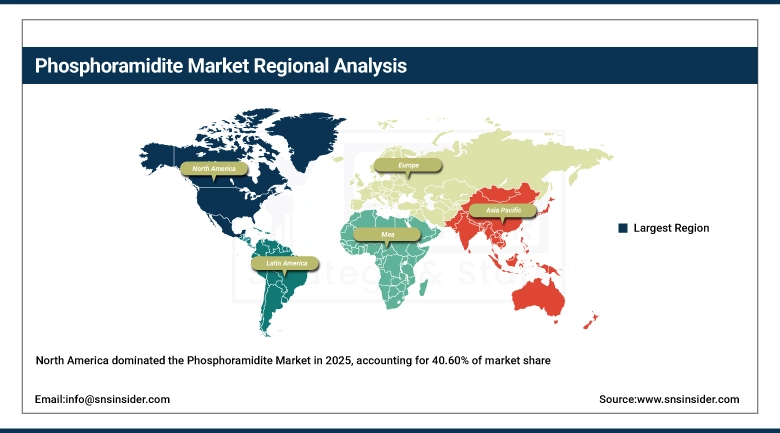
Phosphoramidite Market Regional Analysis
North America Phosphoramidite Market Insights
In 2025, the North American region holds a dominant market share of 40.60% of the global phosphoramidite market, driven by its mature infrastructure for biotechnology, extensive R&D spending, and the existence of major players including Thermo Fisher, TriLink, and IDT. Additionally, the area is where oligonucleotide drug development, CRISPR work, and mRNA-based therapeutics are all at their highest level. Strong clinical pipeline and supportive regulations, particularly in the U.S., spur sales of GMP-grade and custom phosphoramidites in pharmaceutical, diagnostic, and academic entities, and with this, North America sits on top.
Get Customized Report as per Your Business Requirement - Enquiry Now
Europe Phosphoramidite Market Insights
Europe is the second largest phosphoramidite market due to a good pharmaceutical and biotechnological infrastructure, with some of the major CDMOs, including Eurogentec, LGC, present in this region, while oligonucleotide-based drug development in the coming years will further boost the growth. By its consistently high research output, strong academic collaboration, and continued including EU-funded projects in the form of Horizon Europe, making innovation a way of life at CNRS.
Asia-Pacific Phosphoramidite Market Insights
Asia Pacific emerges as the fastest-growing region with the highest CAGR of 8.47%, owing to the technological advancements in biotech, government funding, and pharma manufacturing capacity are on the up. There is heavy investment around the world in genomics, synthetic biology, and oligonucleotide drug development over countries including China, India, South Korea, and Japan. Increasing academic research, growth in CRISPR adoption, and the number of clinical trials for RNA therapeutics and diagnostics are resulting in the region experiencing high demand for both research-grade and GMP-grade phosphoramidites. This is largely driven by the region’s low-cost manufacturing capabilities, increasing number of local CDMOs, and expanding partnerships with Western biotech companies. Moreover, the growth in healthcare infrastructure and rising emphasis on personalized medicine are driving the adoption of phosphoramidite-based technologies in academic, clinical, and industrial applications in the Asia Pacific.
Middle East & Africa Phosphoramidite Market Insights
The phosphoramidite market in the Middle East and Africa is anticipated to have minimal growth as a result of weak biotechnology infrastructure, low investment for advanced genetic research, and a smaller number of pharmaceutical manufacturing facilities. These include insufficient or no access to high-purity reagents, lack of trained personnel, and limited history in clinical development with oligonucleotide therapeutics. Moreover, the heavy reliance on imports and the slow uptake of synthetic biology impedes its high market penetration.
Latin America Phosphoramidite Market Insights
With advanced research facilities, better healthcare infrastructure, and adoption of molecular diagnostics and medical genetics technologies being more commonplace in clinical settings, Latin America is a relatively small but growing market to be present in the global phosphoramidite market. Countries including Brazil, Mexico, and Argentina are strongly betting on biotechnology and academic research. But slow local manufacturing, regulatory challenges, and dependence on imports have continued to clog expansion. However, increasing penetration of personalized medicine and public health genomics in most parts globally bodes well for market growth in the years to come.
Competitive Landscape for the Phosphoramidite Market:
LGC Biosearch Technologies was founded in 1993 and is headquartered in Petaluma, California, LGC Biosearch Technologies is a biotechnology company specializing in nucleic acid production, PCR systems, and other molecular biology lab kits and services. It is a subsidiary of LGC Ltd and serves customers across various markets, including pharmaceuticals, agricultural biotechnology, diagnostics, food safety, environment, government, and academia.
-
In May 2025, LGC expanded its fluorescent phosphoramidite product line, offering improved thermal and chemical stability for use in qPCR probes and RNA detection, enhancing diagnostic assay performance and oligo labeling efficiency.Top of Form
Integrated DNA Technologies (IDT) was established in 1987 and is headquartered in Coralville, Iowa. IDT is a supplier of custom nucleic acids, serving the areas of academic research, biotechnology, clinical diagnostics, and pharmaceutical development. The company specializes in the manufacturing of custom DNA and RNA oligonucleotides for research applications.
-
In March 2025, IDT launched a new suite of RNA phosphoramidites specifically designed for CRISPR and mRNA synthesis, enabling higher fidelity, stability, and efficiency in therapeutic and genome editing applications.
Phosphoramidite Companies are:
-
LGC Biosearch Technologies
-
Glen Research
-
ChemGenes Corporation
-
Sino Biological Inc.
-
TriLink BioTechnologies
-
Dharmacon
-
Carbosynth
-
GenePharma
-
Bioneer Corporation
-
Biotez Berlin-Buch GmbH
-
Nitto Avecia
-
ATDBio
-
Eurogentec
-
Bio-Synthesis Inc.
-
Synthego Corporation
-
Integrated DNA Technologies
-
Kaneka Eurogentec
-
Aurora Fine Chemicals
|
Report Attributes |
Details |
|---|---|
|
Market Size in 2025 |
USD 1.27 billion |
|
Market Size by 2035 |
USD 2.69 billion |
|
CAGR |
CAGR of 7.78% From 2026 to 2035 |
|
Base Year |
2025 |
|
Forecast Period |
2026-2035 |
|
Historical Data |
2022-2024 |
|
Report Scope & Coverage |
Market Size, Segments Analysis, Competitive Landscape, Regional Analysis, DROC & SWOT Analysis, Forecast Outlook |
|
Key Segments |
• By Type (DNA Phosphoramidites, RNA Phosphoramidites, Labeled Phosphoramidites, Modifier Phosphoramidites, Others) |
|
Regional Analysis/Coverage |
North America (US, Canada), Europe (Germany, France, UK, Italy, Spain, Poland, Russsia, Rest of Europe), Asia Pacific (China, India, Japan, South Korea, Australia,ASEAN Countries, Rest of Asia Pacific), Middle East & Africa (UAE, Saudi Arabia, Qatar, Egypt, South Africa, Rest of Middle East & Africa), Latin America (Brazil, Argentina, Mexico, Colombia Rest of Latin America) |
|
Company Profiles |
Merck KGaA, Thermo Fisher Scientific, LGC Biosearch Technologies, Glen Research, ChemGenes Corporation, Sino Biological Inc., TriLink BioTechnologies, Dharmacon, Carbosynth, GenePharma, Bioneer Corporation, Biotez Berlin-Buch GmbH, Nitto Avecia, ATDBio, Eurogentec, Bio-Synthesis Inc., Synthego Corporation, Integrated DNA Technologies, Kaneka Eurogentec, Aurora Fine Chemicals, and other players. |
Frequently Asked Questions
Ans: LGC Biosearch Technologies, Glen Research, ChemGenes Corporation, Sino Biological Inc., TriLink BioTechnologies, Dharmacon, Carbosynth, GenePharma, and Bioneer Corporation are the major players in the Phosphoramidite Market.
Ans: Supply Chain Vulnerabilities are Hampering the Phosphoramidite Market Growth.
Ans. The CAGR of the Phosphoramidite Market is 7.78% during the forecast period of 2026-2035.
Ans: The North American region dominated the Phosphoramidite Market in 2025.
Ans. The current size of the Phosphoramidite Market is USD 1.27 billion globally.
Get in Touch
