Wearable Payment Device Market Size:
Get more information on the Wearable Payment Device Market - Request Sample Report
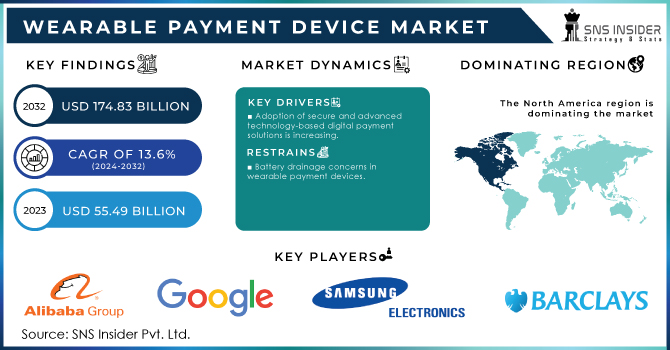
The Wearable Payment Device Market Size was valued at USD 55.49 billion in 2023. It is expected to reach USD 174.83 billion by 2032 and grow at a CAGR of 13.6% over the forecast period 2024-2032.
Wearable technology encompasses items that can be seamlessly integrated into clothing or worn as accessories on the body, utilizing electronic components and software for control. When wearable devices with wireless capabilities like NFC and RFID are employed for transactions, it's termed as utilizing wearable payment devices. Ongoing technological progress enables swift and discreet integration of payment functionalities into wearables, enhancing user convenience. Many banks and financial institutions currently provide wearable payment solutions to offer clients a straightforward and seamless payment experience.
Wearable Payment Device Market Dynamics:
KEY DRIVERS:
-
Wearable technology providers are increasingly focusing on providing enhanced customer services through mobile applications.
-
Adoption of secure and advanced technology-based digital payment solutions is increasing.
-
Rising demand for wearable electronic devices will drive the growth of wearable payment devices.
The increasing embrace of secure and advanced technology-based digital payment solutions mirrors a complex interplay of factors shaping contemporary financial transactions. Escalating concerns about security, triggered by the proliferation of cybercrime and data breaches, have motivated consumers to seek more reliable payment methods, prompting the integration of technologies like tokenization, encryption, and biometric authentication into digital payment platforms. Concurrently, the unparalleled convenience and efficiency intrinsic to digital payments, facilitated by technologies such as NFC, blockchain, and artificial intelligence, have spurred their adoption, particularly among technologically savvy consumers. Moreover, the expansion of e-commerce and globalization has bolstered the demand for secure and user-friendly payment solutions to streamline online purchases and cross-border transactions. Additionally, regulatory backing and initiatives aimed at fostering financial inclusion, combating money laundering, and enhancing transaction transparency have significantly influenced the widespread acceptance of digital payment technologies. This collective shift toward prioritizing digital-first payment methods underscores a broader societal transition toward a digital economy, driven by imperatives for security, convenience, efficiency, and regulatory adherence in financial transactions.
RESTRAINTS:
- Battery drainage concerns in wearable payment devices
Ensuring the smooth operation of the device requires regular recharging; if it runs out of power, it automatically disconnects the user, potentially resulting in data inadequacy or missing data clusters, consequently affecting the payment process. With advancements in technology and design, wearable payment devices are becoming smaller, necessitating smaller batteries to power payment functions. Additionally, when a wearable device operates on advanced operating systems, it demands significant battery backup for continuous performance. However, direct connectivity to cellular networks can rapidly deplete the battery of wearable devices, negatively impacting battery life.
OPPORTUNITIES:
- The growing acceptance of cutting-edge technologies like NFC, RFID, and host card emulation within wearable payment devices
NFC, RFID, and host card emulation (HCE) technologies are essential components of various wearable and contactless payment devices. Numerous wearable device manufacturers, including Apple, Samsung, and Huawei, are incorporating NFC and RFID technologies into their wearable devices and payment platforms, presenting promising prospects for the expansion of the wearable payment device market.
Likewise, industry participants are embracing host card emulation technologies to enable customers to conveniently access product information via their smart devices, thus enhancing their shopping experience.
CHALLENGES:
- Security issues about wearable payment devices
Wearable devices interact with various elements within the broader ecosystem, including internet services, embedded chips, mobile apps, computing applications, and more. Wearable payment devices have become prevalent in diverse settings such as grocery stores, restaurants, hospitals/pharmacies, and entertainment centers due to their convenience, rapid transaction speeds, and capability to capture and analyze complex data in real time. However, organizations utilizing wearable payment devices are exposed to the risk of data breaches. The interconnectedness of devices and reliance on cellular networks render them susceptible to attacks. Nevertheless, wearable payment device companies can swiftly address these security challenges by promptly updating their software and devices.
IMPACT OF COVID-19:
The COVID-19 pandemic had little effect on the market. The rise in health concerns following COVID-19 has boosted demand for wearable devices. The current pandemic has brought to light the importance and utility of wearable devices. Wearable devices are increasingly being used by users to measure, monitor, and continuously assess their personal health. The pandemic has also increased public awareness of the benefits of contactless payment. Due to the risk of contamination, it has accelerated the shift from cash to digital options via smartphones and wearable payment devices. Contactless payments have emerged as an essential solution for all businesses, allowing them to drive their operations forward while also ensuring safety in the face of the coronavirus pandemic.
IMPACT OF RUSSIAN UKRAINE WAR
The Russia-Ukraine crisis has had a far-reaching impact on the global economy, affecting sectors like finance, supply chains, and energy. While its influence indirectly extends to markets such as wearable payment devices, there's no directly analyzed impact noted in available sources. The crisis has instigated political and economic disturbances globally, affecting businesses, supply chains, and legal frameworks due to evolving sanctions. Heightened trade credit risks have emerged, potentially leading to payment delays, especially for contracts involving Russia and Ukraine. Additionally, Europe's reliance on Russian gas has come under scrutiny, prompting shifts in energy strategies that could indirectly affect sectors like technology and manufacturing, including wearable device makers. This could influence production costs and supply chain decisions. The crisis has also disrupted the global supply chain, emphasizing the need for resilience and dual sourcing, potentially impacting the manufacturing and distribution of wearable payment devices. Furthermore, it has accelerated trends in global technology standards and policies, potentially affecting costs and productivity growth, indirectly impacting the wearable payment device market. In summary, while direct impacts on the wearable payment device market are not apparent, broader economic and supply chain disruptions, along with energy strategy shifts and technology standards, could indirectly influence the sector. Companies in this field, like those in other industries, may need to adapt their strategies to navigate these challenges effectively.
IMPACT OF ECONOMIC SLOWDOWN
The impact of the global economic slowdown on the wearable payment device market is nuanced, as certain factors are driving market growth despite economic challenges. The market is witnessing growth due to increased digitization and cashless transactions, propelled by the transition towards a cashless economy and higher internet penetration. Furthermore, the integration of advanced technologies like Virtual Reality (VR), Artificial Intelligence (AI), and NFC and RFID in wearable devices is enhancing their appeal to consumers. Additionally, consumer lifestyle trends, such as the rising popularity of fitness trackers with payment functionalities and the convenience of smartwatches for payments, are contributing to market expansion. However, challenges such as high costs and security concerns, along with technological limitations like short battery life, could hinder growth. While Europe currently leads the market, driven by consumer awareness and adoption, the Asia Pacific region shows promise for rapid growth. Despite potential challenges, the outlook for the wearable payment device market remains positive, driven by the ongoing shift towards digital payments, consumer preferences for wearable technologies, and continuous technological advancements.
Wearable Payment Device Market Segment Overview:
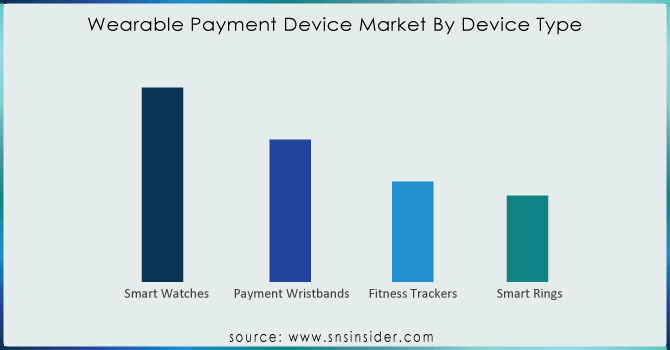
BY DEVICE TYPE
Market segmentation, categorized by Type, Smartwatches, Fitness Trackers, and Payment Wristbands, Smart Rings. In 2023, the Smartwatches segment dominates, significantly contributing to the revenue of Wearable Payment Devices. Today's smartwatches are equipped with touchscreens and various application interfaces, facilitating payments via NFC or Wi-Fi directly from the device, eliminating the necessity for smartphones or physical debit/credit cards. Additionally, users can authorize payments on smartwatches by entering a PIN or passcode linked to their mobile phones.
Get Customized Report as per your Business Requirement - Request For Customized Report
BY TECHNOLOGY
Categorized by Technology, the market segmentation comprises Barcodes, Contactless Point of Sale (POS) Terminals, Near Field Communication (NFC), Quick Response (QR) Codes, Contactless Point of Sale (POS) Terminals and Radio Frequency Identification (RFID). The Radio Frequency Identification (RFID) segment emerged as the market leader. RFID operates through radio wave communication between a small chip embedded in the wearable device and a payment terminal. This technology is prevalent in various wearables, including smartwatches, fitness trackers, and even jewelry. According to Berg Insight AB, nearly eight out of ten POS terminals installed by retailers or vendors worldwide will be able to accept NFC-enabled contactless payments.
BY APPLICATION
Wearable Payment Device Market Regional Analysis:
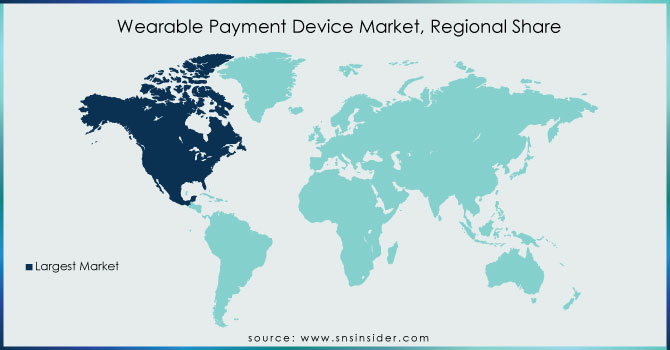
North America held the market dominance, driven by trends such as the growing reliance on technology for timing and tracking, along with the increasing adoption of wearable devices among fitness enthusiasts, which are projected to further propel regional market growth during the forecast period. Additionally, North America is experiencing a significant uptick in the production of smart devices featuring tracking and payment functionalities.
Meanwhile, Asia Pacific is poised to emerge as the swiftest-growing regional market in the forecast period. This growth is attributed to the region's large population and escalating demand for digital devices. Factors such as the gradual development towards a cashless economy and advancements in payment technology are anticipated to bolster market expansion. Furthermore, the increasing influx of new market players is a notable trend observed in the region.
KEY PLAYERS:
The key players in the wearable payment device market are Alibaba Group, Google Inc., Samsung Electronics, Apple Inc., Fitbit Inc., Barclays Plc., Mastercard, Jawbone, PayPal Inc, Visa & Other Players.
In January 2021: Google LLC completed the acquisition of Fitbit Inc. for USD 2.1 billion in an all-cash transaction, marking its entry into the wearable payment device market. This strategic move aims to strengthen the internet giant's hardware division, although it also intensifies antitrust scrutiny.
| Report Attributes | Details |
|---|---|
| Market Size in 2023 | US$ 55.49 Billion |
| Market Size by 2032 | US$ 174.83 Billion |
| CAGR | CAGR of 13.6% From 2024 to 2032 |
| Base Year | 2023 |
| Forecast Period | 2024-2032 |
| Historical Data | 2020-2022 |
| Report Scope & Coverage | Market Size, Segments Analysis, Competitive Landscape, Regional Analysis, DROC & SWOT Analysis, Forecast Outlook |
| Key Segments | • By Device Type (Smart Watches, Payment Wristbands, Fitness Trackers, Smart Rings) • By Technology (Near Field Communication Technology (NFC), Quick Response (QR) Codes, Barcodes, Radio Frequency Identification (RFID), Contactless Point Of Sale (POS) Terminals) • By Sales Channel (Direct Sales, Indirect Sales) • By Application (Retail/Grocery Stores, Hospitals, Restaurants, Entertainment Centers, Others) |
| Regional Analysis/Coverage | North America (US, Canada, Mexico), Europe (Eastern Europe [Poland, Romania, Hungary, Turkey, Rest of Eastern Europe] Western Europe] Germany, France, UK, Italy, Spain, Netherlands, Switzerland, Austria, Rest of Western Europe]), Asia Pacific (China, India, Japan, South Korea, Vietnam, Singapore, Australia, Rest of Asia Pacific), Middle East & Africa (Middle East [UAE, Egypt, Saudi Arabia, Qatar, Rest of Middle East], Africa [Nigeria, South Africa, Rest of Africa], Latin America (Brazil, Argentina, Colombia, Rest of Latin America) |
| Company Profiles | The key players in the wearable payment device market are Alibaba Group, Google Inc., Samsung Electronics, Apple Inc., Fitbit Inc., Barclays Plc., Mastercard, Jawbone, PayPal Inc. and Visa. |
| Key Drivers | • Wearable technology providers are increasingly focusing on providing enhanced customer services through mobile applications. • Adoption of secure and advanced technology-based digital payment solutions is increasing. • Rising demand for wearable electronic devices will drive the growth of wearable payment devices. |
| Restraints | • Battery drainage concerns in wearable payment devices |
Frequently Asked Questions
The North America region with the Highest Revenue share in 2023.
The Smart Watches segment is leading in the market revenue share in 2023.
The Asia Pacific region is anticipated to record the Fastest Growing in the Wearable Payment Device Market.
The expected CAGR of the global Wearable Payment Device Market during the forecast period is 13.6%.
The Wearable Payment Device Market was valued at USD 55.49 billion in 2023.
Get in Touch
