Plastic Pigments Market Analysis & Overview:
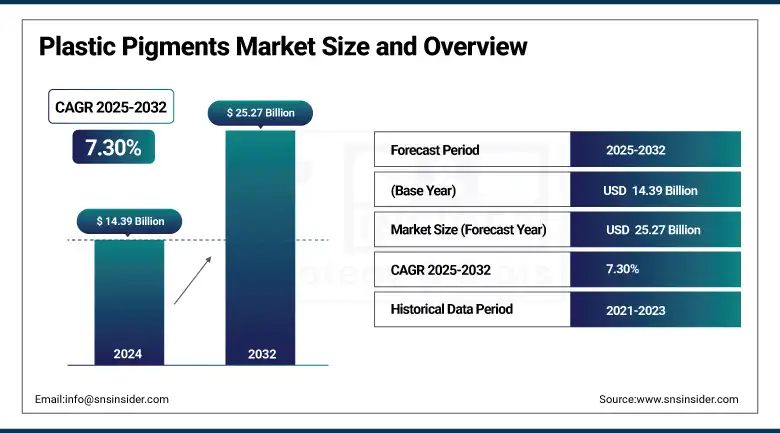
The Plastic Pigments Market size was valued at USD 14.39 billion in 2024 and is expected to reach USD 25.27 billion by 2032, growing at a CAGR of 7.30% over the forecast period of 2025-2032.
The plastics pigments market is changing dynamically on account of growing preference for sustainable plastic pigments in the packaging, automotive & consumer goods industries. Increasing environmental regulations are expected to propel the demand for eco-friendly and flame-retardant pigments in the plastic pigments market. Fluorescent pigments for plastics are in demand because of their inclusion in decorative packaging and safety devices. Major plastic pigments providers are investing in new bio-based solutions to gain a greater share of the plastic pigments market.
To Get more information On Plastic Pigments Market - Request Free Sample Report
The U.S. Environmental Protection Agency and the American Chemistry Council say safer chemical pigments offer improved regulatory compliance. Heubach GmbH, a leader in specialty pigments, has expanded its pigment preparations for the plastics industry by introducing a range of pigment preparations with flame retardant properties, in response to a dynamic market environment. The booming use of automotive lightweighting and vibrant consumer goods will be driving the plastic pigments industry share. According to these new findings, the market will register a steady growth in growth rate, leading through 2022 and beyond, driven by the growing need for transformative and sustainable solutions.
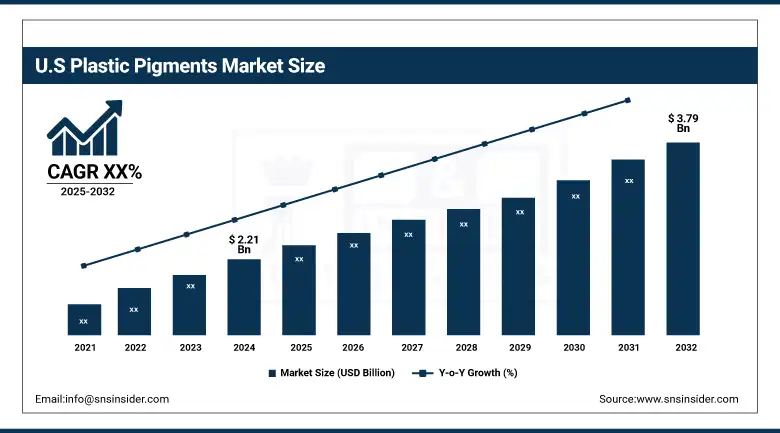
The US is the dominant regional market with a market size valued at USD 2.21 billion in 2024 and is projected to reach a value of USD 3.79 billion in 2032 with a market share of 71%. The growth is driven by its stringent safety standards and FDA direction for safe plastic colorants, and steady growth is reported by Canada and Mexico, based on eco‑innovation and expanding manufacturing capacity.
Plastic Pigments Market Drivers:
-
Surging adoption of bio-based plastic colorants fuels sustainable innovation
Growing preference for eco-friendly and biodegradable plastic colorants is augmenting the growth of the plastic pigments market. Key plastic pigments manufacturers are focusing on the manufacturing of eco-friendly substitutes, which comply with environmental regulations. Bio-based chemical registrations have increased, indicating government backing for greener alternatives, the U.S. Environmental Protection Agency says. These trends are changing the dynamics of the plastic pigments industry, including marketplace growth, market share, and market size, as challenges to produce toxic-free products lead to the downstream, sustainability becomes another trend in the plastic pigments report.
-
Increased use of flame-retardant pigments driven by stricter safety regulations
Flame retarded pigments have increasingly become in demand, over the recent years, due to stringent safety norms in construction, automotive, and electronics. Stricter fire-safety material specifications from the National Fire Protection Association have also driven wider use. Plastic pigments manufacturers such as, for example, Heubach GmbH, have broadened their spectrum of colours accordingly. Therefore, flame-retardant pigments are driving the growth of the plastic pigments market and are also penetrating the high-hazard areas, which is a prominent trend being observed in the plastic pigments market analysis report at present.
Plastic Pigments Market Restraints:
-
Technical challenges in maintaining pigment performance during polymer processing
Consideration of bio-based and fluorescent pigments is limited due to their thermal degradation at high polymer processing temperatures. According to the National Institute of Standards and Technology, there are limitations regarding color stability and flame retardancy above 250 °C; these limitations disqualify the use of advanced pigments in automotive and industrial applications. Therefore, the market size of plastic pigments and their share, especially the high-performance pigments, are relatively small. Ongoing R&D work is conducted to minimize these problems, due to which thermal stability is a key concern in the plastic pigments industry analysis and growth strategy.
Plastic Pigments Market Segmentation Analysis:
By Type
Inorganic pigments dominated the plastic pigments market in 2024 with a 63.6% share, as inorganic pigments offer excellent thermal stability, resistance to UV radiation, and cost-effectiveness in mass production. The materials are used in many PVC and polyolefin plastics for construction and packaging purposes. Long-life pigment solutions inhibit microplastic degradation, aiding legal compliance, says the U.S. Environmental Protection Agency. Use of titanium dioxide, which is the predominant inorganic subsegment, is indispensable in high-opacity applications, and it is propelling plastic pigments market share, thereby consolidating its position in plastic pigments market trends.
Organic pigments were the fastest-growing segment by 2032 with a CAGR of 7.6%, due to increasing demand for bright, sustainable plastic colorants for consumer goods and packaging. Compelled by U.S. EPA’s advocacy for low-toxicity replacements and circular use of materials, they are adopting phthalocyanine and azo-based pigments. Fluorescent Plastics: Fluorescent pigments for plastics, an important organic subsegment, are in vogue for high-end branding applications. These developments are in line with overall trends in the plastic pigments market toward sustainable products and niche colorants.
By Application
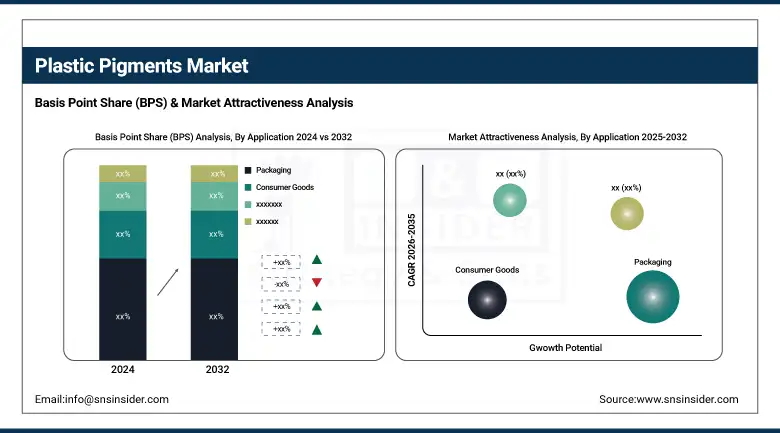
Packaging applications dominated the plastic pigments market in 2024 with a 38.7% share, due to increasing requirements for colorful, recyclable plastic packaging in food, personal care, and industrial goods. FDA guidance and ACC reports favoring safe packaging materials are prompting brand owners to make use of fluorescent pigments for plastics for visual distinction. The subsegment packaging is of significant value due to the use of both flame-retardant and UV-stable pigments to fulfill performance and compliance requirements, thereby contributing to the growth of the plastic pigments market and the global market share.
Automotive emerged as the fastest-growing application by 2032, with a CAGR of 8.03%, owing to the rising utilization of plastic components for lightweighting and design adaptability purposes. Plastic usage in vehicles was up 18% in the past 10 years, and that is driving demand for strong, weather-resistant pigments, according to the American Chemistry Council. Interior-wise, it’s even more important for flame-retardant pigments; as for dashboards and controls, fluorescent pigments help visibility. These changing applications are changing the size of the plastic pigments market, and automotive will continue to be a main focus of market activity.
Plastic Pigments Market Regional Outlook:
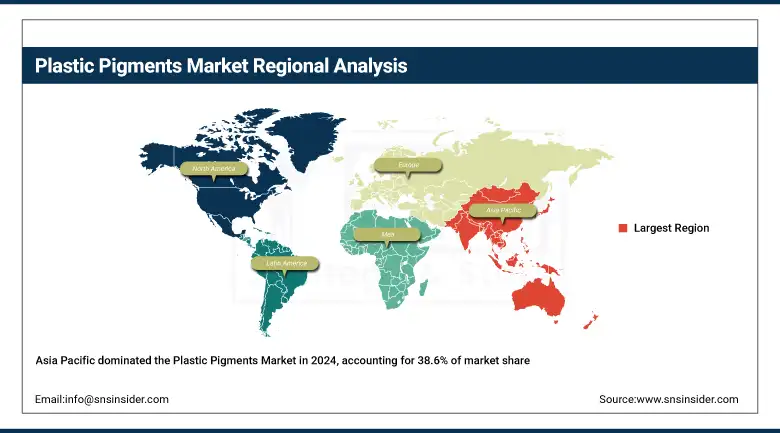
North America, with a 21.4% share, ranks as the second-largest region in the Plastic Pigments Market in 2024, owing to robust regulatory support and advanced pigment manufacturing technology. Adoption of flame-retardant pigments by package and auto makers is surging, leaving such Plastic Pigments Companies to expand production volumes to meet the surging demand for flame‑retardant pigments.
Europe holds the third-largest share at 18.1%, due to the presence of REACH directives and efforts towards pigment sustainability. Trends on the European Plastic Pigments Market. In the EU, significant amounts of fluorescent pigments for plastics are used in premium packaging and safety labeling. Germany Pioneering locally sourced, eco‑friendly, high‑performance colorants that meet EU guidelines. France and Italy are next as they also utilize advanced pigments in both automotive and industrial plastics. ECIC member company data supporting focus on regional compliance and innovation.
Asia Pacific dominates with a 38.6% share in 2024. Rapid industrialization in China and India, combined with polymer‑intensive automotive and packaging expansion, drives the Plastic Pigments Market Size and Growth. Regional Plastic Colorants companies leverage fluorescent pigments for plastics in branding and flame‑retardant pigments for safety compliance. Government support through “Make in India” and China’s circular economy policies accelerates eco‑pigment adoption. The plastics-intensive manufacturing landscape positions Asia Pacific as both dominant and fastest-growing in market share and trends.
Get Customized Report as per Your Business Requirement - Enquiry Now
Latin America is emerging as a developing region on account of an increase in consumer goods manufacturing and packaging business. National sustainability programs for bio‑based plastic colorants were launched in Brazil, where it has a leading position. It's being followed by Mexico, which is gaining from near‑shoring in automotive plastics production and colorant innovation. This increase corresponds to the Global Plastic Pigments Market analysis, which indicates regional growth and regulations.
The Middle East & Africa region emerged as the fastest-growing region with a CAGR of 8.22%, due to developing infrastructure and increased demand for flame‑retardant pigments in construction plastics. Gulf Cooperation Council countries, notably the UAE and Saudi Arabia, are increasingly investing in petrochemical capacity and Professional Plastic Pigments Companies specializing in complex pigment solutions. The trend is reinforced by government-initiated building safety regulations, which consolidate the region’s positioning as a global market growth driver.
Plastic Pigments Market Companies are:
The major plastic pigments market competitors include Heubach GmbH, DIC Corporation, Sun Chemical (a subsidiary of DIC Corporation), Ferro Corporation, Pidilite Industries Limited, Tokan Material Technology Co., Ltd., Meghmani Organics Ltd., Neelikon Food Dyes & Chemicals Ltd., Trust Chem Co., Ltd., and Kolorjet Chemicals Pvt. Ltd.
Recent Developments:
-
In March 2025, Venator launched an automated Product Carbon Footprint tool for its additives and pigments, using Atos' Eviden platform to enhance transparency, support carbon reduction strategies, and help customers measure and lower product emissions effectively.
-
In March 2024, DIC Corporation, via Sun Chemical, presented sustainable pigment technologies at Chinaplas 2024, highlighting eco-friendly color solutions for packaging, automotive, and electronics, reinforcing its commitment to performance and environmental responsibility in plastic pigment innovation.
| Report Attributes | Details |
|---|---|
| Market Size in 2024 | USD 14.39 billion |
| Market Size by 2032 | USD 25.27 billion |
| CAGR | CAGR of 7.30% From 2025 to 2032 |
| Base Year | 2024 |
| Forecast Period | 2025-2032 |
| Historical Data | 2021-2023 |
| Report Scope & Coverage | Market Size, Segments Analysis, Competitive Landscape, Regional Analysis, DROC & SWOT Analysis, Forecast Outlook |
| Key Segments | •By Type (Organic, Inorganic) •By Application (Packaging, Consumer Goods, Building and Construction, Automotive, Others) |
| Regional Analysis/Coverage | North America (US, Canada, Mexico), Europe (Germany, France, UK, Italy, Spain, Poland, Turkey, Rest of Europe), Asia Pacific (China, India, Japan, South Korea, Singapore, Australia, Rest of Asia Pacific), Middle East & Africa (UAE, Saudi Arabia, Qatar, South Africa, Rest of Middle East & Africa), Latin America (Brazil, Argentina, Rest of Latin America) |
| Company Profiles | Heubach GmbH, DIC Corporation, Sun Chemical (a subsidiary of DIC Corporation), Ferro Corporation, Pidilite Industries Limited, Tokan Material Technology Co., Ltd., Meghmani Organics Ltd., Neelikon Food Dyes & Chemicals Ltd., Trust Chem Co., Ltd., and Kolorjet Chemicals Pvt. Ltd. |
Frequently Asked Questions
The Plastic Pigments Market was valued at USD 14.39 billion in 2024, highlighting expanding global usage in packaging and automotive applications.
Inorganic pigments held a 63.6% Plastic Pigments Market share in 2024 due to their cost-efficiency and superior heat resistance.
The United States dominates North America’s Plastic Pigments Market due to FDA and EPA-compliant colorant usage in key sectors.
Key Plastic Pigments Companies include Heubach GmbH, DIC Corporation, Sun Chemical, and Pidilite Industries, leading innovation and compliance.
Asia Pacific led the Plastic Pigments Market with a 38.6% share, driven by industrial growth and eco-compliant pigment adoption in China and India.
Get in Touch
