Polyalkylene Glycols Market Report Scope & Overview
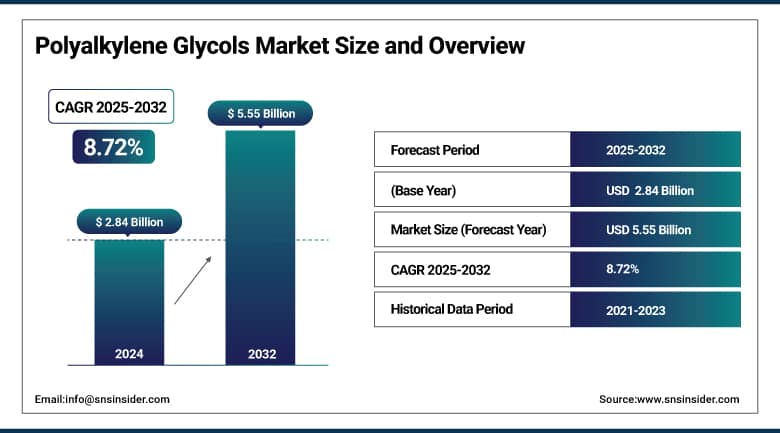
The Polyalkylene Glycols Market size was USD 2.84 billion in 2024 and is expected to reach USD 5.55 billion by 2032, growing at a CAGR of 8.72% over the forecast period of 2025-2032.
Polyalkylene glycols market analysis highlights increasing utilization in the aerospace industry as a key driver of market growth. This is due to the high-performance fluids are often needed for aerospace applications that are resistant to high temperatures, pressures, and extreme operating conditions. Polyglycol-based fluids have high thermal stability, low volatility, and low wear rate (high lubricity) and can be used in aircraft hydraulic systems, turbine lubricants, and other aerospace applications. PAGs hold a non-toxic and biodegradable profile, which goes well with the increasing demand for environmental sustainability and regulatory compliance in the industry. With the expansion in global air travel and defense activities, the demand for reliable & efficient fluid solutions are growing, which in turn drives the need for PAGs in aerospace applications and drives the polyalkylene glycols market growth.
The U.S. Department of Energy (DOE) also announced a USD 3 billion commitment to back two sustainable aviation fuel (SAF) projects. This priority, although fuel-focused, is aligned with federal investments in low-emission aviation infrastructure. Together, these green initiatives drive the use of compatible fluids, such as PAGs, within next-generation airframe systems.
To Get More Information On Polyalkylene Glycols Market - Request Free Sample Report
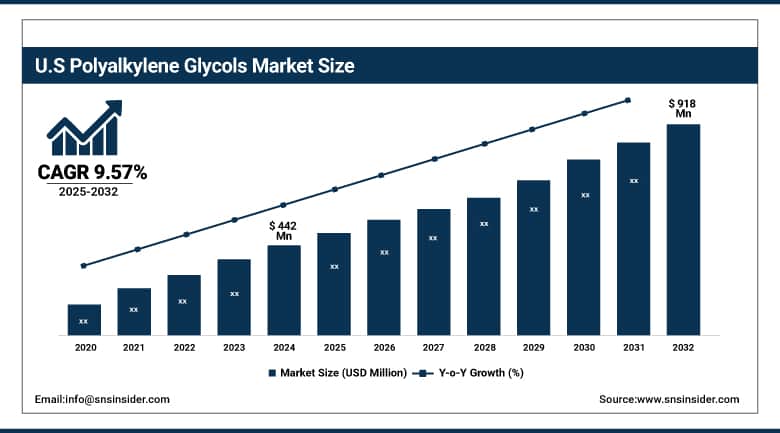
The U.S. Polyalkylene Glycols Market size was USD 442 million in 2024 and is expected to reach USD 918 million by 2032 and grow at a CAGR of 9.57% over the forecast period of 2025-2032. It is owing to a developed industrial base, huge demand for specialty chemicals, and high existing industry presence spanning key application sectors, including automotive, aerospace, pharmaceuticals & personal care. Some of the leading chemical manufacturers and research institutions that are based in the country have also been contributors to the technical performance aspects of innovative high-performance and environmentally friendly markets such as PAGs.
Market Dynamics
Drivers
-
Rising demand for high-performance lubricants drives the market growth.
The Polyalkylene Glycols (PAG) market growth is the increasing requirement for high-performance lubricants. Manufacturers are expected to utilize lubricants that are stable, reduce friction, and extend the life of their machinery and components, especially as industries operate more frequently under high-stress and high-temperature conditions. These requirements are well met by providing an excellent viscosity index, thermal and oxidative stability, and high lubricating properties of PAG. They work very well in tough ambient conditions, like automotive driving conditions, under the hood, in compressors and gear systems, as well as in industrial manufacturing equipment. Moreover, the use of PAG-based lubricants leads to less frequent maintenance and lower energy costs, thus representing an economical and sustainable solution.
The U.S. Department of Energy (DOE) highlights that more than 50% of industrial compressed air systems in commercial facilities have opportunities for energy savings through improved lubrication practices. Better lubricant formulations, such as PAGs, help reduce friction and cut energy costs.
Restrain
-
Complex manufacturing and processing requirements may hamper the market growth.
The difficulty in catering to complex manufacturing and processing requirements is a significant factor hampering the growth of the market for polyalkylene glycols (PAG). High-quality PAGs require sophisticated chemical processing, narrow molecular weight distributions, and high purity, which requires specialized instruments and expertise to achieve. This uses technology that inevitably adds capital and operating expenses to manufacturers and puts increasing barriers to entry for new players. This could create supply shortages, because smaller polyalkylene glycols companies or companies from less developed areas will have difficulties finding the required production standards or money to invest in the necessary infrastructure in order to meet the high standards that some of the major companies will set. Moreover, the ongoing requirement for innovation and quality in processing makes scalability a challenge. Consequently, the high barrier related to production capabilities and technology level may limit the overall growth of the PAG market size.
Opportunities
-
Innovation in electric vehicle (EV) fluids creates an opportunity in the market.
Innovation in EV fluids presents a huge opportunity with EV uptake rapidly increasing worldwide, the need for fluids designed for electric drivetrains is growing. While traditional gas-powered cars have internal combustion engines that can operate under a relatively broad range of ambient temperatures, EVs need advanced thermal management systems to ensure that their battery can continue to operate at maximum efficiency without overheating. PAG-based fluids feature high dielectric strength, high film thickness, high thermal stability, and low vapor pressure, making them the best choice for cooling and lubrication in EV components, including electric motors, batteries, and power electronics. They are non-conductive, allowing for their use in high-voltage applications, and they can be biodegradable, which fits with the sustainability goals of car makers placing EVs on the road and drive the polyalkylene glycols market trends.
In 2024, the U.S. Department of Energy awarded a USD 14 million grant to help fund the production of bio-based ethylene oxide, another key precursor to continue the production of polyethylene glycol (PEG).
Segmentation Analysis
By Type
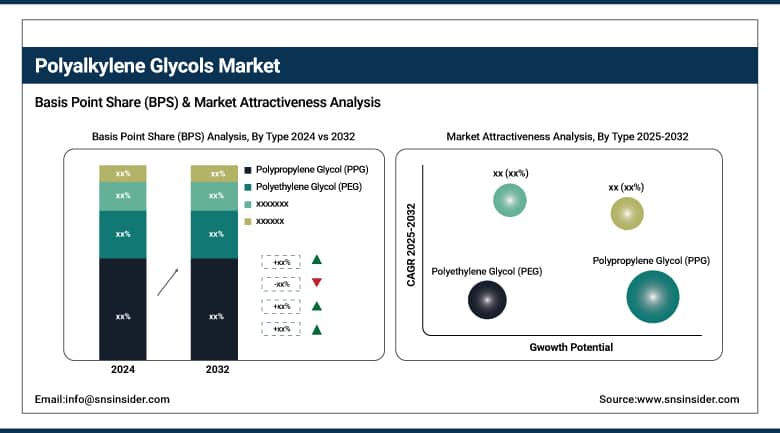
Polypropylene Glycol (PPG) held the largest polyalkylene glycols market share, around 56%, in 2024. It is due to its excellent water solubility, low toxicity, and chemical stability. PPG is used as a base fluid in lubricants, polyalkylene glycol oil de-icing fluids, the manufacture of polyurethane foams, and hydraulic fluids. This versatility makes it ideal for a wide range of applications, including automotive, aerospace, construction, and cosmetic industries. Moreover, PPG is less expensive than other types of PAGs and can be used in various formulations, which makes it a popular option for manufacturers. PPG remains a dominant player in this market due to increasing penetration of polyurethane foams used in construction and insulation, and growth in the use of industrial lubricants in fast-mechanizing economies, and an increase the polyalkylene glycol demand.
Polyethylene Glycol (PEG) held a significant polyalkylene glycol market share. This is due to favorable properties such as good water solubility, non-toxicity, chemical stability, and compatibility with a broad spectrum of active ingredients. PEG has found a wide range of applications in drug formulations, ointments, cosmetics, and lubricants. PEG is commonly incorporated as a solvent, plasticizer, and drug delivery vehicle in the pharmaceutical sector, especially in laxatives and injectable products. Demand from the personal care sector has also been buoyed by its use in skincare products, where it is used as a moisturizer, thickener, and carrier.
By Application
The lubricants segment held the largest market share, around 38%, in 2024. It is due to the rising demand for high-performance, eco-friendly lubricants in various industrial applications across the globe. Due to these unique properties, industrial lubrication solutions, PAG-based lubricants are ideal candidates for severe service environments, such as extreme temperature, high-pressure systems, and/or chemically reactive environments where high thermal stability, oxidation resistance and low volatility, and excellent lubricity are desired. These qualities make them very useful in automotive, aerospace, manufacturing, and power generation.
The surface active agents segment holds a significant market share in the Polyalkylene Glycols market. This is owing to the high demand for the application of PAG as surfactants in various end-use industries, including personal care, cleaning products, and pharmaceutical & industrial processing industries. In this segment, Polyalkylene Glycols are extensively being used owing to their impressive solubility, low toxicity, and non-ionic properties that lead to their high efficacy as emulsifiers, wetting agents, and dispersants. In the applications of personal care, they support emulsification in creams, lotions, and shampoos, along with providing texture and enhancing texture and performance.
Regional Analysis
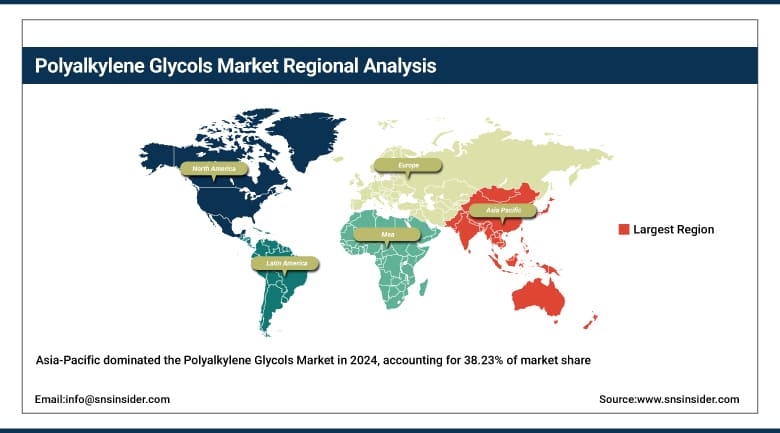
Asia-Pacific held the largest market share, around 38.23%, in 2024. This is due to the high industrial base, fast economic development, and growing end-use industries in the region. PAGs are mainly used in automotive, pharmaceuticals, personal care, and other manufacturing industries, which are booming in countries such as China, India, Japan, and South Korea and are expected to grow over the forecast period. Apart from that, the increased construction and infrastructure activities in the region are driving up the demand for lubricants, surfactants, and polyurethane foams obtained from PAGs. Moreover, low-cost labor, friendly government policies, and rising foreign direct investment (FDI) are attracting global chemical manufacturers to set up production facilities in the region. PAG will see especially high rates of consumption in China, which dominates the chemical and pharmaceutical sectors and is aggressively pursuing renewable energy and electric vehicle production.
In 2024, Singapore secured USD13.5 billion in fixed asset investments, mainly in manufacturing industries including semiconductor and biomedical, key downstream markets for high-purity chemicals
Get Customized Report as Per Your Business Requirement - Enquiry Now
North America polyalkylene glycols market held a significant market share and is the fastest-growing segment in the forecast period. It is owing to the regional strong industrial base, presence of key end-use sectors, and continuous emphasis on sustainability and innovation. The US has been a major contributor; it has a solid automotive, aerospace, pharmaceutical, and personal care industry, all reliant on significant usage of PAG-based products ranging from lubricants and surfactants to pharmaceutical excipients. Moreover, stringent regulations from the U.S. Environmental Protection Agency (EPA) are a major factor that is promoting the demand for synthetic and biodegradable lubricants in the region. The market, comprising specialty chemicals such as PAGs, has been further boosted by continuous R&D undertakings and a high rate of adoption of advanced technologies.
According to the EPA, PAGs meet the biodegradability thresholds (e.g., ≥ 60% conversion in OECD/ASTM tests), exhibit minimal aquatic toxicity, and show no tendency to bioaccumulate, earning them category status as environmentally acceptable lubricants.
Europe held a significant market share in the forecast period. This is owing to the strong and improved regulatory framework across the region coupled with extensive environmental awareness among the population and industrial sectors in the region. To be more specific, the rigid environmental regulations in the European Union (EU), such as REACH (Registration, Evaluation, Authorization and Restriction of Chemicals) as well as the EU Ecolabel, are pushing the transition towards sustainable, biodegradable, and innocuous chemicals like PAG-based lubricants and surfactants. It is also a strategic location for the automotive, aerospace, and pharmaceutical industries, key end-users of PAG products (known for their high thermal stability, good performance properties as a lubricant, and safety).
Key Players
-
BASF SE
-
Dow Inc.
-
LyondellBasell Industries N.V.
-
SABIC
-
Huntsman Corporation
-
Ineos Group
-
Shell plc
-
Clariant AG
-
Covestro AG
-
Idemitsu Kosan Co., Ltd.
Recent Development:
-
In August 2023, LG Chem planned to add additional PAG production capacity in South Korea to meet the growing volume of Asia applications, including electric vehicle (EV) applications.
-
In September 2023, ExxonMobil had notable production via a joint venture with a Chinese company, which manufactures PAGs for lubricants, expanding its reach in the Asia-Pacific region.
| Report Attributes | Details |
|---|---|
| Market Size in 2024 | USD 2.84 Billion |
| Market Size by 2032 | USD5.55 Billion |
| CAGR | CAGR of8.72% From 2025 to 2032 |
| Base Year | 2024 |
| Forecast Period | 2025-2032 |
| Historical Data | 2021-2023 |
| Report Scope & Coverage | Market Size, Segments Analysis, Competitive Landscape, Regional Analysis, DROC & SWOT Analysis, Forecast Outlook |
| Key Segments | •By Type (Polyethylene Glycol (PEG), Polypropylene Glycol (PPG), Others) •By Application (Lubricants, Surface Active Agents, Pharmaceutical, Personal Care, Others) |
| Regional Analysis/Coverage | North America (US, Canada, Mexico), Europe (Germany, France, UK, Italy, Spain, Poland, Turkey, Rest of Europe), Asia Pacific (China, India, Japan, South Korea, Singapore, Australia, Rest of Asia Pacific), Middle East & Africa (UAE, Saudi Arabia, Qatar, South Africa, Rest of Middle East & Africa), Latin America (Brazil, Argentina, Rest of Latin America) |
| Company Profiles | BASF SE, Dow Inc., LyondellBasell Industries N.V., SABIC, Huntsman Corporation, Ineos Group, Shell plc, Clariant AG, Covestro AG, Idemitsu Kosan Co., Ltd. |
Frequently Asked Questions
Asia Pacific led the Polyalkylene Glycols Market in the region with the highest revenue share in 2024.
Rising demand for high-performance lubricants drives the market growth.
Lubricants will grow rapidly in the Polyalkylene Glycols Market from 2025 to 2032.
The expected CAGR of the global Polyalkylene Glycols Market during the forecast period is 8.72%
The Polyalkylene Glycols Market was valued at USD 2.84 billion in 2024.
Get in Touch
