Polyaryletherketone Market Report Scope & Overview:
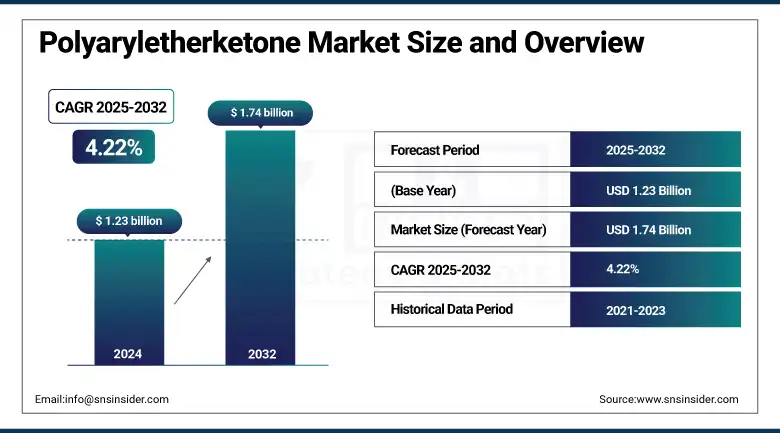
The Polyaryletherketone Market Size was valued at USD 1.23 billion in 2024 and is expected to reach USD 1.74 billion by 2032, growing at a CAGR of 4.22% over the forecast period of 2025-2032.
The Polyaryletherketone market analysis is provided for the growing electronics end-use industry, where it is preferred for its better thermal resistance and resistance to hard chemicals. As electronic devices continue to shrink and increase in power, materials that are able to withstand high temperatures without breaking down become increasingly vital. Polyaryletherketone (PAEK) polymers provide excellent performance under such severe conditions, making them well-suited for use in components such as connectors, insulators, and circuit boards. Their resistance to chemicals means they will operate reliably for many years, also in harsh surroundings such as solvents, fuels, and cleaning agents. This increase in demand is from manufacturers seeking to further strengthen the durability and safety of electronic products, particularly in the areas of aerospace, automotive electronics, and industrial, which drive the polyaryletherketone market growth.
To Get more information On Polyaryletherketone Market - Request Free Sample Report
In June 2024, the US Department of Commerce announced USD 325 million in funding for a new polysilicon crystal factory through Hemlock Semiconductor necessary for US semiconductor wafer production, demonstrating government backing for upstream materials going into high-performance applications
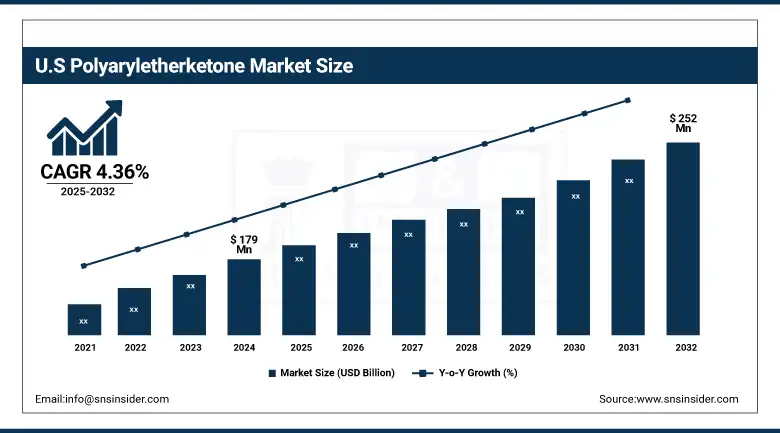
The U.S. Polyaryletherketone market size was USD 179 million in 2024 and is expected to reach USD 252 million by 2032 and grow at a CAGR of 4.36% over the forecast period of 2025-2032. It is driven by its mature aerospace sector and rapidly advancing 3D printing ecosystem. The U.S. leads in the clinical use of PEEK for orthopedic and spinal implants, with increasing procedural volumes across hospitals and surgical centres. Additionally, the defence and aviation sectors continue to rely on American-made PEKK and PEEK for lightweight, corrosion-resistant parts.
Market Dynamics
Key Drivers:
-
Rising Demand from Aerospace and Automotive for Lightweighting Drive the Market Growth
The demand for lightweight yet durable materials in the aerospace and automotive sectors is driving the adoption of Polyaryletherketone. PAEK polymers offer exceptional strength-to-weight ratios, thermal stability, and chemical resistance, making them ideal for replacing metal parts. With electrification and fuel efficiency mandates tightening globally, manufacturers are increasingly turning to PAEK to reduce vehicle weight and improve performance. Aerospace applications, such as cable insulation, brackets, and structural components, also benefit from the polymer's high-performance profile.
For Instance, in July 2023, Victrex expanded its manufacturing capacity to meet rising aerospace demand, investing in new PAEK processing lines in the U.K. to support increased production of aircraft-grade thermoplastics.
Restrain:
-
High Production and Processing Costs, which may hamper the Market Growth
The complex synthesis process and high-temperature processing requirements of PAEK significantly raise its production cost compared to conventional engineering plastics. Specialized equipment and energy-intensive steps make it less feasible for cost-sensitive sectors. Furthermore, injection molding and extrusion of PAEK require expertise and high-temperature-resistant tooling, limiting their widespread adoption. As a result, end-users often restrict its use to premium applications, which hampers volume growth in mid-tier industries.
Opportunities:
-
Government Push for Sustainability and Recyclability in Advanced Materials Creates an Opportunity for the Market
As governments implement stricter environmental regulations, materials that offer longer lifespans and recyclability are gaining traction. PAEK has the advantage of being thermoplastic, allowing for reprocessing and recyclability, unlike thermosets. This makes it attractive for aerospace and automotive manufacturers pursuing sustainability targets. Emerging circular economy policies in the EU and the U.S. further amplify the interest in recyclable high-performance polymers, which drive the polyaryletherketone market trends.
For Instance, the European Commission's Circular Economy Action Plan (2023) emphasizes sustainable material innovation, with grants and R&D support targeting recyclable engineering polymers, including PAEK-based materials in mobility sectors.
Segment Analysis:
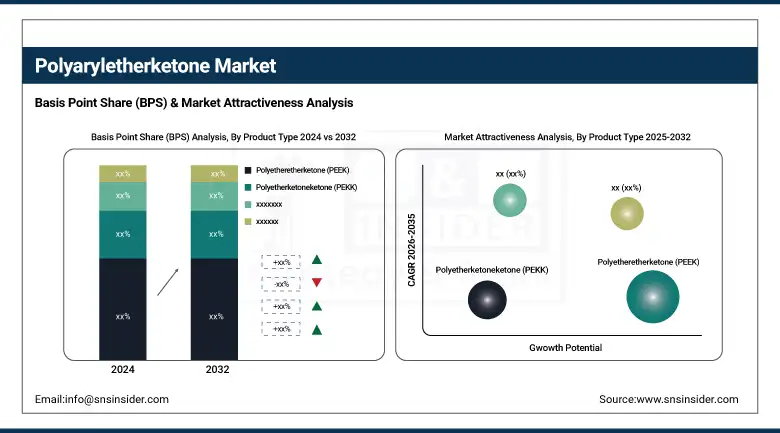
By Product Type
Polyetheretherketone (PEEK) dominated the Polyaryletherketone (PAEK) Market with 74.20% share on account of its excellent combination of mechanical strength, chemical resistance, and thermal stability which, in turn, helps in catering to demanding applications. As a lightweight replacement for metals, PEEK is being used in a variety of applications in the aerospace, automotive, medical, and electronics industries in order to be in line with the trend toward increased energy efficiency as well as optimized performance.
By Form
Granules held the largest market share, around 60% in 2024. It is due to their ease of handling, compatibility with standard injection molding and extrusion machinery, and wide availability. They offer versatility for mass production of precision parts in automotive, electronics, and medical sectors, where consistent flow and performance are crucial.
Filament is witnessing the fastest growth due to rising demand from additive manufacturing, especially in prototyping and low-volume aerospace and healthcare components. The push for lightweight, customizable parts through 3D printing, particularly using PEKK and PEEK filaments, has contributed to its acceleration in the past three years
By Processing Method
Injection molding leads the processing segment due to its ability to produce complex, high-precision parts at scale. Industries like automotive and electronics prefer this method for its cycle time efficiency and compatibility with granulated PEEK, enabling cost-effective production of structural and insulating components.
By End-Use Industry
Aerospace is the largest consumer of PAEK due to its stringent performance requirements for flame retardancy, lightweighting, and resistance to extreme temperatures. PEEK and PEKK are extensively used in brackets, clips, and insulation components for both commercial and defense aircraft. Stringent FAA and EASA regulations further support continued reliance on high-performance polymers.
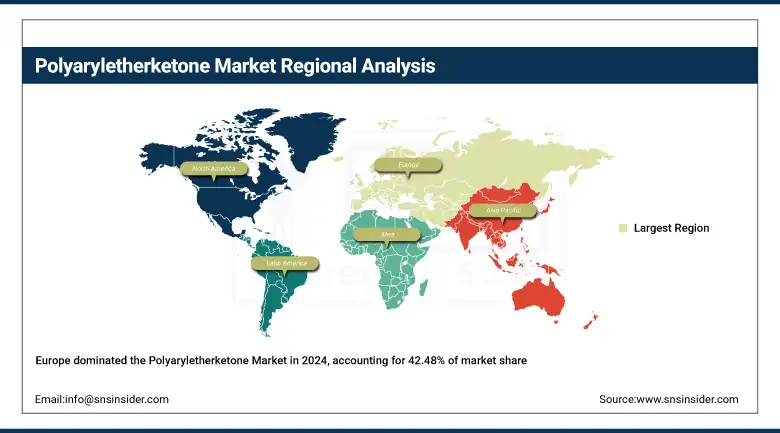
Regional Analysis:
Europe held the largest Polyaryletherketone market share of around 42.48% 2024. It is due to its established aerospace supply chains, stringent environmental regulations, and growing focus on sustainable mobility. Countries like Germany, France, and the U.K. have robust aerospace and automotive manufacturing bases, where PAEK materials are used to reduce component weight and improve fuel efficiency. Additionally, European MedTech companies are adopting PEEK in dental, orthopedic, and cardiovascular devices due to its biocompatibility and sterilization resistance.
Get Customized Report as per Your Business Requirement - Enquiry Now
In 2024, Germany-based Evonik Industries announced a capacity expansion for its high-performance polymers in Marl, including PEK and PEKK grades, to serve increasing demand from electric vehicle (EV) manufacturers and medical device exporters across the EU
The Asia Pacific region is the fastest-growing market. It is fueled by the expansion of electronics manufacturing, automotive production, and rising medical exports. Countries like China, South Korea, and Japan are investing in domestic polymer compounding and precision molding infrastructure. Growing adoption of PEEK in high-temperature automotive parts and miniaturized electronics components is accelerating regional demand.
In 2023, Victrex partnered with a major Chinese electronics manufacturer to co-develop miniaturized, high-performance PEEK components for 5G-enabled devices, reflecting Asia’s aggressive push into advanced materials for next-gen tech.
North America maintains a significant share of the Polyaryletherketone market, due to its strong aerospace, automotive, and medical device manufacturing ecosystems, especially in the U.S. and Canada. The presence of major OEMs and Tier-1 suppliers who favor high-performance polymers for lightweight, durable components has driven PAEK demand. Additionally, long-standing FDA and FAA approvals for PEEK and PEKK parts in critical applications have supported broader adoption across highly regulated sectors.
In 2024, Solvay announced the expansion of its PEEK production line at its Georgia facility to meet growing demand from aerospace and orthopedic clients in North America, reinforcing the region's leadership in specialty polymer production and application.
Key Players:
Major Polyaryletherketones companies are Victrex plc, Solvay, Evonik Industries AG, Arkema S.A., Gharda Chemicals, Tri-Mack Plastics Manufacturing Corporation, Ensinger GmbH, SABIC, RTP Company, Celanese Corporation, Zyex Ltd., Panjin Zhongrun High Performance Polymers Co., Ltd., Quadrant Group, Prototype & Plastic Mold Co., Inc., Greene Tweed, A. Schulman Inc., PlastiComp Inc., Shanghai Qianfeng Polymer Science Co., Ltd., Caledonian Industries Ltd., Ensinger Special Polymers.
Recent Development:
-
In 2024, Solvay strengthened its presence in North America by opening a new resin production facility in Georgia, aimed at boosting PEEK output for high-growth applications in aerospace, electric vehicles, and medical devices.
-
In 2024, Evonik Industries announced the expansion of its polymer production site in Marl, Germany, to increase the supply of PEK and PEKK materials, driven by growing demand in European electric mobility and medical markets.
| Report Attributes | Details |
| Market Size in 2024 | USD 1.25 Billion |
| Market Size by 2032 | USD 1.74 Billion |
| CAGR | CAGR of4.22% From 2025 to 2032 |
| Base Year | 2024 |
| Forecast Period | 2025-2032 |
| Historical Data | 2021-2023 |
| Report Scope & Coverage | Market Size, Segments Analysis, Competitive Landscape, Regional Analysis, DROC & SWOT Analysis, Forecast Outlook |
| Key Segments | • By Product Type (Polyetheretherketone (PEEK), Polyetherketoneketone (PEKK), Polyetherketone (PEK), Others (e.g., PEAEK, blends)) • By Form (Powder, Granules, Filament, Others (e.g., foam, composites)) • By Processing Method (Injection Molding, Extrusion, 3D Printing, Compression Molding, Others (e.g., machining)) • By End-Use Industry (Aerospace, Automotive, Medical, Electrical & Electronics, Oil & Gas, Industrial, Others (e.g., semiconductors, consumer goods)) |
| Regional Analysis/Coverage | North America (US, Canada), Europe (Germany, France, UK, Italy, Spain, Poland, Russsia, Rest of Europe), Asia Pacific (China, India, Japan, South Korea, Australia,ASEAN Countries, Rest of Asia Pacific), Middle East & Africa (UAE, Saudi Arabia, Qatar, Egypt, South Africa, Rest of Middle East & Africa), Latin America (Brazil, Argentina, Mexico, Colombia Rest of Latin America) |
| Company Profiles | Victrex plc, Solvay, Evonik Industries AG, Arkema S.A., Gharda Chemicals, Tri-Mack Plastics Manufacturing Corporation, Ensinger GmbH, SABIC, RTP Company, Celanese Corporation, Zyex Ltd., Panjin Zhongrun High Performance Polymers Co., Ltd., Quadrant Group, Prototype & Plastic Mold Co., Inc., Greene Tweed, A. Schulman Inc., PlastiComp Inc., Shanghai Qianfeng Polymer Science Co., Ltd., Caledonian Industries Ltd., Ensinger Special Polymers |
Frequently Asked Questions
High production costs, complex processing methods, and limited raw material availability are key challenges.
North America and Europe lead the market, with Asia Pacific emerging as the fastest-growing region
Aerospace, medical, automotive, and electrical & electronics industries are major demand drivers.
Key players include Victrex, Solvay, Evonik Industries, SABIC, Arkema, and Ensinger.
The market shows strong growth potential driven by rising demand for high-performance materials in aerospace, medical, and electronics sectors.
Get in Touch
