Port Equipment Market Report Scope & Overview:
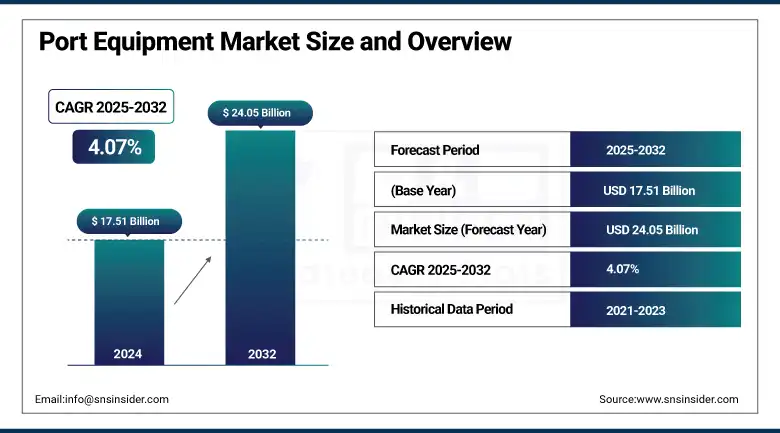
The port equipment market size was valued at USD 17.51 billion in 2024 and is expected to reach USD 24.05 billion by 2032, growing at a CAGR of 4.07% over the forecast period of 2025-2032.
The port equipment market growth is primarily driven by growing volumes of global trade, port expansions, and increasing investment in modernizing port infrastructure. There is an expected rise in demand for advanced cargo handling equipment and container handling systems for ports in the near future to increase operational efficiency and reduce turnaround time, thus driving the growth of the global container handling system market. The process of transferring goods from one terminal to another terminal, as well as loading and unloading the goods, can be performed easily with the help of cranes, reach stackers, straddle carriers, and forklifts. The Container Handling Equipment Market, especially, is experiencing a major boost from the containerization trend and the need for quicker and safer movement of goods.
To Get more information On Port Equipment Market - Request Free Sample Report
Furthermore, the adoption of port automation solutions is transforming traditional port operations. Automated guided vehicles (AGVs), remote-controlled cranes, and real-time monitoring systems are being increasingly integrated into port logistics to enhance productivity and reduce human error. These technologies become very important when they have to manage how many goods are moving and with how many terminals they should coordinate at a port. With stricter rules pertaining to the environment, manufacturers are also gaining traction in designing electric and hybrid power-based cargo handling equipment to meet low-emission requirements and aid sustainable port operations. Collectively, these factors are sure to put the pedal to the metal for the port equipment market and into an integral part of the story of the global supply chain ecosystem.
In May 2025: The Port of Corpus Christi has launched OPTICS, an AI-powered digital twin system that improves real-time ship tracking and safety using live data and machine learning. It also uses generative AI for realistic emergency training simulations. Launched in late 2024, OPTICS is part of wider upgrades including 5G connectivity, with plans to add AR/VR and predictive analytics for enhanced maritime operations.
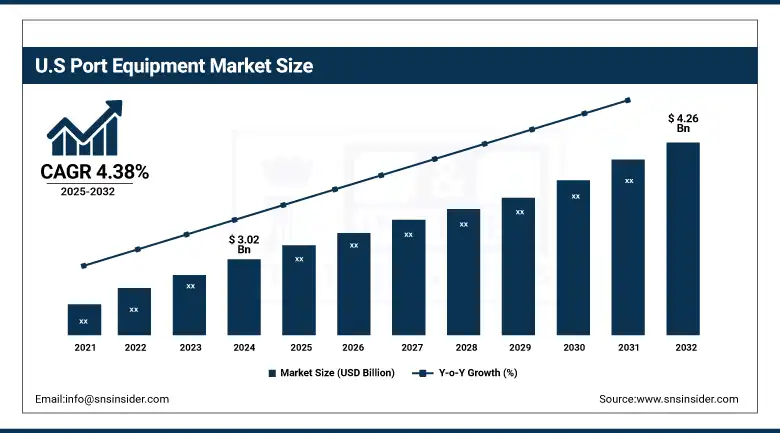
The U.S. port equipment market is set to grow steadily from USD 3.02 billion in 2024 to USD 4.26 billion by 2032, with a CAGR of 4.38%. Supported by modernization initiatives and cargo volumes, economic growth through innovation enables them to protect all port infrastructure through the use of technologies. The increasing trade activities and expansion of investments in maritime logistics are expected to continue through the forecast period, owing to this trend.
Port Equipment Market Dynamics
Drivers
-
Maritime trade growth drives the modernization of port equipment by increasing demand for faster, more efficient cargo handling technologies.
The rapid growth of global trade, particularly through maritime transport, is driving a strong demand for efficient and advanced port equipment. In the face of ever-increasing volumes shipped worldwide, ports are under pressure to be able to accommodate larger vessels in shorter turnaround times more accurately, and the hubs of international trade are expanding and modernizing. Containerization, the unprecedented scaling of cargo into standard and modular loads, further necessitates particularized machinery, including container cranes, automated guided vehicles, and yard handlers, which all speed the loading and unloading processes, minimize turnaround, and increase overall port throughput. Current port equipment market trends illustrate these changes as they are obviously moving towards automation, digital, and sustainable solutions to continue meeting the operational challenges & sustainability requirements of modern ports worldwide.
In May 2025, the Freeport of Riga launched a private 5G network with telecom partner LMT to improve real-time communication between the port, ships, and autonomous sea drones. This advanced system replaces older WiFi and 4G, enabling extended connectivity over 100 miles offshore through a unique “multi-hop” method. The upgrade boosts maritime logistics efficiency and supports safer navigation, positioning Riga as a tech-forward port.
Restraint
-
Strict environmental regulations increase costs and delay port equipment upgrades, pushing demand for cleaner technologies.
Stringently enforced regulatory and environmental constraints exert a serious influence on the port equipment market by establishing stringent limits on emissions, noise, and safety of operations. Governments and international organizations are about to tighten green port regulations, introducing low-emission, low emission agent low-noise equipment. Adherence to these standards is commonly linked to Major alterations or equipment renewals to the in-place machinery to clear away, which in turn brings about capital rises and costs to equipment manufacturers as well as operational costs for port authorities. Finally, cumbersome bureaucracy and regulation can slow the work of new apparatuses for the decommission pipedreams and block the caliber-enhancing way of productivity. These challenges push the industry toward research and the innovation process: direction towards cleaner and low-emission technologies, Energy in the port equipment sector, pace & path.
In February 2024, the EPA launched a USD 3 billion Clean Ports Program to promote zero-emission technologies at U.S. ports. Funded by the Inflation Reduction Act, the program aims to reduce diesel pollution, improve air quality, and support environmental justice. It includes funding for deploying zero-emission equipment and climate planning to help port communities.
Port Equipment Market Segmentation Analysis
By Operation
The conventional segment dominated the market and accounted for 71.05% of the port equipment market share. This supremacy is primarily due to its widespread implementation and the seasoned framework that upholds conventional port operations throughout the world. In many ports, especially in developing areas, the traditional machinery remains widely used, because it is reliable, value-efficient, and the operators are used to it. Also, the high upfront cost and integration hurdles related to such autonomous technologies have played into the hands of conventional systems, which remain in high on demand. Despite innovation slowly altering port operations, conventional equipment very much retains its position of being the backbone of the industry, as it is well established and works reliably.
The autonomous segment is emerging as the fastest-growing segment in the port equipment market, primarily due to innovations in automation technology and digital infrastructure. Autonomous solutions are getting implemented in ports globally to increase productivity, eliminate human mistakes, and improve safety standards. The demand is further accelerated by the changing paradigm of smart port development, specifically the need for real-time data, predictive maintenance, and overall streamlined logistics. Furthermore, labour shortage and an increase in manual operations are pushing the operators to adopt autonomous systems. The data also demonstrates a wider transition away from heavy infrastructure and static operations at ports in favor of the dry land, deeper sea, and smart, tech-empowered port operations that trade requires.
By Power
The Diesel segment dominated with a significant 64.02% share in 2024. Due to its wide adoption, track record for reliability, and extensive fueling infrastructure, particularly for heavy-duty activities in large ports. Port operators still favour diesel power in equipment owing to its proven capabilities, durability, and ability for heavy workloads over a protracted operational cycle. On the other hand, due to the transition to clean energy, stricter emission regulations, and advancements in battery technologies, the Electric segment is positioned as the fastest-growing segment, as it incites ports to move towards sustainable and energy-efficient equipment solutions.
The electric segment is the fastest growing in the port equipment market, primarily fueled by stringent environmental regulations and the global push toward cleaner, more sustainable operations. With carbon engine savings becoming more and more common practice, ports are shifting from elastic quayside equipment to use to diesel machinery. The technical evolution of batteries has improved the performance and reliability and extended the operational range of electric equipment, making them more and more appealing to port authorities. In addition to this, lower fuel consumption and maintenance requirements are a constant long-term economic advantage that is pushing towards electrification and making electric-powered solutions a pillar of modern ports.
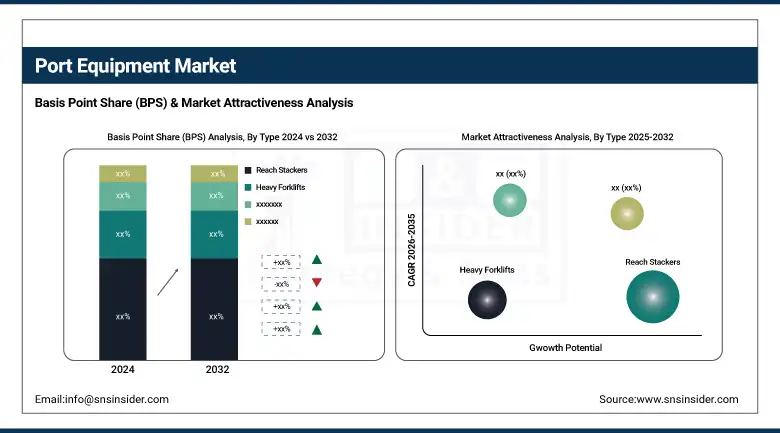
By Type
The Reach stackers dominated the port equipment market, accounting for 33% of the segment in 2024. The reason for their supremacy is the flexibility and efficiency in operation regarding the intermodal cargo containers. This high stacking ability and swift lift and transport make reach stackers ideal for use in medium-sized ports and terminals. Containers are handled most flexibly with them, and they operate at comparatively low costs and are easy to maneuver with, which is why rubber tyre gantries are preferred to other equipment types. Their adoption is wide and reinforces their market position, especially when it comes to ports that are looking to gain space and have fast turnaround.
The Container handlers are the fastest-growing segment in the port equipment market, fueled by the rapid expansion of containerized trade worldwide. With the increase of global shipping, ports are always in need of efficient methods they can employ to stack containers and optimize space while speeding up port activities. Container handlers provide unique functionality when it comes to the movement, loading, and unloading of containers in tight and busy terminal locations. Perfectly suited for high-density cargo zones, expedited turnaround, and improved overall port productivity due to their advanced technology and adaptability, these state-of-the-art vessels, therefore, drive rapid adoption and growth in global ports compared to other types of port-enabled equipment.
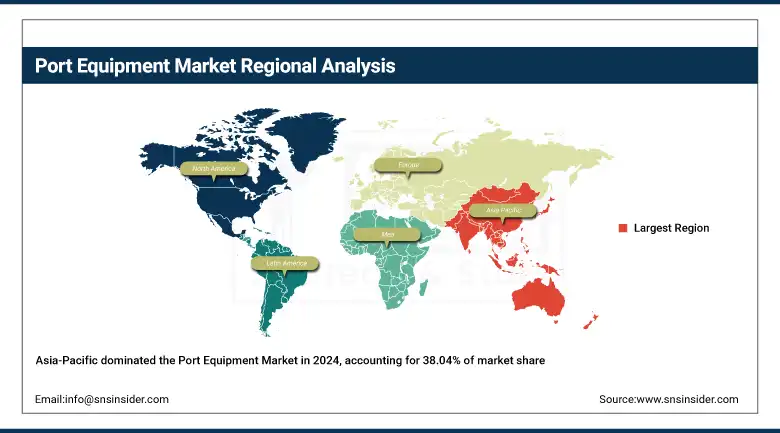
Port Equipment Market Regional Outlook
The Asia-Pacific region dominated the port equipment market, accounting for approximately 38.04% of the market share in 2024. The primary reason for this supremacy is the rapid growth of industries and cities in several countries like China, India, and Southeast Asian countries. With the cargo on the rise, expansion works are on in every major port in this region to cater to the increasing cargo as well as the bigger vessels. Finally, globalization, along with favorable government policies boosting maritime trade activities, has also aided market development in recent years. The Asia-Pacific region will continue to maintain its top position in the global port equipment market due to investments in port infrastructure and the acquisition of advanced equipment.
Get Customized Report as per Your Business Requirement - Enquiry Now
China leads the Asia-Pacific port equipment market, driven by strategic projects like the Belt and Road Initiative that enhance regional port infrastructure. The country also pioneers smart technologies, using AI-powered cranes and 5 G-enabled terminals to modernize port operations.
In October 2024, Ericsson, China Mobile, and Zhangjiagang Port Group launched a 5 G-powered smart network at Zhangjiagang Port, boosting operational efficiency, cutting energy use, and lowering costs. This project highlights China’s forefront role in adopting advanced technology for port management.
North America is recognized as the fastest-growing region in the Port Equipment Market, driven primarily by continuous technological advancements and large-scale infrastructure modernization projects. With the increased need for operational efficiency and reduced operational costs, port operations are transforming through automation and smart port equipment. The market is also growing on account of government efforts for the modernization of old port infrastructure and increasing cargo handling capacity. Simultaneously, the rise in emphasis on sustainable energy and energy-efficient equipment in ports across North America further paves the way for this rapid expansion and is attributed to the likely future growth of the region's share in the global port equipment market.
In September 2024, U.S. ports won a key tariff exemption on Chinese-made cranes, saving over USD 130 million and easing financial burdens on port authorities and terminal operators.
Europe holds a significant share of the Port Equipment Market, underpinned by its well-established port infrastructure and extensive maritime trade networks. Some of the most important ports are Rotterdam, Hamburg, and Antwerp, which are regularly investing in modern port facilities, optimizing both efficiency and capacity. Green emphasis in Europe investments in green and efficient ports answers strict environmental rules. Finally, the region always strives for innovations and the use of smart technologies to maintain relevance in recognition of trends. All of these factors collectively ensure that Europe will continue to have a strong presence in the global port equipment market.
Germany hosts leading port equipment makers like Liebherr, Terex, and Gottwald, known globally for advanced cranes and container handling machinery. Ports like Hamburg are at the forefront of smart automation and AI-based logistics and place the latest technological standards, such as 5G, IoT, and digital twin, on the map. Germany has constructed its reputation on sustainable advancements in smart ports and having solid government backing behind green/EV/hybrid gear, shore power, and hydrogen devices.
In April 2024, Konecranes grew its port services by purchasing the German company Kocks Kranbau GmbH. This acquisition boosts Konecranes' reach in Europe and opens doors to new international clients, highlighting Germany’s key position in the port equipment sector.
Key Players in Port Equipment Market are:
Port Equipment Companies are Toyota Material Handling, Kalmar (part of Cargotec Corporation), Liebherr Group, Konecranes Abp, Cargotec Corporation, Sany Heavy Industry Co. Ltd., Shanghai Zhenhua Heavy Industries (ZPMC), Emerson Electric Co., ABB, SIEMENS AG.
Recent Development
-
In September 2024: a U.S. House committee revealed that Shanghai Zhenhua Heavy Industries (ZPMC) installed unauthorized intelligence-gathering devices on cranes at U.S. seaports. These hidden devices, capable of remote communication, were not approved by U.S. authorities and posed risks of spying and operational disruption. The committee has called for the immediate removal of these devices and proposed a USD 20 billion investment to strengthen domestic port infrastructure and reduce dependence on foreign equipment.
-
In September 2024: Liebherr Group: Fortescue Metals Group placed a USD 2.8 billion order for 360 autonomous battery-electric trucks, 55 electric excavators, and 60 battery-powered dozers, representing one of the largest zero-emission mining fleet contracts worldwide.
| Report Attributes | Details |
|---|---|
| Market Size in 2024 | USD 17.51 Billion |
| Market Size by 2032 | USD 24.05 Billion |
| CAGR | CAGR of 4.07% From 2025 to 2032 |
| Base Year | 2024 |
| Forecast Period | 2025-2032 |
| Historical Data | 2021-2023 |
| Report Scope & Coverage | Market Size, Segments Analysis, Competitive Landscape, Regional Analysis, DROC & SWOT Analysis, Forecast Outlook |
| Key Segments | • By Operation (Conventional, Autonomous) • By Power (Diesel, Electric, Hybrid) • By Type (Heavy Forklifts, Reach Stackers, Container Handlers, Terminal Tractors, Others) |
| Regional Analysis/Coverage | North America (US, Canada, Mexico), Europe (Germany, France, UK, Italy, Spain, Poland, Turkey, Rest of Europe), Asia Pacific (China, India, Japan, South Korea, Singapore, Australia, Rest of Asia Pacific), Middle East & Africa (UAE, Saudi Arabia, Qatar, South Africa, Rest of Middle East & Africa), Latin America (Brazil, Argentina, Rest of Latin America) |
| Company Profiles | Toyota Material Handling, Kalmar (part of Cargotec Corporation), Liebherr Group, Konecranes Abp, Cargotec Corporation, Sany Heavy Industry Co. Ltd., Shanghai Zhenhua Heavy Industries (ZPMC), Emerson Electric Co., ABB, SIEMENS AG. |
Frequently Asked Questions
The Asia-Pacific region dominated the Port Equipment Market in 2024.
The “Conventional” segment dominated the Port Equipment Market.
Maritime trade growth drives the modernization of port equipment by increasing demand for faster, more efficient cargo handling technologies.
The Port Equipment Market was USD 17.51 billion in 2024 and is expected to reach USD 24.05 billion by 2032.
The Port Equipment Market is expected to grow at a CAGR of 5.33% from 2025-2032.
Get in Touch
