POS Printer Market Report Scope & Overview:
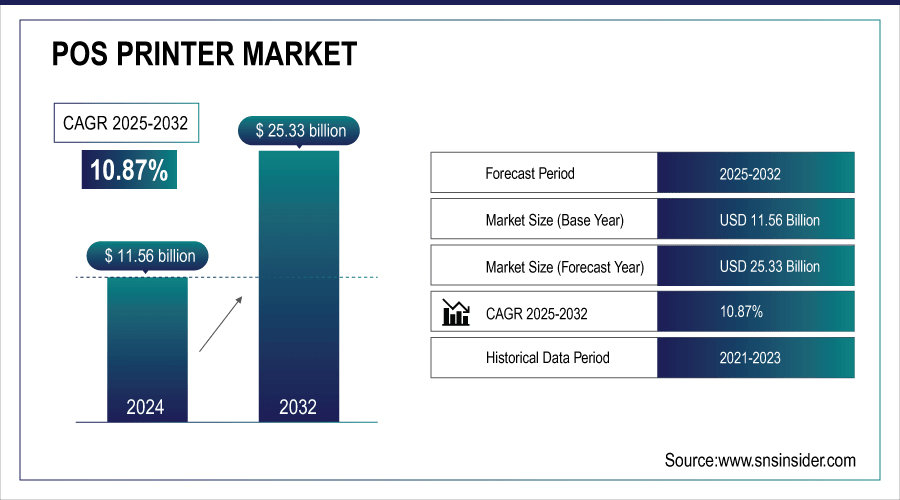
The POS Printer Market size was valued at USD 11.56 Billion in 2024 and is projected to reach USD 25.33 Billion by 2032, growing at a CAGR of 10.37% during 2025-2032.
The global market comprising of dynamics, segmentation by type, design, connectivity, and end-user, along with regional analysis, and growth opportunities. Global POS printer market is expected to grow at a substantial growth rate over the forecast period due to rising adoption of digital payment solutions, increasing demand from retail and hospitality sectors along with printing technology advancements driving expansion globally. Thereby, POS printers emerge as vital devices which enable efficient transaction management, faster operations and enhanced customer experience, making one of the critical component of high operational efficiency and reliability across industries.
-
Over 70% of modern retail outlets now integrate POS printers with cloud-based transaction systems.
-
Energy-efficient thermal printers reduce operational electricity consumption by 20% compared to traditional impact printers.
POS Printer Market Trends
-
Rising digital payments, e-commerce channels, and contactless transactions are accelerating POS printer adoption globally.
-
Businesses are adopting printers that integrate with cloud-based platforms, mobile devices, and digital wallets for efficient high-volume transaction management.
-
Growing preference for cashless payments and instant receipts is boosting POS printer demand across retail and hospitality sectors.
-
Urbanization, increasing disposable incomes, and expanding retail and hospitality sectors in emerging markets offer significant growth potential for manufacturers.
-
POS solutions are increasingly utilized in healthcare and pharmacy for billing, inventory management, and patient record tracking.
-
Companies can strengthen their global footprint and diversify revenue streams by providing cost-effective, technologically advanced printers with local support in new markets.
POS Printer Market Report Highlights
The U.S. POS Printer Market size was valued at USD 2.71 Billion in 2024 and is projected to reach USD 5.85 Billion by 2032, growing at a CAGR of 10.18% during 2025-2032. The U.S. market growth is primarily attributed to increasing investments in the retail and hospitality sectors, expansion of e-commerce, and rising consumer demand for fast and reliable transaction systems. Increased operational efficiency from deployment of advanced thermal and mobile POS solutions, coupled with government initiatives fostering demand for digital payment infrastructure. This, in turn, makes the country one of the largest contributors to the surface POS printer market, suggesting that the U.S. has a high growth potential and also, the extensive application of POS systems across major industries.
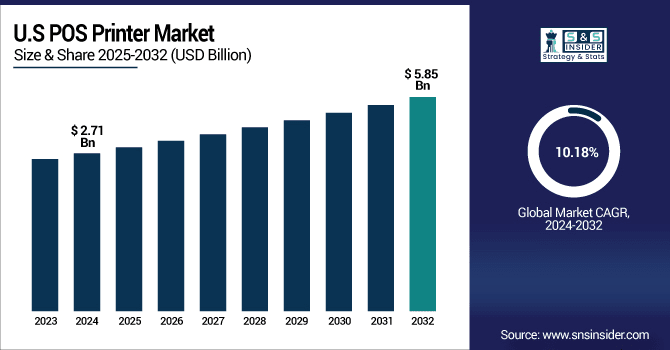
POS Printer Market trends indicate rapid growth owing to the growing inclination utilization of cashless systems, retail and hospitality industries amplification, and expands request for solid, quick, and efficient transaction solutions.
POS Printer Market Segment Analysis
-
By Type, Thermal Printers held the largest share of around 60.20% in 2024, and is projected to be the fastest-growing segment with a CAGR of 10.72%.
-
By Design, the Desktop POS Printers segment dominated the market with approximately 59.30% share in 2024, while Mobile POS Printers is expected to register the highest growth with a CAGR of 11.20%.
-
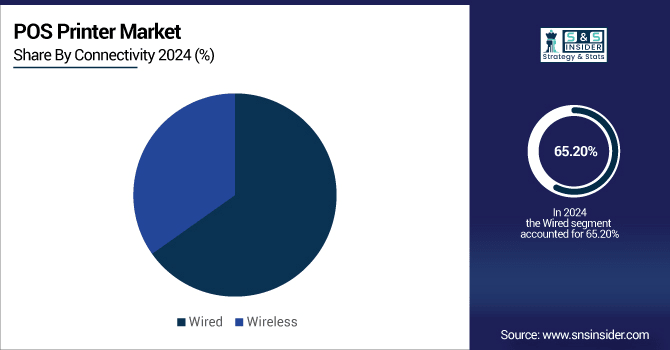
By Connectivity, Wired segment accounted for the leading share of nearly 65.20% in 2024, whereas Wireless segment is anticipated to be the fastest-growing segment with a CAGR of 10.48%.
-
By End-User, the Retail segment led the market with about 38.20% share in 2024, while the Healthcare segment is forecasted to grow the fastest at a CAGR of 11.45%.
By Type, Thermal Printers Leads Market and Registers Fastest Growth
The Thermal Printers segment of the POS Printer Market is projected to hold the largest revenue share of 60.20% in 2024, primarily due to low maintenance, cost-effectiveness, and high-speed printing. Ideal for retail and hospitality (huge adoption), they are highly reliable for high-volume transactions. Companies such as Epson offer state of the art long life thermal printers which are multifunctional. During the period of 2024-2032, the Thermal Printers are anticipated to lead with fastest CAGR of 10.72% on account of technology advancements & rising demand for rapid paperless receipt generation.
By Design, Desktop POS Printers Dominate While Mobile POS Printers Shows Rapid Growth
Desktop POS Printers segment held the largest revenue share of 59.30% in 2024 as they are stable, multifunctional and perfect to be used in high volume operations extensively liked by top leaders of retail. Commonly used in superstores, restaurants and retail outlets for managing transactions efficiently. Brands such as Star Micronics manufactures solid desktop printers that simply help in making your operational efficiency top notch. Delivering well with the forecast period of 2024-2032, Mobile POS Printers are projected to register fastest CAGR of 11.20% owing to omnichannel adoption in delivery services, pop-up stores and mobile retail solutions with wireless connectivity and portability.
By Connectivity, Wired Segment Lead While Wireless Segment Registers Fastest Growth
In 2024, Wired segment led the POS Printer Market with a revenue share of 65.20%, owing to being stable and reliable, providing a consistent data transfer for high-volume transactions. In traditional retail or hospitality environments, wired printers have always been the preferred choice. Bixolon offers wired printers with competitive speed that are adopted by retail chains globally. For this reason, wireless segment is expected to grow at the fastest CAGR of 10.48% over the forecast period of 2024 to 2032, owing to the demand for mobile POS systems, cloud integration solutions, and the ability to easily manage the layout, which currently allows for integration with a number of different devices such as smartphones and tablets.
By End-User, Retail Segment Lead While Healthcare Grows the Fastest
Retail segment accounted for a revenue share of 38.20% in 2024 mainly due to high volume of transactions several retailers handle along with the demand for faster receipt generation, along with large number of point-of-sale networks among various retail shops. POS Printers enhance customer experience and operational efficiency, Zebra Technologies as POS Solutions for Retail Applications. This research report also presents a detailed POS printer market analysis of the healthcare segment, which is projected to attain the highest CAGR of 11.45% during 2024-2032 period owing to high demand for digital management of records, pharmacy billing and patient identification that seamlessly integrates with hospital management systems.
Asia-pacific POS Printer Market Insights
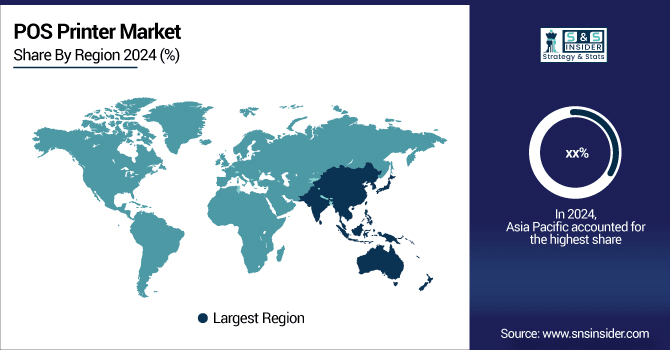
Asia Pacific is anticipated to witness the highest CAGR of 22.75% over the forecast period of 2024-2032, owing to rapid urbanization and growing retail and e-commerce segment in the region, support from government for cashless economy, and enhanced adoption of advanced POS solutions in developing countries. This, combined with increasing consumer discretionary spending and small and medium enterprise expansion, ultimately sets the stage for an attractive growth atmosphere for market players and the high uptake rate of modern-day POS printing technologies in the region.
North America POS Printer Market Insights
In 2024, North America held the largest revenue share in the POS Printer Market accounting for over 33.20%, resulting from well-established retail & hospitality infrastructures, high acceptance of digital payment solutions, and healthy technology push. The high density of distribution channels, stable consumer demand, and regular upgradation of POS technology collectively make North America a prime target market for global POS printer makers and also facilitate their large-scale penetration across diverse industrial sectors.
Europe POS Printer Market Insights
The Europe POS Printer Market growth is driven primarily by the high growth of the retail and hospitality end-user sectors, rising adoption of digital payment systems, and technological advancements in printing solutions. Well infrastructure, built distribution networks and emphasis on better customer experience facilitate market expansion. The Europe point of sale printer market size is analyzed across product and geography and is leading global market growth with contribution from countries such as Germany, UK and France.
Latin America (LATAM) and Middle East & Africa (MEA) POS Printer Market Insights
Middle East & Africa POS Printer Market is booming on account of increasing demand from retail and hospitality sector, growing preference for digital payments and modernizing business operations, along with UAE and Saudi Arabia dominating the regional market. Likewise, Latin America is witnessing growth in retail and e-commerce activities such as Brazil and Argentina, thereby fueling the sales of POS printers.
POS Printer Market Growth Drivers:
-
Increasing Adoption of Advanced POS Solutions Fueled by E-Commerce and Digital Payment Expansion
Growing conditions for POS printer adoption are being expedited by the rise of digital payments, e-commerce channels, and contactless transactions. To manage high-volume transactions, companies are choosing modern printing solutions that integrate with cloud-based systems and mobile devices. Mobile printers, thermal printers, and wireless connectivity options bring effortless integration with digital wallets and payment apps. The growing consumer demand for cashless payments and instant receipts is another factor increasing this demand. Global growth of the POS printer market over the forecast period will be supported by the rising adoption of advanced point of sale systems by retailers, restaurants, and service providers.
-
Over 65% of retailers now use thermal or mobile POS printers for high-volume transactions.
-
Mobile and thermal printers reduce maintenance costs by up to 20% compared to older dot-matrix models.
POS Printer Market Restraints:
-
High Initial Investment and Maintenance Costs Limit POS Printer Market Expansion Across Small Enterprises
A POS system is a large infrastructure requiring significant hardware and software based investment and upfront costs and at least a full day of training. The cost of consumables, such as thermal paper and parts, can be prohibitive, discouraging small businesses from adopting them. Existing IT systems may make integration more complicated and increase costs due to the need for software upgrades. Such factors deter small and medium enterprises to roll out advanced POS solutions, especially in cost-savvy regions. Furthermore, significant operational challenges from compatibility issues with legacy systems and consistent technological breakthroughs likely inhibit overall market growth considering the high demand from retail and hospitality sectors globally.
POS Printer Market Opportunities:
-
Expansion Of Retail, Hospitality, And Healthcare Sectors Drives POS Printer Adoption in Emerging Economies
The POS printer manufacturers can benefit from the emerging economies which due to urbanization, disposable incomes, and retail and hospitality sectors are growing swiftly. Continuous development of cashless economy with infrastructure adoption for digital payments by nations and few initiatives by government are expected to generate future growth opportunities for manga and anime market expansion. POS solutions are also being used in healthcare and pharmacy segments for billing, inventory, and patient records. These growth avenues can be tapped by companies by providing economical, tech-savvy printers with local support as well. Diversifying revenue streams and fortifying a global footprint while keeping pace with rising demand for efficient transaction management through expansion into emerging markets is a key driver of growth among the manufacturers.
-
Over 60% of small and medium retail outlets in emerging economies now adopt cloud-enabled POS printers for faster transactions.
-
POS printers are being used in pharmacies to print real-time prescriptions and inventory labels, reducing manual errors by 25%.
Competitive Landscape POS Printer Market:
Epson is a global leader for point-of-sale printing, providing fast, reliable and technologically advanced solutions for the retail, hospitality and service sectors. The TM-T88VI provides fast thermal printing, multiple connection interfaces while the TM-m30 features a compact mobile printer for cloud-based systems, efficient integration. These products, then, coupled with each other, guarantee transaction speed, backing of digital payments and provide international businesses with rapid, accurate, and professional customer service.
-
In October 2024, Epson launched the OmniLink TM-T88VII, succeeding the TM-T88VI. This model offers enhanced connectivity options, improved print speeds, and better energy efficiency, catering to the evolving needs of modern retail and hospitality environments.
Star Micronics utilizes innovative POS printers and built-in retail and hospitality integrated possessed solutions. The TSP143III high-speed thermal desktop printer with advanced connectivity and mPOP (combined printer and cash drawer) for mobile-friendly operations. With these products, it helps simplify operations, minimize transaction time and ensures efficiency to allow businesses to leverage the capability to provide customer experience efficiency by advancing with digital payment trends globally.
-
In January 2024, Star Micronics introduced the TSP143IV SK, a sticky linerless label printer. This model is designed for businesses requiring label printing solutions, offering features such as high-speed printing and compatibility with various POS systems.
Bixolon provides wide POS printing solutions for thermal, mobile, and label printers, including in various global regions within retail, hospitality, and healthcare sectors. The SRP-350III is a rugged, high-speed desktop printing solution with a variety of interface options, and the SPP-R310 is designed to provide portable receipt printing ideal for mobile applications. Rich transaction management, smooth integration in various software and consistent performance, makes Bixolon a leading global provider of innovative & cost-effective POS solutions.
-
In October 2024, Bixolon announced the SRP-350III, a 3-inch thermal receipt printer known for its high-speed printing capabilities and multiple connectivity options. It's tailored for retail, hospitality, and ticketing applications.
Zebra Technologies provides robust end-to-end POS and receipt printing solutions for retail, healthcare, and logistics globally. The ZD410 is a quick and compact desktop printer for fast, reliable, high-quality printing with versatile connectivity options and the ZQ520 rugged mobile printer is ideal for on-the-go printing environments. These printers work together to enhance operational efficiency; support modern cloud-based POS systems; deliver seamless, reliable, and high-speed transaction processing with exceptional accuracy across various business use cases.
-
In April 2024, Zebra Technologies released an update for the ZD410 printer, enhancing its firmware and compatibility with the Link-OS platform. This update improves the printer's performance and integration with various POS systems.
HP Inc. delivers high-performance POS printing solutions that are fast, accurate and reliable running full-day operations per shift. Available desktop printing with the robustly featured, modern POS software integrated RP9, or the mobile printing Engage Go for on-the-move flexibility. With these products businesses across the globe are enabling efficient course of transactions, speed up receipts generation and easy integration, all with digital payment system to offer better customer experience along with operational productivity.
-
In May 2024, HP refreshed the BIOS for the RP9 G1 Retail System, ensuring better performance and security. This update supports the continued use of the RP9 G1 in modern retail environments.
POS Printer Market Key Players
Some of the POS Printer Market Companies are:
-
Epson
-
Star Micronics
-
BIXOLON Co., Ltd.
-
Zebra Technologies
-
TSC Auto ID Technology Co., Ltd.
-
Honeywell International Inc.
-
Citizen Systems
-
NCR Corporation
-
HP Inc.
-
Canon Inc.
-
Brother Industries, Ltd.
-
Ricoh Company, Ltd.
-
Lexmark International
-
Able Systems Limited
-
Nippon Primex Inc.
-
SNBC
-
Custom SPA
-
Oki Data America
-
Pertech Industries
-
SEWOO
Report Attributes | Details |
---|---|
Market Size in 2024 | USD 11.56 Billion |
Market Size by 2032 | USD 25.33 Billon |
CAGR | CAGR of 10.37% From 2025 to 2032 |
Base Year | 2024 |
Forecast Period | 2025-2032 |
Historical Data | 2021-2023 |
Report Scope & Coverage | Market Size, Segments Analysis, Competitive Landscape, Regional Analysis, DROC & SWOT Analysis, Forecast Outlook |
Key Segments | • By Type (Thermal Printers, Impact/Dot Matrix Printers and Inkjet Printers) • By Design (Desktop POS Printers, Mobile POS Printers and Kiosk POS Printers) • By Connectivity (Wired and Wireless) • By End-User (Hospitality, Healthcare, Retail, Entertainment and Others) |
Regional Analysis/Coverage | North America (US, Canada, Mexico), Europe (Germany, France, UK, Italy, Spain, Poland, Turkey, Rest of Europe), Asia Pacific (China, India, Japan, South Korea, Singapore, Australia, Taiwan, Rest of Asia Pacific), Middle East & Africa (UAE, Saudi Arabia, Qatar, South Africa, Rest of Middle East & Africa), Latin America (Brazil, Argentina, Rest of Latin America) |
Company Profiles | Epson, Star Micronics, BIXOLON Co., Ltd., Zebra Technologies, TSC Auto ID Technology Co., Ltd., Honeywell International Inc., Citizen Systems, NCR Corporation, HP Inc., Canon Inc., Brother Industries, Ltd., Ricoh Company, Ltd., Lexmark International, Able Systems Limited, Nippon Primex Inc., SNBC, Custom SPA, Oki Data America, Pertech Industries and SEWOO. |
Table Of Contents
1. Introduction
1.1 Market Definition & Scope
1.2 Research Assumptions & Abbreviations
1.3 Research Methodology
2. Executive Summary
2.1 Market Snapshot
2.2 Market Absolute $ Opportunity Assessment & Y-o-Y Analysis, 2021–2032
2.3 Market Size & Forecast, By Segmentation, 2021–2032
2.3.1 Market Size By Type
2.3.2 Market Size By Design
2.3.3 Market Size By Connectivity
2.3.4 Market Size By End-User
2.4 Market Share & Bps Analysis By Region, 2024
2.5 Industry Growth Scenarios – Conservative, Likely & Optimistic
2.6 Industry CxO’s Perspective
3. Market Overview
3.1 Market Dynamics
3.1.1 Drivers
3.1.2 Restraints
3.1.3 Opportunities
3.1.4 Key Market Trends
3.2 Industry PESTLE Analysis
3.3 Key Industry Forces (Porter’s) Impacting Market Growth
3.4 Industry Supply Chain Analysis
3.4.1 Raw Material Suppliers
3.4.2 Manufacturers
3.4.3 Distributors/Suppliers
3.4.4 Customers/End-Users
3.5 Industry Life Cycle Assessment
3.6 Parent Market Overview
3.7 Market Risk Assessment
4. Statistical Insights & Trends Reporting
4.1 Technology & Product Metrics
4.1.1 Average printing speed (mm/sec) across leading POS printer models
4.1.2 Paper width and type compatibility (thermal, impact, or inkjet)
4.1.3 Connectivity options (%) – wired vs. wireless adoption
4.1.4 Mobile POS printer adoption rate in retail and hospitality sectors (%)
4.2 Pricing & Revenue Statistics
4.2.1 Historical ASP (average selling price) trends for POS printers by type
4.2.2 Revenue contribution (%) by product type – thermal, impact, inkjet
4.2.3 Regional price variations (North America vs. Europe vs. APAC)
4.2.4 Average cost per transaction or operational cost for high-volume environments
4.3 Supply Chain & Manufacturing Data
4.3.1 Global production capacity (units/year) by major POS printer manufacturers
4.3.2 Regional manufacturing contribution (%) – APAC, North America, Europe
4.3.3 Import/export volume of POS printers by country/region
4.3.4 Average lead time for delivery of POS printers (weeks/months)
4.4 Customer & Market Behavior Metrics
4.4.1 Average replacement cycle for POS printers (years)
4.4.2 Brand preference and loyalty share (%) among end-users
4.4.3 Adoption rate (%) by industry – retail, hospitality, healthcare, entertainment
4.4.4 Customer satisfaction/reliability ratings (uptime, maintenance frequency)
4.5 Growth Drivers & Market Impact Metrics
4.5.1 Correlation of POS printer adoption with retail and e-commerce growth (%)
4.5.2 Percentage of cashless or contactless transactions driving demand
4.5.3 Adoption rate of cloud-based POS solutions (%)
4.5.4 Government or industry initiatives supporting digital payment infrastructure
4.6 Forecast Metrics
4.6.1 Projected unit sales (by product type or end-user segment) for 5–10 years
4.6.2 Revenue forecast by region and segment (USD million)
4.6.3 Market saturation estimates (%) for mature vs. emerging markets
4.6.4 Expected CAGR (%) for each segment and region over the forecast period
5. POS Printer Market Segmental Analysis & Forecast, By Type, 2021 – 2032, Value (Usd Billion)
5.1 Introduction
5.2 Thermal Printers
5.2.1 Key Trends
5.2.2 Market Size & Forecast, 2021 – 2032
5.3 Impact/Dot Matrix Printers
5.3.1 Key Trends
5.3.2 Market Size & Forecast, 2021 – 2032
5.4 Inkjet Printers
5.4.1 Key Trends
5.4.2 Market Size & Forecast, 2021 – 2032
6. POS Printer Market Segmental Analysis & Forecast, By Design, 2021 – 2032, Value (Usd Billion)
6.1 Introduction
6.2 Desktop POS Printers
6.2.1 Key Trends
6.2.2 Market Size & Forecast, 2021 – 2032
6.3 Mobile POS Printers
6.3.1 Key Trends
6.3.2 Market Size & Forecast, 2021 – 2032
6.4 Kiosk POS Printers
6.4.1 Key Trends
6.4.2 Market Size & Forecast, 2021 – 2032
7. POS Printer Market Segmental Analysis & Forecast, By Connectivity, 2021 – 2032, Value (Usd Billion)
7.1 Introduction
7.2 Wired
7.2.1 Key Trends
7.2.2 Market Size & Forecast, 2021 – 2032
7.3 Wireless
7.3.1 Key Trends
7.3.2 Market Size & Forecast, 2021 – 2032
8. POS Printer Market Segmental Analysis & Forecast, By End-User, 2021 – 2032, Value (Usd Billion)
8.1 Introduction
8.2 Hospitality
8.2.1 Key Trends
8.2.2 Market Size & Forecast, 2021 – 2032
8.3 Healthcare
8.3.1 Key Trends
8.3.2 Market Size & Forecast, 2021 – 2032
8.4 Retail
8.4.1 Key Trends
8.4.2 Market Size & Forecast, 2021 – 2032
8.5 Entertainment
8.5.1 Key Trends
8.5.2 Market Size & Forecast, 2021 – 2032
8.6 Others
8.6.1 Key Trends
8.6.2 Market Size & Forecast, 2021 – 2032
9. POS Printer Market Segmental Analysis & Forecast By Region, 2021 – 2025, Value (Usd Billion)
9.1 Introduction
9.2 North America
9.2.1 Key Trends
9.2.2 POS Printer Market Size & Forecast, By Type, 2021 – 2032
9.2.3 POS Printer Market Size & Forecast, By Design, 2021 – 2032
9.2.4 POS Printer Market Size & Forecast, By Connectivity, 2021 – 2032
9.2.5 POS Printer Market Size & Forecast, By End-User, 2021 – 2032
9.2.6 POS Printer Market Size & Forecast, By Country, 2021 – 2032
9.2.6.1 USA
9.2.6.1.1 POS Printer Market Size & Forecast, By Type, 2021 – 2032
9.2.6.1.2 POS Printer Market Size & Forecast, By Design, 2021 – 2032
9.2.6.1.3 POS Printer Market Size & Forecast, By Connectivity, 2021 – 2032
9.2.6.1.4 POS Printer Market Size & Forecast, By End-User, 2021 – 2032
9.2.6.2 Canada
9.2.6.2.1 POS Printer Market Size & Forecast, By Type, 2021 – 2032
9.2.6.2.2 POS Printer Market Size & Forecast, By Design, 2021 – 2032
9.2.6.2.3 POS Printer Market Size & Forecast, By Connectivity, 2021 – 2032
9.2.6.2.4 POS Printer Market Size & Forecast, By End-User, 2021 – 2032
9.3 Europe
9.3.1 Key Trends
9.3.2 POS Printer Market Size & Forecast, By Type, 2021 – 2032
9.3.3 POS Printer Market Size & Forecast, By Design, 2021 – 2032
9.3.4 POS Printer Market Size & Forecast, By Connectivity, 2021 – 2032
9.3.5 POS Printer Market Size & Forecast, By End-User, 2021 – 2032
9.3.6 POS Printer Market Size & Forecast, By Country, 2021 – 2032
9.3.6.1 Germany
9.3.6.1.1 POS Printer Market Size & Forecast, By Type, 2021 – 2032
9.3.6.1.2 POS Printer Market Size & Forecast, By Design, 2021 – 2032
9.3.6.1.3 POS Printer Market Size & Forecast, By Connectivity, 2021 – 2032
9.3.6.1.4 POS Printer Market Size & Forecast, By End-User, 2021 – 2032
9.3.6.2 UK
9.3.6.2.1 POS Printer Market Size & Forecast, By Type, 2021 – 2032
9.3.6.2.2 POS Printer Market Size & Forecast, By Design, 2021 – 2032
9.3.6.2.3 POS Printer Market Size & Forecast, By Connectivity, 2021 – 2032
9.3.6.2.4 POS Printer Market Size & Forecast, By End-User, 2021 – 2032
9.3.6.3 France
9.3.6.3.1 POS Printer Market Size & Forecast, By Type, 2021 – 2032
9.3.6.3.2 POS Printer Market Size & Forecast, By Design, 2021 – 2032
9.3.6.3.3 POS Printer Market Size & Forecast, By Connectivity, 2021 – 2032
9.3.6.3.4 POS Printer Market Size & Forecast, By End-User, 2021 – 2032
9.3.6.4 Italy
9.3.6.4.1 POS Printer Market Size & Forecast, By Type, 2021 – 2032
9.3.6.4.2 POS Printer Market Size & Forecast, By Design, 2021 – 2032
9.3.6.4.3 POS Printer Market Size & Forecast, By Connectivity, 2021 – 2032
9.3.6.4.4 POS Printer Market Size & Forecast, By End-User, 2021 – 2032
9.3.6.5 Spain
9.3.6.5.1 POS Printer Market Size & Forecast, By Type, 2021 – 2032
9.3.6.5.2 POS Printer Market Size & Forecast, By Design, 2021 – 2032
9.3.6.5.3 POS Printer Market Size & Forecast, By Connectivity, 2021 – 2032
9.3.6.5.4 POS Printer Market Size & Forecast, By End-User, 2021 – 2032
9.3.6.6 Russia
9.3.6.6.1 POS Printer Market Size & Forecast, By Type, 2021 – 2032
9.3.6.6.2 POS Printer Market Size & Forecast, By Design, 2021 – 2032
9.3.6.6.3 POS Printer Market Size & Forecast, By Connectivity, 2021 – 2032
9.3.6.6.4 POS Printer Market Size & Forecast, By End-User, 2021 – 2032
9.3.6.7 Poland
9.3.6.7.1 POS Printer Market Size & Forecast, By Type, 2021 – 2032
9.3.6.7.2 POS Printer Market Size & Forecast, By Design, 2021 – 2032
9.3.6.7.3 POS Printer Market Size & Forecast, By Connectivity, 2021 – 2032
9.3.6.7.4 POS Printer Market Size & Forecast, By End-User, 2021 – 2032
9.3.6.8 Rest of Europe
9.3.6.8.1 POS Printer Market Size & Forecast, By Type, 2021 – 2032
9.3.6.8.2 POS Printer Market Size & Forecast, By Design, 2021 – 2032
9.3.6.8.3 POS Printer Market Size & Forecast, By Connectivity, 2021 – 2032
9.3.6.8.4 POS Printer Market Size & Forecast, By End-User, 2021 – 2032
9.4 Asia-Pacific
9.4.1 Key Trends
9.4.2 POS Printer Market Size & Forecast, By Type, 2021 – 2032
9.4.3 POS Printer Market Size & Forecast, By Design, 2021 – 2032
9.4.4 POS Printer Market Size & Forecast, By Connectivity, 2021 – 2032
9.4.5 POS Printer Market Size & Forecast, By End-User, 2021 – 2032
9.4.6 POS Printer Market Size & Forecast, By Country, 2021 – 2032
9.4.6.1 China
9.4.6.1.1 POS Printer Market Size & Forecast, By Type, 2021 – 2032
9.4.6.1.2 POS Printer Market Size & Forecast, By Design, 2021 – 2032
9.4.6.1.3 POS Printer Market Size & Forecast, By Connectivity, 2021 – 2032
9.4.6.1.4 POS Printer Market Size & Forecast, By End-User, 2021 – 2032
9.4.6.2 India
9.4.6.2.1 POS Printer Market Size & Forecast, By Type, 2021 – 2032
9.4.6.2.2 POS Printer Market Size & Forecast, By Design, 2021 – 2032
9.4.6.2.3 POS Printer Market Size & Forecast, By Connectivity, 2021 – 2032
9.4.6.2.4 POS Printer Market Size & Forecast, By End-User, 2021 – 2032
9.4.6.3 Japan
9.4.6.3.1 POS Printer Market Size & Forecast, By Type, 2021 – 2032
9.4.6.3.2 POS Printer Market Size & Forecast, By Design, 2021 – 2032
9.4.6.3.3 POS Printer Market Size & Forecast, By Connectivity, 2021 – 2032
9.4.6.3.4 POS Printer Market Size & Forecast, By End-User, 2021 – 2032
9.4.6.4 South Korea
9.4.6.4.1 POS Printer Market Size & Forecast, By Type, 2021 – 2032
9.4.6.4.2 POS Printer Market Size & Forecast, By Design, 2021 – 2032
9.4.6.4.3 POS Printer Market Size & Forecast, By Connectivity, 2021 – 2032
9.4.6.4.4 POS Printer Market Size & Forecast, By End-User, 2021 – 2032
9.4.6.5 Australia
9.4.6.5.1 POS Printer Market Size & Forecast, By Type, 2021 – 2032
9.4.6.5.2 POS Printer Market Size & Forecast, By Design, 2021 – 2032
9.4.6.5.3 POS Printer Market Size & Forecast, By Connectivity, 2021 – 2032
9.4.6.5.4 POS Printer Market Size & Forecast, By End-User, 2021 – 2032
9.4.6.6 ASEAN Countries
9.4.6.6.1 POS Printer Market Size & Forecast, By Type, 2021 – 2032
9.4.6.6.2 POS Printer Market Size & Forecast, By Design, 2021 – 2032
9.4.6.6.3 POS Printer Market Size & Forecast, By Connectivity, 2021 – 2032
9.4.6.6.4 POS Printer Market Size & Forecast, By End-User, 2021 – 2032
9.4.6.7 Rest of Asia-Pacific
9.4.6.7.1 POS Printer Market Size & Forecast, By Type, 2021 – 2032
9.4.6.7.2 POS Printer Market Size & Forecast, By Design, 2021 – 2032
9.4.6.7.3 POS Printer Market Size & Forecast, By Connectivity, 2021 – 2032
9.4.6.7.4 POS Printer Market Size & Forecast, By End-User, 2021 – 2032
9.5 Latin America
9.5.1 Key Trends
9.5.2 POS Printer Market Size & Forecast, By Type, 2021 – 2032
9.5.3 POS Printer Market Size & Forecast, By Design, 2021 – 2032
9.5.4 POS Printer Market Size & Forecast, By Connectivity, 2021 – 2032
9.5.5 POS Printer Market Size & Forecast, By End-User, 2021 – 2032
9.5.6 POS Printer Market Size & Forecast, By Country, 2021 – 2032
9.5.6.1 Brazil
9.5.6.1.1 POS Printer Market Size & Forecast, By Type, 2021 – 2032
9.5.6.1.2 POS Printer Market Size & Forecast, By Design, 2021 – 2032
9.5.6.1.3 POS Printer Market Size & Forecast, By Connectivity, 2021 – 2032
9.5.6.1.4 POS Printer Market Size & Forecast, By End-User, 2021 – 2032
9.5.6.2 Argentina
9.5.6.2.1 POS Printer Market Size & Forecast, By Type, 2021 – 2032
9.5.6.2.2 POS Printer Market Size & Forecast, By Design, 2021 – 2032
9.5.6.2.3 POS Printer Market Size & Forecast, By Connectivity, 2021 – 2032
9.5.6.2.4 POS Printer Market Size & Forecast, By End-User, 2021 – 2032
9.5.6.3 Mexico
9.5.6.3.1 POS Printer Market Size & Forecast, By Type, 2021 – 2032
9.5.6.3.2 POS Printer Market Size & Forecast, By Design, 2021 – 2032
9.5.6.3.3 POS Printer Market Size & Forecast, By Connectivity, 2021 – 2032
9.5.6.3.4 POS Printer Market Size & Forecast, By End-User, 2021 – 2032
9.5.6.4 Colombia
9.5.6.4.1 POS Printer Market Size & Forecast, By Type, 2021 – 2032
9.5.6.4.2 POS Printer Market Size & Forecast, By Design, 2021 – 2032
9.5.6.4.3 POS Printer Market Size & Forecast, By Connectivity, 2021 – 2032
9.5.6.4.4 POS Printer Market Size & Forecast, By End-User, 2021 – 2032
9.5.6.5 Rest of Latin America
9.5.6.5.1 POS Printer Market Size & Forecast, By Type, 2021 – 2032
9.5.6.5.2 POS Printer Market Size & Forecast, By Design, 2021 – 2032
9.5.6.5.3 POS Printer Market Size & Forecast, By Connectivity, 2021 – 2032
9.5.6.5.4 POS Printer Market Size & Forecast, By End-User, 2021 – 2032
9.6 Middle East & Africa
9.6.1 Key Trends
9.6.2 POS Printer Market Size & Forecast, By Type, 2021 – 2032
9.6.3 POS Printer Market Size & Forecast, By Design, 2021 – 2032
9.6.4 POS Printer Market Size & Forecast, By Connectivity, 2021 – 2032
9.6.5 POS Printer Market Size & Forecast, By End-User, 2021 – 2032
9.6.6 POS Printer Market Size & Forecast, By Country, 2021 – 2032
9.6.6.1 UAE
9.6.6.1.1 POS Printer Market Size & Forecast, By Type, 2021 – 2032
9.6.6.1.2 POS Printer Market Size & Forecast, By Design, 2021 – 2032
9.6.6.1.3 POS Printer Market Size & Forecast, By Connectivity, 2021 – 2032
9.6.6.1.4 POS Printer Market Size & Forecast, By End-User, 2021 – 2032
9.6.6.2 Saudi Arabia
9.6.6.2.1 POS Printer Market Size & Forecast, By Type, 2021 – 2032
9.6.6.2.2 POS Printer Market Size & Forecast, By Design, 2021 – 2032
9.6.6.2.3 POS Printer Market Size & Forecast, By Connectivity, 2021 – 2032
9.6.6.2.4 POS Printer Market Size & Forecast, By End-User, 2021 – 2032
9.6.6.3 Qatar
9.6.6.3.1 POS Printer Market Size & Forecast, By Type, 2021 – 2032
9.6.6.3.2 POS Printer Market Size & Forecast, By Design, 2021 – 2032
9.6.6.3.3 POS Printer Market Size & Forecast, By Connectivity, 2021 – 2032
9.6.6.3.4 POS Printer Market Size & Forecast, By End-User, 2021 – 2032
9.6.6.4 Egypt
9.6.6.4.1 POS Printer Market Size & Forecast, By Type, 2021 – 2032
9.6.6.4.2 POS Printer Market Size & Forecast, By Design, 2021 – 2032
9.6.6.4.3 POS Printer Market Size & Forecast, By Connectivity, 2021 – 2032
9.6.6.4.4 POS Printer Market Size & Forecast, By End-User, 2021 – 2032
9.6.6.5 South Africa
9.6.6.5.1 POS Printer Market Size & Forecast, By Type, 2021 – 2032
9.6.6.5.2 POS Printer Market Size & Forecast, By Design, 2021 – 2032
9.6.6.5.3 POS Printer Market Size & Forecast, By Connectivity, 2021 – 2032
9.6.6.5.4 POS Printer Market Size & Forecast, By End-User, 2021 – 2032
9.6.6.6 Rest of Middle East & Africa
9.6.6.6.1 POS Printer Market Size & Forecast, By Type, 2021 – 2032
9.6.6.6.2 POS Printer Market Size & Forecast, By Design, 2021 – 2032
9.6.6.6.3 POS Printer Market Size & Forecast, By Connectivity, 2021 – 2032
9.6.6.6.4 POS Printer Market Size & Forecast, By End-User, 2021 – 2032
10. Competitive Landscape
10.1 Key Players' Positioning
10.2 Competitive Developments
10.2.1 Key Strategies Adopted (%), By Key Players, 2024
10.2.2 Year-Wise Strategies & Development, 2021 – 2025
10.2.3 Number Of Strategies Adopted By Key Players, 2024
10.3 Market Share Analysis, 2024
10.4 Product/Service & Application Benchmarking
10.4.1 Product/Service Specifications & Features By Key Players
10.4.2 Product/Service Heatmap By Key Players
10.4.3 Application Heatmap By Key Players
10.5 Industry Start-Up & Innovation Landscape
10.6 Key Company Profiles
10.6.1 Epson
10.6.1.1 Company Overview & Snapshot
10.6.1.2 Product/Service Portfolio
10.6.1.3 Key Company Financials
10.6.1.4 SWOT Analysis
10.6.2 Star Micronics
10.6.2.1 Company Overview & Snapshot
10.6.2.2 Product/Service Portfolio
10.6.2.3 Key Company Financials
10.6.2.4 SWOT Analysis
10.6.3 BIXOLON Co., Ltd.
10.6.3.1 Company Overview & Snapshot
10.6.3.2 Product/Service Portfolio
10.6.3.3 Key Company Financials
10.6.3.4 SWOT Analysis
10.6.4 Zebra Technologies
10.6.4.1 Company Overview & Snapshot
10.6.4.2 Product/Service Portfolio
10.6.4.3 Key Company Financials
10.6.4.4 SWOT Analysis
10.6.5 TSC Auto ID Technology Co., Ltd.
10.6.5.1 Company Overview & Snapshot
10.6.5.2 Product/Service Portfolio
10.6.5.3 Key Company Financials
10.6.5.4 SWOT Analysis
10.6.6 Honeywell International Inc.
10.6.6.1 Company Overview & Snapshot
10.6.6.2 Product/Service Portfolio
10.6.6.3 Key Company Financials
10.6.6.4 SWOT Analysis
10.6.7 Citizen Systems
10.6.7.1 Company Overview & Snapshot
10.6.7.2 Product/Service Portfolio
10.6.7.3 Key Company Financials
10.6.7.4 SWOT Analysis
10.6.8 NCR Corporation
10.6.8.1 Company Overview & Snapshot
10.6.8.2 Product/Service Portfolio
10.6.8.3 Key Company Financials
10.6.8.4 SWOT Analysis
10.6.9 HP Inc.
10.6.9.1 Company Overview & Snapshot
10.6.9.2 Product/Service Portfolio
10.6.9.3 Key Company Financials
10.6.9.4 SWOT Analysis
10.6.10 Canon Inc.
10.6.10.1 Company Overview & Snapshot
10.6.10.2 Product/Service Portfolio
10.6.10.3 Key Company Financials
10.6.10.4 SWOT Analysis
10.6.11 Brother Industries, Ltd.
10.6.11.1 Company Overview & Snapshot
10.6.11.2 Product/Service Portfolio
10.6.11.3 Key Company Financials
10.6.11.4 SWOT Analysis
10.6.12 Ricoh Company, Ltd.
10.6.12.1 Company Overview & Snapshot
10.6.12.2 Product/Service Portfolio
10.6.12.3 Key Company Financials
10.6.12.4 SWOT Analysis
10.6.13 Lexmark International
10.6.13.1 Company Overview & Snapshot
10.6.13.2 Product/Service Portfolio
10.6.13.3 Key Company Financials
10.6.13.4 SWOT Analysis
10.6.14 Able Systems Limited
10.6.14.1 Company Overview & Snapshot
10.6.14.2 Product/Service Portfolio
10.6.14.3 Key Company Financials
10.6.14.4 SWOT Analysis
10.6.15 Nippon Primex Inc.
10.6.15.1 Company Overview & Snapshot
10.6.15.2 Product/Service Portfolio
10.6.15.3 Key Company Financials
10.6.15.4 SWOT Analysis
10.6.16 SNBC
10.6.16.1 Company Overview & Snapshot
10.6.16.2 Product/Service Portfolio
10.6.16.3 Key Company Financials
10.6.16.4 SWOT Analysis
10.6.17 Custom SPA
10.6.17.1 Company Overview & Snapshot
10.6.17.2 Product/Service Portfolio
10.6.17.3 Key Company Financials
10.6.17.4 SWOT Analysis
10.6.18 Oki Data America
10.6.18.1 Company Overview & Snapshot
10.6.18.2 Product/Service Portfolio
10.6.18.3 Key Company Financials
10.6.18.4 SWOT Analysis
10.6.19 Pertech Industries
10.6.19.1 Company Overview & Snapshot
10.6.19.2 Product/Service Portfolio
10.6.19.3 Key Company Financials
10.6.19.4 SWOT Analysis
10.6.20 SEWOO
10.6.20.1 Company Overview & Snapshot
10.6.20.2 Product/Service Portfolio
10.6.20.3 Key Company Financials
10.6.20.4 SWOT Analysis
11. Analyst Recommendations
11.1 SNS Insider Opportunity Map
11.2 Industry Low-Hanging Fruit Assessment
11.3 Market Entry & Growth Strategy
11.4 Analyst Viewpoint & Suggestions On Market Growth
12. Assumptions
13. Disclaimer
14. Appendix
14.1 List Of Tables
14.2 List Of Figures
Key Segments:
By Type
-
Thermal Printers
-
Impact/Dot Matrix Printers
-
Inkjet Printers
By Design
-
Desktop POS Printers
-
Mobile POS Printers
-
Kiosk POS Printers
By Connectivity
-
Wired
-
Wireless
By End-User
-
Hospitality
-
Healthcare
-
Retail
-
Entertainment
-
Others
Request for Segment Customization as per your Business Requirement: Segment Customization Request
Regional Coverage:
North America
-
US
-
Canada
Europe
-
Germany
-
UK
-
France
-
Italy
-
Spain
-
Russia
-
Poland
-
Rest of Europe
Asia Pacific
-
China
-
India
-
Japan
-
South Korea
-
Australia
-
ASEAN Countries
-
Rest of Asia Pacific
Middle East & Africa
-
UAE
-
Saudi Arabia
-
Qatar
-
South Africa
-
Rest of Middle East & Africa
Latin America
-
Brazil
-
Argentina
-
Mexico
-
Colombia
-
Rest of Latin America
Request for Country Level Research Report: Country Level Customization Request
Available Customization
With the given market data, SNS Insider offers customization as per the company’s specific needs. The following customization options are available for the report:
-
Detailed Volume Analysis
-
Criss-Cross segment analysis (e.g. Product X Application)
-
Competitive Product Benchmarking
-
Geographic Analysis
-
Additional countries in any of the regions
-
Customized Data Representation
-
Detailed analysis and profiling of additional market players
An accurate research report requires proper strategizing as well as implementation. There are multiple factors involved in the completion of good and accurate research report and selecting the best methodology to compete the research is the toughest part. Since the research reports we provide play a crucial role in any company’s decision-making process, therefore we at SNS Insider always believe that we should choose the best method which gives us results closer to reality. This allows us to reach at a stage wherein we can provide our clients best and accurate investment to output ratio.
Each report that we prepare takes a timeframe of 350-400 business hours for production. Starting from the selection of titles through a couple of in-depth brain storming session to the final QC process before uploading our titles on our website we dedicate around 350 working hours. The titles are selected based on their current market cap and the foreseen CAGR and growth.
The 5 steps process:
Step 1: Secondary Research:
Secondary Research or Desk Research is as the name suggests is a research process wherein, we collect data through the readily available information. In this process we use various paid and unpaid databases which our team has access to and gather data through the same. This includes examining of listed companies’ annual reports, Journals, SEC filling etc. Apart from this our team has access to various associations across the globe across different industries. Lastly, we have exchange relationships with various university as well as individual libraries.

Step 2: Primary Research
When we talk about primary research, it is a type of study in which the researchers collect relevant data samples directly, rather than relying on previously collected data. This type of research is focused on gaining content specific facts that can be sued to solve specific problems. Since the collected data is fresh and first hand therefore it makes the study more accurate and genuine.
We at SNS Insider have divided Primary Research into 2 parts.
Part 1 wherein we interview the KOLs of major players as well as the upcoming ones across various geographic regions. This allows us to have their view over the market scenario and acts as an important tool to come closer to the accurate market numbers. As many as 45 paid and unpaid primary interviews are taken from both the demand and supply side of the industry to make sure we land at an accurate judgement and analysis of the market.
This step involves the triangulation of data wherein our team analyses the interview transcripts, online survey responses and observation of on filed participants. The below mentioned chart should give a better understanding of the part 1 of the primary interview.

Part 2: In this part of primary research the data collected via secondary research and the part 1 of the primary research is validated with the interviews from individual consultants and subject matter experts.
Consultants are those set of people who have at least 12 years of experience and expertise within the industry whereas Subject Matter Experts are those with at least 15 years of experience behind their back within the same space. The data with the help of two main processes i.e., FGDs (Focused Group Discussions) and IDs (Individual Discussions). This gives us a 3rd party nonbiased primary view of the market scenario making it a more dependable one while collation of the data pointers.
Step 3: Data Bank Validation
Once all the information is collected via primary and secondary sources, we run that information for data validation. At our intelligence centre our research heads track a lot of information related to the market which includes the quarterly reports, the daily stock prices, and other relevant information. Our data bank server gets updated every fortnight and that is how the information which we collected using our primary and secondary information is revalidated in real time.

Step 4: QA/QC Process
After all the data collection and validation our team does a final level of quality check and quality assurance to get rid of any unwanted or undesired mistakes. This might include but not limited to getting rid of the any typos, duplication of numbers or missing of any important information. The people involved in this process include technical content writers, research heads and graphics people. Once this process is completed the title gets uploader on our platform for our clients to read it.
Step 5: Final QC/QA Process:
This is the last process and comes when the client has ordered the study. In this process a final QA/QC is done before the study is emailed to the client. Since we believe in giving our clients a good experience of our research studies, therefore, to make sure that we do not lack at our end in any way humanly possible we do a final round of quality check and then dispatch the study to the client.