Thermal Printing Market Report Scope & Overview:

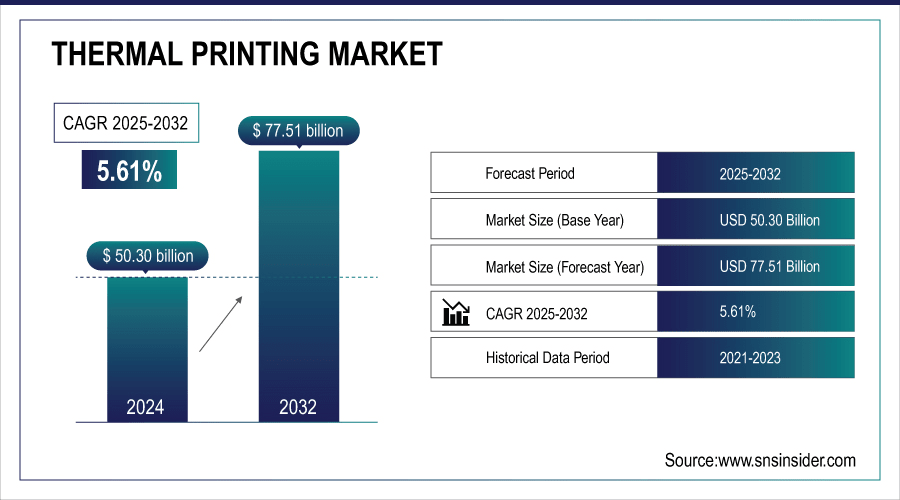
The Thermal Printing Market size was valued at USD 50.30 Billion in 2024 and is projected to reach USD 77.51 Billion by 2032, growing at a CAGR of 5.61% during 2025-2032.

The global thermal printing market analysis gives a clear segmentation by product type, application, technology, offering, and region, allowing for clarity about the growth patterns. It elucidates market dynamics, such as drivers, restraints, opportunities, and challenges, along with reliable statistics. The report highlights competitive scenario, pricing dynamics, supply-demand balance, technological progress and sustainability initiatives. Collectively, these elements provide a broad perspective of the thermal printing industry from a throughput and broader view, aiding the stakeholders in improving the identified opportunities emerging from the thermal printing industry and driving the strategic decision-making process.

On May 29, 2025, Koehler Paper’s Blue4est® Pro linerless labels, chemical-free and waste-reducing, were certified for Toshiba Tec Singapore’s all-in-one printer (TRST-L1), enhancing sustainability and efficiency in retail and logistics.
Thermal Printing Market Trends:

  • Rising e-commerce and logistics shipments by companies such as Amazon and FedEx significantly increase global demand for thermal printing systems.

  • Thermal printers offer speed, precision, and cost-effectiveness, making them essential for high-volume labeling, barcoding, and receipts in logistics.

  • Thermal printing is a backbone for retail and delivery ecosystems, enabling POS transactions, inventory management, and efficient order tracking.

  • Environmental regulations drive manufacturers to develop recyclable papers, BPA-free coatings, and energy-efficient printers, supporting sustainability-focused market growth.

  • Europe and North America witness faster adoption of green printing technologies, influenced by climate change concerns and compliance requirements.

  • Eco-friendly printing innovations ensure regulatory compliance while providing manufacturers a competitive advantage and long-term sustainable growth opportunities.

Thermal Printing Market Report Highlights:

The U.S. Thermal Printing Market size was valued at USD 11.33 Billion in 2024 and is projected to reach USD 17.22 Billion by 2032, growing at a CAGR of 5.42% during 2025-2032. The U.S. market is witnessing substantial growth owing to the fast expansion of retail POS systems, booming e-commerce logistics, and the increasing demand for labeling and patient tracking in the healthcare domain. Increase in adoption is also supported by the digitalization of receipts, inventory management systems, and compliance with pharmaceutical regulations. With these factors, coupled with the rise of automation and energy-efficient solutions, the thermal printing market continues to grow organically in various industries across the U.S.
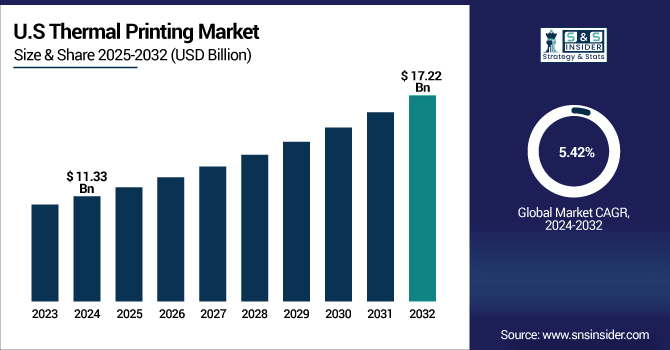
Thermal printing market trends across the globe are pointed to stable and steady growth, with the support of retail penetration, logistics automation, healthcare labeling, digital receipts, and other trends to adopt eco-friendly, environmental protection printing solutions.

Thermal Printing Market Growth Drivers:

  • Expansion of E-Commerce and Logistics Industry are Creating Unprecedented Demand for Thermal Printing Solutions Across Multiple Applications Globally

Growing demand from e-commerce and logistics is a key factor driving the growth of thermal printing systems. Millions of packages are shipped each day, and smooth supply chain operations have made labeling efficient to become a must-have. Unlike musical printers, thermal printers are preferred for speed, precision, and economical cost, allowing thermal printers to be used for shipping labels, barcodes, and receipts. Thermal printing is widely used by companies, such as FedEx and Amazon which handle large volumes of operations. This growing logistics ecosystem is also a direct catalyst for uptake, making thermal printing an anchor technology for global retail and delivery.

August 6, 2025, Kyocera unveiled its groundbreaking TPA Series thermal printhead, designed specifically for high-speed POS printing at 350 mm/sec, the fastest in the industry, without compromising clarity or quality. It offers improved heat conduction and expanded mounting tolerance for stable performance across varied media types, along with robust wear and corrosion resistance built on Kyocera’s advanced film technology.

Thermal Printing Market Restraints:

  • High Dependency on Thermal Paper Costs and Volatile Pricing Trends Limiting Overall Growth of the Thermal Printing Market Globally

Thermal printing technology is highly dependent on thermal paper as a material, and indeed, the costs of raw materials and the supply chain for this product are highly variable. The fluctuation in thermal paper prices affect printers, but their end-user also comprises of cut costs in profit margin. Moreover, increasing environmental concerns regarding the chemicals used to coat thermal papers make its practicality more complicated. Such cost variations result in higher operational costs for end-users in retail and logistics. The reliance on consumables and the variation in their prices continue to be a significant limitation, which may decelerate market penetration in cost-sensitive end-user industries and emerging economies.

Thermal Printing Market Opportunities:

  • Growing Demand for Eco-Friendly Printing Solutions Driving Innovation in Sustainable Thermal Printing Materials and Energy-Efficient Devices

Thermal printing manufacturers have numerous opportunities to come up with green solutions, due to sustainability initiatives. Given the growing apprehension about the chemical-laden thermal papers and the government limitations relating to the thermal paper market, the organizations are able to treat recyclable paper, BPA-free, and energy-efficient printers. Due to the increasing concerns regarding climate change, customers especially in Europe and North America are opting for sustainable alternatives for labeling and packaging. The boom of the green printing technologies offers an added degree of compensation to manufacturers that invest in these solutions with regards to the local and national regulations on pollution and increasing demand from consumers. Such a transition would not just contribute to the environment but would also help in providing a niche among competitors for long-term growth opportunities.

April 16, 2025, a major U.S. report revealed that thermal receipt papers from over 50 major retailers, including Burger King and Subway, contain BPS at levels exceeding California’s Prop 65 safety limits, prompting stricter scrutiny of “BPA-free” labels and encouraging demand for safer alternatives.

Key Thermal Printing Market Segment Analysis:

  • By product type, POS printers led the market with ~36% share in 2024, while mobile printers are expected to be the fastest growing segment during 2025–2032, registering a CAGR of 7.14%.

  • By application, the retail sector dominated the market with ~33.90% share in 2024, whereas transportation & logistics is projected to grow at the fastest pace with a CAGR of 6.88% over 2025–2032.

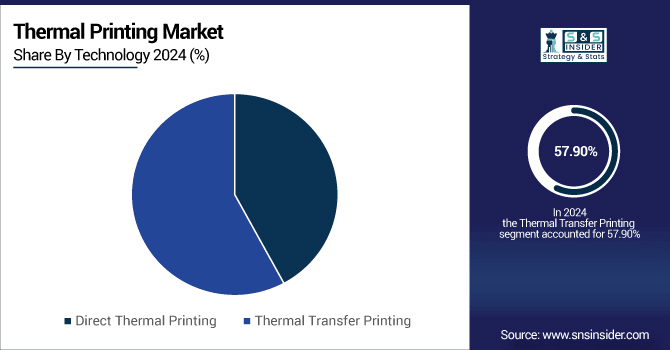
  • By technology, thermal transfer printing accounted for the largest share of ~57.90% in 2024, while direct thermal printing is anticipated to witness the fastest growth at a CAGR of 6.22% during the forecast period 2025–2032.

  • By offering, supplies held the largest share of ~53.80% in 2024 and are also expected to register the fastest growth, expanding at a CAGR of 5.71% during 2025–2032.

By Product Type, POS Printers Leads Market While Mobile Printers Registers Fastest Growth

POS Printers held the largest share of about 36% of the Thermal Printing Market in 2024. This domination is due to their extensive use in retail and hospitality for billing, receipts and transaction documents. Due to their reliability, speed, and easy integration to POS systems, they remain a significant part of the customer experience. The growth of the technologic atmosphere is supported by The NCR Corporation by providing multiple POS printer options. The fastest growth is anticipated for the Mobile Printers segment which is predicted to grow at a CAGR of over 7.14% during 2024–2032. Expansion is propelled by booking uptake inside the settlement, storage, and on-location administrations where auto taking care of and assessments on the fly smoothen out tasks.

By Application, Retail Dominate While Transportation and Logistics Shows Rapid Growth

In 2024, Retail segment held the largest revenue share of approximately 33.90% of Thermal Printing Market. POS application, product labeling, and inventory management systems in supermarket, convenience store, and e-commerce store indicates the leadership of this area. Companies such as Toshiba Tec Corporation have made the deployments of retail-based thermal printer globally stronger with a solid product portfolio. Transportation & Logistics segment will grow with a highest CAGR of ~6.88% during 2024 - 2032. Logistics is rapidly adopting AI barcode printers due to increased e-commerce shipments, automation of warehouses, and the need for efficient labeling and tracking.

By Technology, Thermal Transfer Printing Lead While Direct Thermal Printing Registers Fastest Growth

The Thermal Printing Market was led by the Thermal Transfer Printing segment, which held a revenue share of around 57.90% in 2024. Its scratch and chemical resistance, combined with its ability to last for years, is what makes it the optimal material for industrial, healthcare and compliance-oriented labels. While companies, such as SATO Holdings Corporation have been developing thermal transfer printer solutions, assisting expansion. The Direct Thermal Printing is anticipated to grow at the fastest CAGR of approximately 6.22% during the forecast period over 2024-2032. The growing adoption of thermal printers owing to their cost-effectiveness and convenience in printing receipts, tickets, and shipping labels, is expected to fuel the demand in retail and e-commerce logistics market.
By Offering, Supplies Lead and Also Grows the Fastest

In thermal printing market, the supplies segment is expected to have the highest revenue share of around 53.80% in 2024. The controllership in demand for labels, ribbons, and papers provides a constant flow of revenue for suppliers from across the domain. Suppliers have a sturdy position as pacemakers in this space and companies, such as Avery Dennison Corporation have leading backing for supply chain molecule in labeling solutions. Growing up with CAGR of 5.71% during the forecasted period of 2024–2032 is also supplies segment. Growing use of thermal printing in retail, healthcare and logistics sectors to support rising consumption makes supplies the biggest and fastest growing part of thermal printing revenues.

Asia Pacific Thermal Printing Market Insights:

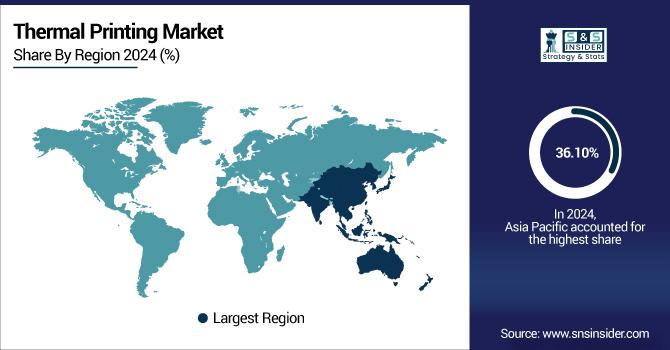
In 2024, Asia Pacific led the revenue share in the Thermal Printing Market with around 36.10% and is further anticipated to experience the fastest growth with over 6.59% CAGR during 2024–2032. Excellent adoption in retail, e-commerce logistics, and industrial manufacturing sector in China, India, and Japan further strengthens its lead.
North America Thermal Printing Market Insights:

North America accounts for a significant share as it is widely adopted among retail, healthcare, and logistics market verticals. Advanced infrastructure, higher e-commerce penetration, and regulatory compliance necessities in pharmaceuticals drive acquisition in the region.

Europe Thermal Printing Market Insights:

The Europe region is a strong market for thermal printing due to fast adoption in retail, transportation, and healthcare and pharmaceuticals. The increasing footprint of sustainable printing products heavily impacts plastics market size, particularly recyclable and BPA-free papers. Tight government regulation regarding labeling and packaging continues to fuel adoption.

Latin America (LATAM) and Middle East & Africa (MEA) Thermal Printing Market Insights:

Middle East & Africa thermal printing market is majorly driven by UAE, Saudi Arabia, and South Africa, backed by the retail and logistics expansion across the respective region. Brazil and Argentina drive e-commerce and POS and systems growth in Latin America, while healthcare and labeling needs drive demand in both emerging regions.

Thermal Printing Market Competitive Landscape:

Zebra Technologies is a global leader in thermal printing, offering innovative solutions for industries such as retail, logistics, manufacturing, and healthcare. ZD421 Desktop Printer, which are fast, reliable high-quality label, and barcode printing for retail and office use. QLN420 Mobile Printer, a rugged, wireless mobility for warehouses and delivery applications. Zebra, experts in IoT, RFID and automation-ready technologies, provide true supply chain management, enabling businesses, from Amazon to FedEx, with dependable, scalable, and smart technologies for printing.

  • In 2025, Honeywell introduced a cloud-based thermal printing solution that allows enterprises to remotely manage and monitor printer performance, boosting operational efficiency in healthcare, transportation, and other industries.

Honeywell International is a global leader in technology known for its thermal printing solutions for logistics, healthcare, and retail industries. PC42t Plus Desktop Printer is compact and great entry-level solutions for small-scale barcode and label printing, while RP4e Mobile Printer is rugged, and durable to withstand tough field service and logistics applications. Honeywell brings all of these together with connectivity, ruggedness, and automation, ensuring enterprises achieve efficient, compliant, and sustainable performance, with durable, intuitive solutions trusted by the largest enterprises globally.

  • In March 2025, Honeywell introduced a cloud-based thermal printing solution that enables enterprises, especially in healthcare and transportation, to remotely monitor and manage printer performance, enhancing operational efficiency.

Thermal Printing Market Key Players:

Some of the Thermal Printing Market Companies are:

  • Zebra Technologies Corporation

  • Honeywell International Inc.

  • Seiko Epson Corporation

  • Toshiba Tec Corporation

  • BIXOLON Co., Ltd.

  • SATO Holdings Corporation

  • TSC Auto ID Technology Co., Ltd.

  • Star Micronics Co., Ltd.

  • Avery Dennison Corporation

  • NCR Corporation

  • Fujitsu Limited

  • Brother Industries, Ltd.

  • Printronix Auto ID

  • Citizen Systems Japan Co., Ltd.

  • Datamax-O’Neil (acquired by Honeywell)

  • Shandong New Beiyang Information Technology Co., Ltd. (SNBC)

  • Custom S.p.A.

  • CognitiveTPG

  • Oki Electric Industry Co., Ltd.

  • HP Inc.

Thermal Printing Market Report Scope:

Report Attributes Details
Market Size in 2024 USD 50.30 Billion
Market Size by 2032 USD 77.51 Millon
CAGR CAGR of 5.61% From 2025 to 2032
Base Year 2024
Forecast Period 2025-2032
Historical Data 2021-2023
Report Scope & Coverage Market Size, Segments Analysis, Competitive  Landscape, Regional Analysis, DROC & SWOT Analysis, Forecast Outlook
Key Segments • By Product Type (Desktop Printers, Mobile Printers, Industrial Printers and POS Printers)
• By Application (Retail, Healthcare & Hospitality, Transportation & Logistics, Manufacturing and Government)
• By Technology (Direct Thermal Printing and Thermal Transfer Printing)
• By Offering (Printers and Supplies)
Regional Analysis/Coverage North America (US, Canada, Mexico), Europe (Germany, France, UK, Italy, Spain, Poland, Turkey, Rest of Europe), Asia Pacific (China, India, Japan, South Korea, Singapore, Australia, Taiwan,  Rest of Asia Pacific), Middle East & Africa (UAE, Saudi Arabia, Qatar, South Africa, Rest of Middle East & Africa), Latin America (Brazil, Argentina, Rest of Latin America)
Company Profiles Zebra Technologies Corporation, Honeywell International Inc., Seiko Epson Corporation, Toshiba Tec Corporation, BIXOLON Co., Ltd., SATO Holdings Corporation, TSC Auto ID Technology Co., Ltd., Star Micronics Co., Ltd., Avery Dennison Corporation, NCR Corporation, Fujitsu Limited, Brother Industries, Ltd., Printronix Auto ID, Citizen Systems Japan Co., Ltd., Datamax-O’Neil, Shandong New Beiyang Information Technology Co., Ltd. (SNBC), Custom S.p.A., CognitiveTPG, Oki Electric Industry Co., Ltd. and HP Inc.

Table Of Contents

1. Introduction

1.1 Market Definition & Scope

 1.2 Research Assumptions & Abbreviations

 1.3 Research Methodology

2. Executive Summary

2.1 Market Snapshot

 2.2 Market Absolute $ Opportunity Assessment & Y-o-Y Analysis, 2021–2032

 2.3 Market Size & Forecast, By Segmentation, 2021–2032

  2.3.1 Market Size By Product Type

  2.3.2 Market Size By Application

         2.3.3 Market Size By Technology

         2.3.4 Market Size By Offering

 2.4 Market Share & Bps Analysis By Region, 2024

 2.5 Industry Growth Scenarios – Conservative, Likely & Optimistic

 2.6 Industry CxO’s Perspective

3. Market Overview

3.1 Market Dynamics

  3.1.1 Drivers

  3.1.2 Restraints

  3.1.3 Opportunities

  3.1.4 Key Market Trends

 3.2 Industry PESTLE Analysis

 3.3 Key Industry Forces (Porter’s) Impacting Market Growth

 3.4 Industry Supply Chain Analysis

  3.4.1 Raw Material Suppliers

  3.4.2 Manufacturers

  3.4.3 Distributors/Suppliers

  3.4.4 Customers/End-Users

 3.5 Industry Life Cycle Assessment

 3.6 Parent Market Overview

 3.7 Market Risk Assessment

4. Statistical Insights & Trends Reporting

4.1 Pricing Analysis & Forecast

4.1.1 Overview

4.1.2 Pricing Analysis & Forecast By Product

4.1.3 Price Benchmarking By Key Players

4.2 Usage Statistics

4.2.1 Overview

4.2.2 Usage Trends By Application

4.2.3 Print Volume Analysis By Printer Type

4.2.4 Adoption Rate Across End-User Industries

4.3 R&D Investment Trends

4.3.1 Overview

4.3.2 R&D Spending By Leading Players

4.3.3 Focus Areas of Innovation (Hardware, Supplies, Connectivity)

4.3.4 Emerging Technology Development

4.4 Regulatory & Compliance Statistics

4.4.1 Overview

4.4.2 Regulatory Trends By Key Regions

4.4.3 Compliance Requirements By Application (Retail, Healthcare, Logistics)

4.4.4 Impact of Labeling Standards on Market Growth

4.5 Energy Efficiency & Sustainability Data

4.5.1 Overview

4.5.2 Adoption of Eco-Friendly Thermal Papers & Ribbons

4.5.3 Energy Consumption Comparison By Printer Type

4.5.4 Recycling & Waste Reduction Initiatives

5. Thermal Printing Market Segmental Analysis & Forecast, By Product Type, 2021 – 2032, Value (Usd Billion)

5.1 Introduction

 5.2 Desktop Printers

  5.2.1 Key Trends

  5.2.2 Market Size & Forecast, 2021 – 2032

 5.3 Mobile Printers

  5.3.1 Key Trends

  5.3.2 Market Size & Forecast, 2021 – 2032

 5.4 Industrial Printers

  5.4.1 Key Trends

  5.4.2 Market Size & Forecast, 2021 – 2032

 5.5 POS Printers

  5.5.1 Key Trends

  5.5.2 Market Size & Forecast, 2021 – 2032

6. Thermal Printing Market Segmental Analysis & Forecast, By Application, 2021 – 2032, Value (Usd Billion)

    6.1 Introduction

 6.2 Retail

  6.2.1 Key Trends

  6.2.2 Market Size & Forecast, 2021 – 2032

 6.3 Healthcare & Hospitality

  6.3.1 Key Trends

  6.3.2 Market Size & Forecast, 2021 – 2032

   6.4 Transportation & Logistics

  6.4.1 Key Trends

  6.4.2 Market Size & Forecast, 2021 – 2032

   6.5 Manufacturing

  6.5.1 Key Trends

  6.5.2 Market Size & Forecast, 2021 – 2032

  6.6 Government

  6.6.1 Key Trends

  6.6.2 Market Size & Forecast, 2021 – 2032

7. Thermal Printing Market Segmental Analysis & Forecast, By Technology, 2021 – 2032, Value (Usd Billion)

    7.1 Introduction

 7.2 Direct Thermal Printing

  7.2.1 Key Trends

  7.2.2 Market Size & Forecast, 2021 – 2032

 7.3 Thermal Transfer Printing

  7.3.1 Key Trends

  7.3.2 Market Size & Forecast, 2021 – 2032

8. Thermal Printing Market Segmental Analysis & Forecast, By Offering, 2021 – 2032, Value (Usd Billion)

    8.1 Introduction

 8.2 Printers

  8.2.1 Key Trends

  8.2.2 Market Size & Forecast, 2021 – 2032

 8.3 Supplies

  8.3.1 Key Trends

  8.3.2 Market Size & Forecast, 2021 – 2032

9. Thermal Printing Market Segmental Analysis & Forecast By Region, 2021 – 2025, Value (Usd Billion)

9.1 Introduction

9.2 North America

 9.2.1 Key Trends

 9.2.2 Thermal Printing Market Size & Forecast, By Product Type, 2021 – 2032

 9.2.3 Thermal Printing Market Size & Forecast, By Application, 2021 – 2032

 9.2.4 Thermal Printing Market Size & Forecast, By Technology, 2021 – 2032

 9.2.5 Thermal Printing Market Size & Forecast, By Offering, 2021 – 2032

 9.2.6 Thermal Printing Market Size & Forecast, By Country, 2021 – 2032

  9.2.6.1 USA

   9.2.6.1.1 Thermal Printing Market Size & Forecast, By Product Type, 2021 – 2032

   9.2.6.1.2 Thermal Printing Market Size & Forecast, By Application, 2021 – 2032

   9.2.6.1.3 Thermal Printing Market Size & Forecast, By Technology, 2021 – 2032

   9.2.6.1.4 Thermal Printing Market Size & Forecast, By Offering, 2021 – 2032

  9.2.6.2 Canada

   9.2.6.2.1 Thermal Printing Market Size & Forecast, By Product Type, 2021 – 2032

   9.2.6.2.2 Thermal Printing Market Size & Forecast, By Application, 2021 – 2032

   9.2.6.2.3 Thermal Printing Market Size & Forecast, By Technology, 2021 – 2032

   9.2.6.2.4 Thermal Printing Market Size & Forecast, By Offering, 2021 – 2032

9.3 Europe

 9.3.1 Key Trends

 9.3.2 Thermal Printing Market Size & Forecast, By Product Type, 2021 – 2032

 9.3.3 Thermal Printing Market Size & Forecast, By Application, 2021 – 2032

 9.3.4 Thermal Printing Market Size & Forecast, By Technology, 2021 – 2032

 9.3.5 Thermal Printing Market Size & Forecast, By Offering, 2021 – 2032

 9.3.6 Thermal Printing Market Size & Forecast, By Country, 2021 – 2032

  9.3.6.1 Germany

   9.3.6.1.1 Thermal Printing Market Size & Forecast, By Product Type, 2021 – 2032

   9.3.6.1.2 Thermal Printing Market Size & Forecast, By Application, 2021 – 2032

   9.3.6.1.3 Thermal Printing Market Size & Forecast, By Technology, 2021 – 2032

   9.3.6.1.4 Thermal Printing Market Size & Forecast, By Offering, 2021 – 2032

  9.3.6.2 UK

   9.3.6.2.1 Thermal Printing Market Size & Forecast, By Product Type, 2021 – 2032

   9.3.6.2.2 Thermal Printing Market Size & Forecast, By Application, 2021 – 2032

   9.3.6.2.3 Thermal Printing Market Size & Forecast, By Technology, 2021 – 2032

   9.3.6.2.4 Thermal Printing Market Size & Forecast, By Offering, 2021 – 2032

  9.3.6.3 France

   9.3.6.3.1 Thermal Printing Market Size & Forecast, By Product Type, 2021 – 2032

   9.3.6.3.2 Thermal Printing Market Size & Forecast, By Application, 2021 – 2032

   9.3.6.3.3 Thermal Printing Market Size & Forecast, By Technology, 2021 – 2032

   9.3.6.3.4 Thermal Printing Market Size & Forecast, By Offering, 2021 – 2032

  9.3.6.4 Italy

   9.3.6.4.1 Thermal Printing Market Size & Forecast, By Product Type, 2021 – 2032

   9.3.6.4.2 Thermal Printing Market Size & Forecast, By Application, 2021 – 2032

   9.3.6.4.3 Thermal Printing Market Size & Forecast, By Technology, 2021 – 2032

   9.3.6.4.4 Thermal Printing Market Size & Forecast, By Offering, 2021 – 2032

  9.3.6.5 Spain

   9.3.6.5.1 Thermal Printing Market Size & Forecast, By Product Type, 2021 – 2032

   9.3.6.5.2 Thermal Printing Market Size & Forecast, By Application, 2021 – 2032

   9.3.6.5.3 Thermal Printing Market Size & Forecast, By Technology, 2021 – 2032

   9.3.6.5.4 Thermal Printing Market Size & Forecast, By Offering, 2021 – 2032

  9.3.6.6 Russia

   9.3.6.6.1 Thermal Printing Market Size & Forecast, By Product Type, 2021 – 2032

   9.3.6.6.2 Thermal Printing Market Size & Forecast, By Application, 2021 – 2032

   9.3.6.6.3 Thermal Printing Market Size & Forecast, By Technology, 2021 – 2032

   9.3.6.6.4 Thermal Printing Market Size & Forecast, By Offering, 2021 – 2032

  9.3.6.7 Poland

   9.3.6.7.1 Thermal Printing Market Size & Forecast, By Product Type, 2021 – 2032

   9.3.6.7.2 Thermal Printing Market Size & Forecast, By Application, 2021 – 2032

   9.3.6.7.3 Thermal Printing Market Size & Forecast, By Technology, 2021 – 2032

   9.3.6.7.4 Thermal Printing Market Size & Forecast, By Offering, 2021 – 2032

  9.3.6.8 Rest of Europe

   9.3.6.8.1 Thermal Printing Market Size & Forecast, By Product Type, 2021 – 2032

   9.3.6.8.2 Thermal Printing Market Size & Forecast, By Application, 2021 – 2032

   9.3.6.8.3 Thermal Printing Market Size & Forecast, By Technology, 2021 – 2032

   9.3.6.8.4 Thermal Printing Market Size & Forecast, By Offering, 2021 – 2032   

9.4 Asia-Pacific

 9.4.1 Key Trends

 9.4.2 Thermal Printing Market Size & Forecast, By Product Type, 2021 – 2032

 9.4.3 Thermal Printing Market Size & Forecast, By Application, 2021 – 2032

 9.4.4 Thermal Printing Market Size & Forecast, By Technology, 2021 – 2032

 9.4.5 Thermal Printing Market Size & Forecast, By Offering, 2021 – 2032

 9.4.6 Thermal Printing Market Size & Forecast, By Country, 2021 – 2032

  9.4.6.1 China

   9.4.6.1.1 Thermal Printing Market Size & Forecast, By Product Type, 2021 – 2032

   9.4.6.1.2 Thermal Printing Market Size & Forecast, By Application, 2021 – 2032

   9.4.6.1.3 Thermal Printing Market Size & Forecast, By Technology, 2021 – 2032

   9.4.6.1.4 Thermal Printing Market Size & Forecast, By Offering, 2021 – 2032

  9.4.6.2 India

   9.4.6.2.1 Thermal Printing Market Size & Forecast, By Product Type, 2021 – 2032

   9.4.6.2.2 Thermal Printing Market Size & Forecast, By Application, 2021 – 2032

   9.4.6.2.3 Thermal Printing Market Size & Forecast, By Technology, 2021 – 2032

   9.4.6.2.4 Thermal Printing Market Size & Forecast, By Offering, 2021 – 2032

  9.4.6.3 Japan

   9.4.6.3.1 Thermal Printing Market Size & Forecast, By Product Type, 2021 – 2032

   9.4.6.3.2 Thermal Printing Market Size & Forecast, By Application, 2021 – 2032

   9.4.6.3.3 Thermal Printing Market Size & Forecast, By Technology, 2021 – 2032

   9.4.6.3.4 Thermal Printing Market Size & Forecast, By Offering, 2021 – 2032

  9.4.6.4 South Korea

   9.4.6.4.1 Thermal Printing Market Size & Forecast, By Product Type, 2021 – 2032

   9.4.6.4.2 Thermal Printing Market Size & Forecast, By Application, 2021 – 2032

   9.4.6.4.3 Thermal Printing Market Size & Forecast, By Technology, 2021 – 2032

   9.4.6.4.4 Thermal Printing Market Size & Forecast, By Offering, 2021 – 2032

  9.4.6.5 Australia

   9.4.6.5.1 Thermal Printing Market Size & Forecast, By Product Type, 2021 – 2032

   9.4.6.5.2 Thermal Printing Market Size & Forecast, By Application, 2021 – 2032

   9.4.6.5.3 Thermal Printing Market Size & Forecast, By Technology, 2021 – 2032

   9.4.6.5.4 Thermal Printing Market Size & Forecast, By Offering, 2021 – 2032

  9.4.6.6 ASEAN Countries

   9.4.6.6.1 Thermal Printing Market Size & Forecast, By Product Type, 2021 – 2032

   9.4.6.6.2 Thermal Printing Market Size & Forecast, By Application, 2021 – 2032

   9.4.6.6.3 Thermal Printing Market Size & Forecast, By Technology, 2021 – 2032

   9.4.6.6.4 Thermal Printing Market Size & Forecast, By Offering, 2021 – 2032

  9.4.6.7 Rest of Asia-Pacific

   9.4.6.7.1 Thermal Printing Market Size & Forecast, By Product Type, 2021 – 2032

   9.4.6.7.2 Thermal Printing Market Size & Forecast, By Application, 2021 – 2032

   9.4.6.7.3 Thermal Printing Market Size & Forecast, By Technology, 2021 – 2032

   9.4.6.7.4 Thermal Printing Market Size & Forecast, By Offering, 2021 – 2032

9.5 Latin America

 9.5.1 Key Trends

 9.5.2 Thermal Printing Market Size & Forecast, By Product Type, 2021 – 2032

 9.5.3 Thermal Printing Market Size & Forecast, By Application, 2021 – 2032

 9.5.4 Thermal Printing Market Size & Forecast, By Technology, 2021 – 2032

 9.5.5 Thermal Printing Market Size & Forecast, By Offering, 2021 – 2032

 9.5.6 Thermal Printing Market Size & Forecast, By Country, 2021 – 2032

  9.5.6.1 Brazil

   9.5.6.1.1 Thermal Printing Market Size & Forecast, By Product Type, 2021 – 2032

   9.5.6.1.2 Thermal Printing Market Size & Forecast, By Application, 2021 – 2032

   9.5.6.1.3 Thermal Printing Market Size & Forecast, By Technology, 2021 – 2032

   9.5.6.1.4 Thermal Printing Market Size & Forecast, By Offering, 2021 – 2032

  9.5.6.2 Argentina

   9.5.6.2.1 Thermal Printing Market Size & Forecast, By Product Type, 2021 – 2032

   9.5.6.2.2 Thermal Printing Market Size & Forecast, By Application, 2021 – 2032

   9.5.6.2.3 Thermal Printing Market Size & Forecast, By Technology, 2021 – 2032

   9.5.6.2.4 Thermal Printing Market Size & Forecast, By Offering, 2021 – 2032

  9.5.6.3 Mexico

   9.5.6.3.1 Thermal Printing Market Size & Forecast, By Product Type, 2021 – 2032

   9.5.6.3.2 Thermal Printing Market Size & Forecast, By Application, 2021 – 2032

   9.5.6.3.3 Thermal Printing Market Size & Forecast, By Technology, 2021 – 2032

   9.5.6.3.4 Thermal Printing Market Size & Forecast, By Offering, 2021 – 2032

  9.5.6.4 Colombia

   9.5.6.4.1 Thermal Printing Market Size & Forecast, By Product Type, 2021 – 2032

   9.5.6.4.2 Thermal Printing Market Size & Forecast, By Application, 2021 – 2032

   9.5.6.4.3 Thermal Printing Market Size & Forecast, By Technology, 2021 – 2032

   9.5.6.4.4 Thermal Printing Market Size & Forecast, By Offering, 2021 – 2032

  9.5.6.5 Rest of Latin America

   9.5.6.5.1 Thermal Printing Market Size & Forecast, By Product Type, 2021 – 2032

   9.5.6.5.2 Thermal Printing Market Size & Forecast, By Application, 2021 – 2032

   9.5.6.5.3 Thermal Printing Market Size & Forecast, By Technology, 2021 – 2032

   9.5.6.5.4 Thermal Printing Market Size & Forecast, By Offering, 2021 – 2032

9.6 Middle East & Africa

 9.6.1 Key Trends

 9.6.2 Thermal Printing Market Size & Forecast, By Product Type, 2021 – 2032

 9.6.3 Thermal Printing Market Size & Forecast, By Application, 2021 – 2032

 9.6.4 Thermal Printing Market Size & Forecast, By Technology, 2021 – 2032

 9.6.5 Thermal Printing Market Size & Forecast, By Offering, 2021 – 2032

 9.6.6 Thermal Printing Market Size & Forecast, By Country, 2021 – 2032

  9.6.6.1 UAE

   9.6.6.1.1 Thermal Printing Market Size & Forecast, By Product Type, 2021 – 2032

   9.6.6.1.2 Thermal Printing Market Size & Forecast, By Application, 2021 – 2032

   9.6.6.1.3 Thermal Printing Market Size & Forecast, By Technology, 2021 – 2032

   9.6.6.1.4 Thermal Printing Market Size & Forecast, By Offering, 2021 – 2032

  9.6.6.2 Saudi Arabia

   9.6.6.2.1 Thermal Printing Market Size & Forecast, By Product Type, 2021 – 2032

   9.6.6.2.2 Thermal Printing Market Size & Forecast, By Application, 2021 – 2032

   9.6.6.2.3 Thermal Printing Market Size & Forecast, By Technology, 2021 – 2032

   9.6.6.2.4 Thermal Printing Market Size & Forecast, By Offering, 2021 – 2032

  9.6.6.3 Qatar

   9.6.6.3.1 Thermal Printing Market Size & Forecast, By Product Type, 2021 – 2032

   9.6.6.3.2 Thermal Printing Market Size & Forecast, By Application, 2021 – 2032

   9.6.6.3.3 Thermal Printing Market Size & Forecast, By Technology, 2021 – 2032

   9.6.6.3.4 Thermal Printing Market Size & Forecast, By Offering, 2021 – 2032

  9.6.6.4 Egypt

   9.6.6.4.1 Thermal Printing Market Size & Forecast, By Product Type, 2021 – 2032

   9.6.6.4.2 Thermal Printing Market Size & Forecast, By Application, 2021 – 2032

   9.6.6.4.3 Thermal Printing Market Size & Forecast, By Technology, 2021 – 2032

   9.6.6.4.4 Thermal Printing Market Size & Forecast, By Offering, 2021 – 2032

  9.6.6.5 South Africa

   9.6.6.5.1 Thermal Printing Market Size & Forecast, By Product Type, 2021 – 2032

   9.6.6.5.2 Thermal Printing Market Size & Forecast, By Application, 2021 – 2032

   9.6.6.5.3 Thermal Printing Market Size & Forecast, By Technology, 2021 – 2032

   9.6.6.5.4 Thermal Printing Market Size & Forecast, By Offering, 2021 – 2032

  9.6.6.6 Rest of Middle East & Africa

   9.6.6.6.1 Thermal Printing Market Size & Forecast, By Product Type, 2021 – 2032

   9.6.6.6.2 Thermal Printing Market Size & Forecast, By Application, 2021 – 2032

   9.6.6.6.3 Thermal Printing Market Size & Forecast, By Technology, 2021 – 2032

   9.6.6.6.4 Thermal Printing Market Size & Forecast, By Offering, 2021 – 2032

10. Competitive Landscape

 10.1 Key Players' Positioning

 10.2 Competitive Developments

  10.2.1 Key Strategies Adopted (%), By Key Players, 2024

  10.2.2 Year-Wise Strategies & Development, 2021 – 2025

  10.2.3 Number Of Strategies Adopted By Key Players, 2024

 10.3 Market Share Analysis, 2024

 10.4 Product/Service & Application Benchmarking

  10.4.1 Product/Service Specifications & Features By Key Players

  10.4.2 Product/Service Heatmap By Key Players

  10.4.3 Application Heatmap By Key Players

 10.5 Industry Start-Up & Innovation Landscape

10.6 Key Company Profiles

 10.6.1 Zebra Technologies Corporation

  10.6.1.1 Company Overview & Snapshot

  10.6.1.2 Product/Service Portfolio

  10.6.1.3 Key Company Financials

  10.6.1.4 SWOT Analysis

 10.6.2 Honeywell International Inc.

  10.6.2.1 Company Overview & Snapshot

  10.6.2.2 Product/Service Portfolio

  10.6.2.3 Key Company Financials

  10.6.2.4 SWOT Analysis

 10.6.3 Seiko Epson Corporation

  10.6.3.1 Company Overview & Snapshot

  10.6.3.2 Product/Service Portfolio

  10.6.3.3 Key Company Financials

  10.6.3.4 SWOT Analysis

 10.6.4 Toshiba Tec Corporation

  10.6.4.1 Company Overview & Snapshot

  10.6.4.2 Product/Service Portfolio

  10.6.4.3 Key Company Financials

  10.6.4.4 SWOT Analysis

 10.6.5 BIXOLON Co., Ltd.

  10.6.5.1 Company Overview & Snapshot

  10.6.5.2 Product/Service Portfolio

  10.6.5.3 Key Company Financials

  10.6.5.4 SWOT Analysis

 10.6.6 SATO Holdings Corporation

  10.6.6.1 Company Overview & Snapshot

  10.6.6.2 Product/Service Portfolio

  10.6.6.3 Key Company Financials

  10.6.6.4 SWOT Analysis

 10.6.7 TSC Auto ID Technology Co., Ltd.

  10.6.7.1 Company Overview & Snapshot

  10.6.7.2 Product/Service Portfolio

  10.6.7.3 Key Company Financials

  10.6.7.4 SWOT Analysis

 10.6.8 Star Micronics Co., Ltd.

  10.6.8.1 Company Overview & Snapshot

  10.6.8.2 Product/Service Portfolio

  10.6.8.3 Key Company Financials

  10.6.8.4 SWOT Analysis

 10.6.9 Avery Dennison Corporation

  10.6.9.1 Company Overview & Snapshot

  10.6.9.2 Product/Service Portfolio

  10.6.9.3 Key Company Financials

  10.6.9.4 SWOT Analysis

 10.6.10 NCR Corporation

  10.6.10.1 Company Overview & Snapshot

  10.6.10.2 Product/Service Portfolio

  10.6.10.3 Key Company Financials

  10.6.10.4 SWOT Analysis

 10.6.11 Fujitsu Limited

  10.6.11.1 Company Overview & Snapshot

  10.6.11.2 Product/Service Portfolio

  10.6.11.3 Key Company Financials

  10.6.11.4 SWOT Analysis

 10.6.12 Brother Industries, Ltd.

  10.6.12.1 Company Overview & Snapshot

  10.6.12.2 Product/Service Portfolio

  10.6.12.3 Key Company Financials

  10.6.12.4 SWOT Analysis

 10.6.13 Printronix Auto ID

  10.6.13.1 Company Overview & Snapshot

  10.6.13.2 Product/Service Portfolio

  10.6.13.3 Key Company Financials

  10.6.13.4 SWOT Analysis

 10.6.14 Citizen Systems Japan Co., Ltd.

  10.6.14.1 Company Overview & Snapshot

  10.6.14.2 Product/Service Portfolio

  10.6.14.3 Key Company Financials

  10.6.14.4 SWOT Analysis

 10.6.15 Datamax-O’Neil

  10.6.15.1 Company Overview & Snapshot

  10.6.15.2 Product/Service Portfolio

  10.6.15.3 Key Company Financials

  10.6.15.4 SWOT Analysis

 10.6.16 Shandong New Beiyang Information Technology Co., Ltd. (SNBC)

  10.6.16.1 Company Overview & Snapshot

  10.6.16.2 Product/Service Portfolio

  10.6.16.3 Key Company Financials

  10.6.16.4 SWOT Analysis

 10.6.17 Custom S.p.A.

  10.6.17.1 Company Overview & Snapshot

  10.6.17.2 Product/Service Portfolio

  10.6.17.3 Key Company Financials

  10.6.17.4 SWOT Analysis

 10.6.18 CognitiveTPG

  10.6.18.1 Company Overview & Snapshot

  10.6.18.2 Product/Service Portfolio

  10.6.18.3 Key Company Financials

  10.6.18.4 SWOT Analysis

 10.6.19 Oki Electric Industry Co., Ltd.

  10.6.19.1 Company Overview & Snapshot

  10.6.19.2 Product/Service Portfolio

  10.6.19.3 Key Company Financials

  10.6.19.4 SWOT Analysis

 10.6.20 HP Inc.

  10.6.20.1 Company Overview & Snapshot

  10.6.20.2 Product/Service Portfolio

  10.6.20.3 Key Company Financials

  10.6.20.4 SWOT Analysis

11. Analyst Recommendations

 11.1 SNS Insider Opportunity Map

 11.2 Industry Low-Hanging Fruit Assessment

 11.3 Market Entry & Growth Strategy

 11.4 Analyst Viewpoint & Suggestions On Market Growth

12. Assumptions

13. Disclaimer

14. Appendix

 14.1 List Of Tables

 14.2 List Of Figures

Key Segments: 

By Product Type

  • Desktop Printers

  • Mobile Printers

  • Industrial Printers

  • POS Printers  

By Application

  • Retail

  • Healthcare & Hospitality

  • Transportation & Logistics

  • Manufacturing

  • Government

By Technology

  • Direct Thermal Printing

  • Thermal Transfer Printing

By Component

  • Printers

  • Supplies

Request for Segment Customization as per your Business Requirement: Segment Customization Request

Regional Coverage:

North America

  • US

  • Canada

Europe

  • Germany

  • UK

  • France

  • Italy

  • Spain

  • Russia

  • Poland

  • Rest of Europe

Asia Pacific

  • China

  • India

  • Japan

  • South Korea

  • Australia

  • ASEAN Countries

  • Rest of Asia Pacific

Middle East & Africa

  • UAE

  • Saudi Arabia

  • Qatar

  • South Africa

  • Rest of Middle East & Africa

Latin America

  • Brazil

  • Argentina

  • Mexico

  • Colombia

  • Rest of Latin America

Request for Country Level Research Report: Country Level Customization Request

Available Customization 

With the given market data, SNS Insider offers customization as per the company’s specific needs. The following customization options are available for the report: 

  • Detailed Volume Analysis 

  • Criss-Cross segment analysis (e.g. Product X Application) 

  • Competitive Product Benchmarking 

  • Geographic Analysis 

  • Additional countries in any of the regions 

  • Customized Data Representation 

  • Detailed analysis and profiling of additional market players

An accurate research report requires proper strategizing as well as implementation. There are multiple factors involved in the completion of good and accurate research report and selecting the best methodology to compete the research is the toughest part. Since the research reports we provide play a crucial role in any company’s decision-making process, therefore we at SNS Insider always believe that we should choose the best method which gives us results closer to reality. This allows us to reach at a stage wherein we can provide our clients best and accurate investment to output ratio.

Each report that we prepare takes a timeframe of 350-400 business hours for production. Starting from the selection of titles through a couple of in-depth brain storming session to the final QC process before uploading our titles on our website we dedicate around 350 working hours. The titles are selected based on their current market cap and the foreseen CAGR and growth.


The 5 steps process:

Step 1: Secondary Research:

Secondary Research or Desk Research is as the name suggests is a research process wherein, we collect data through the readily available information. In this process we use various paid and unpaid databases which our team has access to and gather data through the same. This includes examining of listed companies’ annual reports, Journals, SEC filling etc. Apart from this our team has access to various associations across the globe across different industries. Lastly, we have exchange relationships with various university as well as individual libraries.

Secondary Research

Step 2: Primary Research

When we talk about primary research, it is a type of study in which the researchers collect relevant data samples directly, rather than relying on previously collected data.  This type of research is focused on gaining content specific facts that can be sued to solve specific problems. Since the collected data is fresh and first hand therefore it makes the study more accurate and genuine.

We at SNS Insider have divided Primary Research into 2 parts.

Part 1 wherein we interview the KOLs of major players as well as the upcoming ones across various geographic regions. This allows us to have their view over the market scenario and acts as an important tool to come closer to the accurate market numbers. As many as 45 paid and unpaid primary interviews are taken from both the demand and supply side of the industry to make sure we land at an accurate judgement and analysis of the market.

This step involves the triangulation of data wherein our team analyses the interview transcripts, online survey responses and observation of on filed participants. The below mentioned chart should give a better understanding of the part 1 of the primary interview.

Primary Research

Part 2: In this part of primary research the data collected via secondary research and the part 1 of the primary research is validated with the interviews from individual consultants and subject matter experts.

Consultants are those set of people who have at least 12 years of experience and expertise within the industry whereas Subject Matter Experts are those with at least 15 years of experience behind their back within the same space. The data with the help of two main processes i.e., FGDs (Focused Group Discussions) and IDs (Individual Discussions). This gives us a 3rd party nonbiased primary view of the market scenario making it a more dependable one while collation of the data pointers.

Step 3: Data Bank Validation

Once all the information is collected via primary and secondary sources, we run that information for data validation. At our intelligence centre our research heads track a lot of information related to the market which includes the quarterly reports, the daily stock prices, and other relevant information. Our data bank server gets updated every fortnight and that is how the information which we collected using our primary and secondary information is revalidated in real time.

Data Bank Validation

Step 4: QA/QC Process

After all the data collection and validation our team does a final level of quality check and quality assurance to get rid of any unwanted or undesired mistakes. This might include but not limited to getting rid of the any typos, duplication of numbers or missing of any important information. The people involved in this process include technical content writers, research heads and graphics people. Once this process is completed the title gets uploader on our platform for our clients to read it.

Step 5: Final QC/QA Process:

This is the last process and comes when the client has ordered the study. In this process a final QA/QC is done before the study is emailed to the client. Since we believe in giving our clients a good experience of our research studies, therefore, to make sure that we do not lack at our end in any way humanly possible we do a final round of quality check and then dispatch the study to the client.