Post-Harvest Treatment Market Report Scope & Overview:

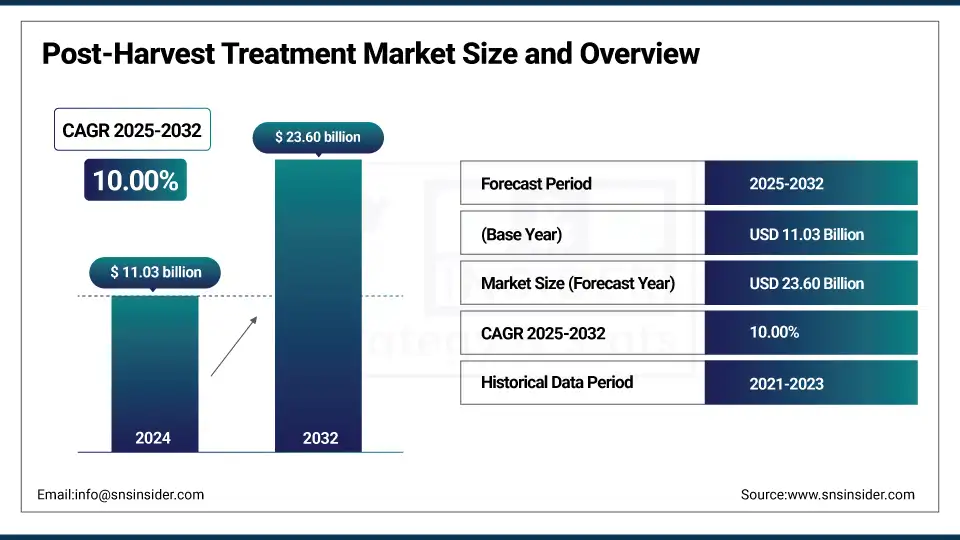
The Post-Harvest Treatment market size was valued at USD 11.03 billion in 2024 and is expected to reach USD 23.60 billion by 2032, growing at a CAGR of 10.00% over the forecast period of 2025-2032.

One key factor driving the market growth is the growing global focus on food loss post-harvest treatment, with FAO estimating that more than 14 million tonnes of food are lost for every 1% in loss between harvest and sale post-harvest treatment market trends which are driving the demand of hot water treatment, ethylene inhibitors, and biological control amongst others proves notable in sustaining shelf life of produce. AgroFresh, Pace International, and a few other companies have introduced the new generation coatings along with decay control products for meeting stringent global MRL standards. In 2024, USDA initiated numerous funding programs catering to the development of cold storage infrastructure, strengthening the post-harvest treatment market.

Advancements in supply chain logistics and smart packaging have been affecting the division of the post-harvest treatment market share. These post-harvest treatment companies are looking for AI-enabled quality monitoring systems to create synthetic datasets. According to the 2023 USDA announcement, $300 million of funding has been set aside for improving food preservation techniques. This detailed post-harvest treatment research report not only helps you in increasing revenue but also helps you build a model to grow your business, ultimately gaining traction globally.
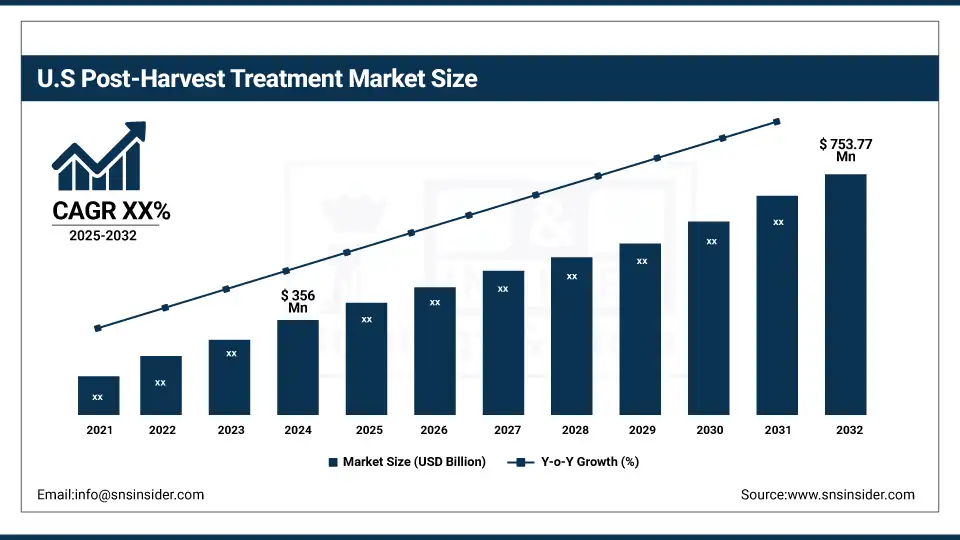
Market Dynamics:

Drivers:

  • Rising Consumer Preference for Plant-Based Preservation Elevates Innovation Incentive

The post-harvest treatment market growth is attributed to the increasing demand for residue-free freshness from consumers, which has risen amid the growing preference for plant-based coatings and ethylene blockers. Agtech startups are collaborating with academic institutions to utilize natural antimicrobials. The nation's food safety benchmarks that government agencies are beginning to see a greater number of biological treatments being registered. This adoption trajectory is encouraging post‑harvest treatments companies, both established and emerging, to market bio-based solutions that not only enhance shelf life but also support sustainability and food safety mandates.

  • Increasing Cold‑Chain Integration Reduces Spoilage and Enhances Quality Retention

Increasing temperature-controlled logistics in different regions is helping to reduce post-harvest loss by reducing spoilage during transit. Dynamic trends Smart sensor-equipped cold storage for perishables, which is used in the health care sector. Upgraded infrastructure resulted in a reduction of more than 15% of spoilage, according to development agencies. The rapid technological evolution has given impetus to cold storage solutions providers and farming cooperatives to integrate new cooling and monitoring systems that ensure the freshness from harvest to retail.

Restraints:

  • Crop-Specific Physiological Differences Challenge Treatment Standardization Across Varieties

Non-uniform deployment of Food Security Solutions is due to the different traits such as respiration rate, skin porosity, and moisture levels. Crop-specific treatment protocols make scaling difficult and increase complexity. Research has shown that this varies significantly with the species; for example, tender fruits need to be prepped in a way so they do not get infected. This crop‑specific adjustment necessity increases the research and development costs, time to test, especially for post‑harvest suppliers targeting multi-crop exporters, and places operational limitations on rapid implementation.

Segmentation Analysis:

By Origin

Synthetic held a dominant post-harvest treatment market share of 63.2% in 2024, due to increasing demand for synthetic as it is more efficient compared to natural hormones and used across large-scale commercial applications with consistent performance against microbial spoilage/decay or pest activities. Synthetic pesticides are convenient to formulate, have a longer shelf life, and are approved in all major regions for fruits and vegetables. While organic production for store sweetening is increasing among consumers, the economies of scale of high-output agricultural economies have maintained synthetics as the lingua franca following harvest.

Natural treatments are the fastest growing with the highest CAGR of 9.2% during the forecast period from 2025 to 2032, on account of surging consumer demand for residue-free produce, growing trend towards organic farming practices, and extensive laws regarding synthetic residues. Such desires are met by bio-based coatings, plant-derived fungicides, and edible waxes. The growing government subsidies and R&D investments have also supported the adoption, particularly among small-scale growers and organic packhouses in the Asia Pacific and North America.
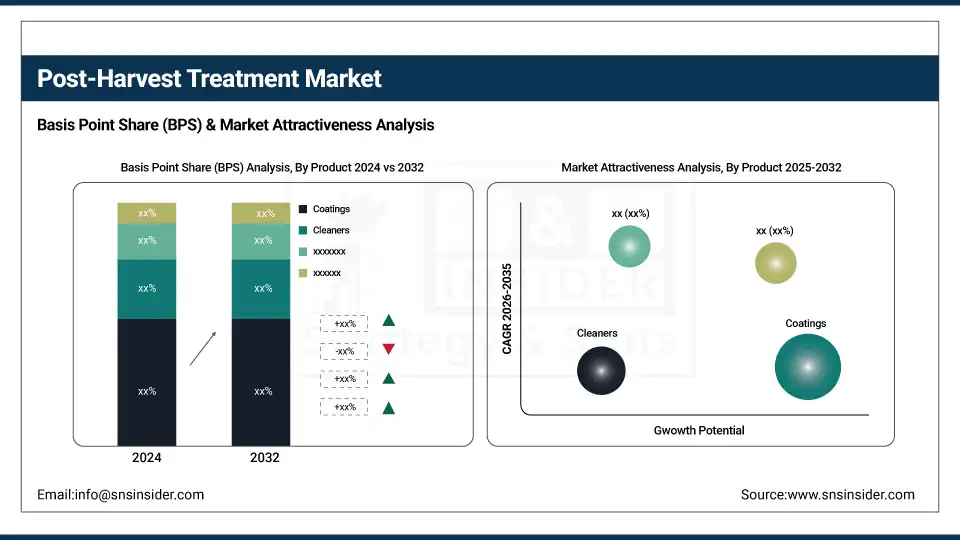
By Product

Coatings held a dominant post-harvest treatment market share of 37.6% in 2024, as they help extend shelf-life by reducing moisture-loss, respiration, and microbial growth. These edible films and waxes are rinse-less and are used on citrus, apples, and tropical fruits. Further, the preference for multifunctional coatings, combining both fungicidal and ripening inhibition properties, is increasing with advancing technologies across the supply chain. Apart from preserving the texture over long storage periods, coatings also prevent visual contamination.

Ethylene blockers are the fastest growing with the highest CAGR of 9.7% during the forecast period from 2025 to 2032, largely led by their effectiveness in prolonging ripening and senescence in climacteric fruits like bananas, avocados, tomatoes, etc. They interfere with ethylene receptors and are developed to prevent post-harvest losses incurred in export markets. Increasing trade volumes, consumer demand for fruits & vegetables, and new formulations of 1-MCP are fueling demand, with APAC and Latin America accounting for the highest consumption.

By Crop Type

Fruits and vegetables held a dominant post-harvest treatment market share of 56.8% in 2024, as they are highly perishable and prone to microbial spoilage, moisture loss, and physiological disorders. These also include coatings, fungicides, and sanitizers to extend the shelf-life, export quality, and meet the phytosanitary regulations. This dominance is also facilitated through demand for fresh produce, shelf-life requirements in retail, and post-harvest activation investments that horticultural supply chains promote.

Flowers and ornamentals are the fastest-growing with the highest CAGR of 8.6% during the forecast period from 2025 to 2032, as there is an increase in global demand for fresh-cut flowers, mainly for roses, chrysanthemums, and lilies. Efforts for post-harvest handling through ethylene control, microbial contamination, and moisture retention treatment are increasing export preparedness and vase life. Prosperous e-commerce floral sales, widespread access to flower auctions, and innovations in preservative solutions are further accelerating the growth of this lucrative market.

By Application

Disease control held a dominant post-harvest treatment market share of 48.9% in 2024, on account of the extensive use of fungicides and disinfectants, which prevent decay due to molds & bacteria during storage and transit. They are crucial for such high-revenue crops as citrus, apples, and potatoes. The increasingly large volume of produce being traded globally and longer supply chains associated with this escalating trade make it more important to address disease control in a manner that minimizes economic losses and regulatory rejections.

Ripening inhibition is the fastest growing with the highest CAGR of 9.1% during the forecast period from 2025 to 2032, due to the growing demand for longer shelf-life produce quality in transit. Suppression of ethylene blockers and temperature-controlled logistics allow businesses to defer ripening of fruits such as mangoes and bananas until they are brought on the shelves of the point-of-retail. In addition, the growing consumer inclination towards convenient, ready-to-eat fresh fruits is accelerating innovation in this category across the globe.

By Mode of Application

Spraying held a dominant post-harvest treatment market share of 51.3% in 2024, owing to its effective and uniform application of coatings, sanitizers, nutrient solutions, and fungicides for large produce volumes. This method is affordable, works with a variety of formulations, and can be used on both manual and automated systems. This is widely used in the fruit, vegetable, and grain packing facilities. Low-drift nozzles and the like are increasing efficacy by reducing drift and waste.

Coating is the fastest-growing segment with the highest CAGR of 8.9% during the forecast period from 2025 to 2032, driven by the dual feature of edible coatings for maintaining moisture and microbial control. They work particularly well for apples, citrus, and tropical fruits. Organic growers and exporters are increasingly turning to the bio-based and biodegradable versions. The possibility of transporting products by coating them makes the coatings useful for those regions in which cold storage is limited, but where demand is also increasing.

By End User

The Packers held a dominant post-harvest treatment market share of 41.2% in 2024, as they maintain a central position for massive processing volume, segregation, and packaging of produce prior to distribution. Their manufacturing expertise in industrial-grade infrastructure, integration with cold chain logistics, and compliance with export quality standards are key players who stand to expand the shelf life of fresh produce. As part of overall compliance and efficiency, Packers continue to use synthetic/next-level coating technologies.

Growers are the fastest growing with the highest CAGR of 8.6% during the forecast period from 2025 to 2032, owing to growing understanding about post-harvest losses, direct farm-level usage of treatments, and government initiatives supporting sustainable agriculture. This prompts producers to turn to on-farm, natural, and eco-friendly post-harvest solutions, making supply chain players a major driver in emerging markets.

Regional Analysis:

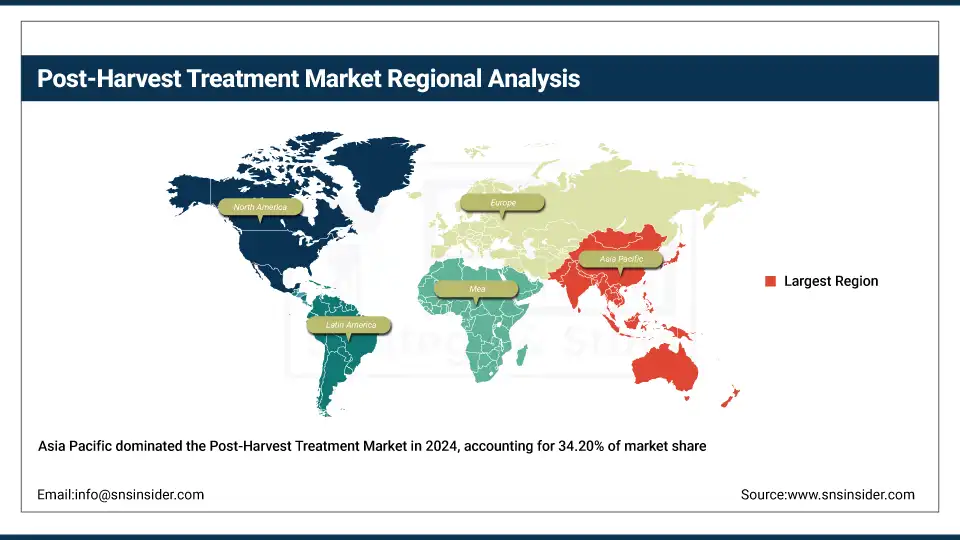
Asia Pacific dominates with a 34.20% share and is the fastest-growing region with the highest CAGR of 10.28% between 2025 and 2032, owing to the growing agricultural export business and investments in technologies for storing agricultural produce. Temperature-control logistics are increasingly being adopted, with coatings, ethylene blockers, and government programs like India's post-harvest loss reduction initiative well-established in countries like China, India, Thailand, and Vietnam. Growth driven by fast modernization in both smallholder-commercial systems

North America holds the second-dominating position with a market share of 26.40%, due to its strong post-harvest management system and product standards. The U.S. is the leader in the region, holding a market share of about 73% with a market size of USD 356 million in 2024 and is projected to reach a value of USD 753.77 million by 2032, buoyed by USDA funding and packhouse innovation, with Canada trailing behind as BC and Alberta receive strong provincial support for cold chain. Continuing demand from key apple, citrus, and berry supply chains for disease-control sprays, coatings, as well as ethylene inhibitors drives high consumer uptake.

Europe holds third place, accounting for 21.70% of the market, with crop protection legislation and sustainability trends underpinning further growth. The requirement to export horticultural produce has been the key driver behind its implementation by Germany, Spain, and the Netherlands due to restrictive post‑harvest residue limit requirements of the EU. The major national initiatives in cold storage modernization in Germany and grants for post‑harvest quality projects in Spain both have the same effect of increasing potential to invest. It is in this dynamic regulatory focus area and significant export to fresh plant produce that Europe resides, supported globally by the Asia Pacific, but from a position of being able to grow its capability only within limits.

Key Players:

The major post-harvest treatment market competitors include AgroFresh Solutions, Inc., Citrosol, Hazel Technologies Inc., JBT Corporation, Lytone Enterprise Inc., Xeda International S.A.S., Colin Campbell Chemicals Pty Ltd., Fomesa Fruitech, PostHarvest Technologies, Post Harvest Solution Ltd., Fine Chemicals Inc., Apeel Sciences, Sufresca Ltd., KitoZyme, LLC, Ceradis B.V., Jingold S.p.A., Symbiotech Research Pvt. Ltd., NTC Agri, Agrosta SARL, and Decco Ibérica Postcosecha S.A.U.

Recent Developments:

  • In May 2025, JBT Marel showcased its new ozone-based sanitization equipment for fruits and vegetables at IFFA 2025 in Frankfurt, highlighting enhanced microbial control and reduced chemical residues

  • In January 2025, Citrosol unveiled its CATsystem automatic control platform and GREENFOG-AS fumigant system at Fruit Logistica 2025 in Berlin

Post-Harvest Treatment Market Report Scope:

Report Attributes Details
Market Size in 2024 USD 11.03 billion
Market Size by 2032 USD 23.60 billion
CAGR CAGR of 10.00% From 2025 to 2032
Base Year 2024
Forecast Period 2025-2032
Historical Data 2021-2023
Report Scope & Coverage Market Size, Segments Analysis, Competitive Landscape, Regional Analysis, DROC & SWOT Analysis, Forecast Outlook
Key Segments •By Origin (Natural, and Synthetic)
•By Product (Coatings, Cleaners, Fungicides, Insecticides, Ethylene Blockers, Sanitizers, and Others)
•By Crop Type (Cereals & Grains, Oilseeds & Pulses, Fruits & Vegetables, Flowers & Ornamentals, and Others)
•By Application (Disease Control, Ripening Inhibition, Moisture Retention, Disinfection, and Others)
•By Mode of Application (Spraying, Dipping, Fumigation, and Coating)
•By End User (Growers, Packers, and Others)
Regional Analysis/Coverage North America (US, Canada, Mexico), Europe (Germany, France, UK, Italy, Spain, Poland, Turkey, Rest of Europe), Asia Pacific (China, India, Japan, South Korea, Singapore, Australia, Rest of Asia Pacific), Middle East & Africa (UAE, Saudi Arabia, Qatar, South Africa, Rest of Middle East & Africa), Latin America (Brazil, Argentina, Rest of Latin America)
Company Profiles AgroFresh Solutions, Inc., Citrosol, Hazel Technologies Inc., JBT Corporation, Lytone Enterprise Inc., Xeda International S.A.S., Colin Campbell Chemicals Pty Ltd., Fomesa Fruitech, PostHarvest Technologies, Post Harvest Solution Ltd., Fine Chemicals Inc., Apeel Sciences, Sufresca Ltd., KitoZyme, LLC, Ceradis B.V., Jingold S.p.A., Symbiotech Research Pvt. Ltd., NTC Agri, Agrosta SARL, and Decco Ibérica Postcosecha S.A.U. 

Table Of Contents

1. Introduction

1.1 Market Definition & Scope

 1.2 Research Assumptions & Abbreviations

 1.3 Research Methodology

2. Executive Summary

2.1 Market Snapshot

 2.2 Market Absolute $ Opportunity Assessment & Y-o-Y Analysis, 2021–2032

 2.3 Market Size & Forecast, By Segmentation, 2021–2032

  2.3.1 Market Size By Origin

         2.3.2 Market Size By Product

         2.3.3 Market Size By Crop Type

         2.3.4 Market Size By Application

         2.3.5 Market Size By Mode of Application

  2.3.6 Market Size By End User

 2.4 Market Share & Bps Analysis By Region, 2024

 2.5 Industry Growth Scenarios – Conservative, Likely & Optimistic

 2.6 Industry CxO’s Perspective

3. Market Overview

3.1 Market Dynamics

  3.1.1 Drivers

  3.1.2 Restraints

  3.1.3 Opportunities

  3.1.4 Key Market Trends

 3.2 Industry PESTLE Analysis

 3.3 Key Industry Forces (Porter’s) Impacting Market Growth

 3.4 Industry Supply Chain Analysis

  3.4.1 Raw Material Suppliers

  3.4.2 Manufacturers

  3.4.3 Distributors/Suppliers

  3.4.4 Customers/End-Users

 3.5 Industry Life Cycle Assessment

 3.6 Parent Market Overview

 3.7 Market Risk Assessment

4. Statistical Insights & Trends Reporting

4.1 Pricing Analysis & Forecast

  4.1.1 Overview

  4.1.2 Pricing Analysis & Forecast By Product, 2021–2032

  4.1.3 Price Benchmarking By Key Players, 2024

 4.2 Regulatory Landscape

  4.2.1 Overview

  4.2.2 Regulatory Trends By Key Countries

  4.2.3 Regulatory Outlook By Product Type

 4.3 Trade Analysis

  4.3.1 Overview

  4.3.2 Import Analysis (Value & Volume), By Country, 2021–2024

  4.3.3 Export Analysis (Value & Volume), By Country, 2021–2024

  4.3.4 Major Importing Countries

  4.3.5 Major Exporting Countries

5. Post-Harvest Treatment Market Segmental Analysis & Forecast, By Origin, 2021 – 2032, Value (USD Billion) & Volume

5.1 Introduction

 5.2 Natural

  5.2.1 Key Trends

  5.2.2 Market Size & Forecast, 2021 – 2032

 5.3 Synthetic

  5.3.1 Key Trends

  5.3.2 Market Size & Forecast, 2021 – 2032

6. Post-Harvest Treatment Market Segmental Analysis & Forecast, By Product, 2021 – 2032, Value (USD Billion) & Volume

    6.1 Introduction

 6.2 Coatings

  6.2.1 Key Trends

  6.2.2 Market Size & Forecast, 2021 – 2032

 6.3 Cleaners

  6.3.1 Key Trends

  6.3.2 Market Size & Forecast, 2021 – 2032

 6.4 Fungicides

  6.4.1 Key Trends

  6.4.2 Market Size & Forecast, 2021 – 2032

 6.5 Insecticides

  6.5.1 Key Trends

  6.5.2 Market Size & Forecast, 2021 – 2032

 6.6 Ethylene Blockers

  6.6.1 Key Trends

  6.6.2 Market Size & Forecast, 2021 – 2032

 6.7 Sanitizers

  6.7.1 Key Trends

  6.7.2 Market Size & Forecast, 2021 – 2032

 6.8 Others

  6.8.1 Key Trends

  6.8.2 Market Size & Forecast, 2021 – 2032

7. Post-Harvest Treatment Market Segmental Analysis & Forecast, By Crop Type, 2021 – 2032, Value (USD Billion) & Volume

    7.1 Introduction

 7.2 Cereals & Grains

  7.2.1 Key Trends

  7.2.2 Market Size & Forecast, 2021 – 2032

 7.3 Oilseeds & Pulses

  7.3.1 Key Trends

  7.3.2 Market Size & Forecast, 2021 – 2032

 7.4 Fruits & Vegetables

  7.4.1 Key Trends

  7.4.2 Market Size & Forecast, 2021 – 2032

 7.5 Flowers & Ornamentals

  7.5.1 Key Trends

  7.5.2 Market Size & Forecast, 2021 – 2032

 7.6 Others

  7.6.1 Key Trends

  7.6.2 Market Size & Forecast, 2021 – 2032

8. Post-Harvest Treatment Market Segmental Analysis & Forecast, By Application, 2021 – 2032, Value (USD Billion) & Volume

    8.1 Introduction

 8.2 Disease Control

  8.2.1 Key Trends

  8.2.2 Market Size & Forecast, 2021 – 2032

 8.3 Ripening Inhibition

  8.3.1 Key Trends

  8.3.2 Market Size & Forecast, 2021 – 2032

 8.4 Moisture Retention

  8.4.1 Key Trends

  8.4.2 Market Size & Forecast, 2021 – 2032

 8.5 Disinfection

  8.5.1 Key Trends

  8.5.2 Market Size & Forecast, 2021 – 2032

 8.6 Others

  8.6.1 Key Trends

  8.6.2 Market Size & Forecast, 2021 – 2032

9. Post-Harvest Treatment Market Segmental Analysis & Forecast, By Mode of Application, 2021 – 2032, Value (USD Billion) & Volume

    9.1 Introduction 

  9.2 Spraying 

   9.2.1 Key Trends 

   9.2.2 Market Size & Forecast, 2021 – 2032 

  9.3 Dipping 

   9.3.1 Key Trends 

   9.3.2 Market Size & Forecast, 2021 – 2032 

  9.4 Fumigation 

   9.4.1 Key Trends 

   9.4.2 Market Size & Forecast, 2021 – 2032 

  9.5 Coating 

   9.5.1 Key Trends 

   9.5.2 Market Size & Forecast, 2021 – 2032 

10. Post-Harvest Treatment Market Segmental Analysis & Forecast, By End User, 2021 – 2032, Value (USD Billion) & Volume

 10.1 Introduction

 10.2 Growers

  10.2.1 Key Trends

  10.2.2 Market Size & Forecast, 2021 – 2032

 10.3 Packers

  10.3.1 Key Trends

  10.3.2 Market Size & Forecast, 2021 – 2032

 10.4 Others

  10.4.1 Key Trends

  10.4.2 Market Size & Forecast, 2021 – 2032

11. Post-Harvest Treatment Market Segmental Analysis & Forecast By Region, 2021 – 2032, Value (USD Billion) & Volume

 11.1 Introduction

 11.2 North America

  11.2.1 Key Trends

  11.2.2 Post-Harvest Treatment Market Size & Forecast, By Origin, 2021 – 2032

  11.2.3 Post-Harvest Treatment Market Size & Forecast, By Product, 2021 – 2032

  11.2.4 Post-Harvest Treatment Market Size & Forecast, By Crop Type, 2021 – 2032

  11.2.5 Post-Harvest Treatment Market Size & Forecast, By Application, 2021 – 2032

  11.2.6 Post-Harvest Treatment Market Size & Forecast, By Mode of Application, 2021 – 2032

  11.2.7 Post-Harvest Treatment Market Size & Forecast, By End User, 2021 – 2032

  11.2.8 Post-Harvest Treatment Market Size & Forecast, By Country, 2021 – 2032

   11.2.8.1 USA

    11.2.8.1.1 Post-Harvest Treatment Market Size & Forecast, By Origin, 2021 – 2032

    11.2.8.1.2 Post-Harvest Treatment Market Size & Forecast, By Product, 2021 – 2032

    11.2.8.1.3 Post-Harvest Treatment Market Size & Forecast, By Crop Type, 2021 – 2032

    11.2.8.1.4 Post-Harvest Treatment Market Size & Forecast, By Application, 2021 – 2032

    11.2.8.1.5 Post-Harvest Treatment Market Size & Forecast, By Mode of Application, 2021 – 2032

    11.2.8.1.6 Post-Harvest Treatment Market Size & Forecast, By End User, 2021 – 2032

   11.2.8.2 Canada

    11.2.8.2.1 Post-Harvest Treatment Market Size & Forecast, By Origin, 2021 – 2032

    11.2.8.2.2 Post-Harvest Treatment Market Size & Forecast, By Product, 2021 – 2032

    11.2.8.2.3 Post-Harvest Treatment Market Size & Forecast, By Crop Type, 2021 – 2032

    11.2.8.2.4 Post-Harvest Treatment Market Size & Forecast, By Application, 2021 – 2032

    11.2.8.2.5 Post-Harvest Treatment Market Size & Forecast, By Mode of Application, 2021 – 2032

    11.2.8.2.6 Post-Harvest Treatment Market Size & Forecast, By End User, 2021 – 2032

11.3 Europe

 11.3.1 Key Trends

 11.3.2 Post-Harvest Treatment Market Size & Forecast, By Origin, 2021 – 2032

 11.3.3 Post-Harvest Treatment Market Size & Forecast, By Product, 2021 – 2032

 11.3.4 Post-Harvest Treatment Market Size & Forecast, By Crop Type, 2021 – 2032

 11.3.5 Post-Harvest Treatment Market Size & Forecast, By Application, 2021 – 2032

 11.3.6 Post-Harvest Treatment Market Size & Forecast, By Mode of Application, 2021 – 2032

 11.3.7 Post-Harvest Treatment Market Size & Forecast, By End User, 2021 – 2032

 11.3.8 Post-Harvest Treatment Market Size & Forecast, By Country, 2021 – 2032

  11.3.8.1 Germany

   11.3.8.1.1 Post-Harvest Treatment Market Size & Forecast, By Origin, 2021 – 2032

   11.3.8.1.2 Post-Harvest Treatment Market Size & Forecast, By Product, 2021 – 2032

   11.3.8.1.3 Post-Harvest Treatment Market Size & Forecast, By Crop Type, 2021 – 2032

   11.3.8.1.4 Post-Harvest Treatment Market Size & Forecast, By Application, 2021 – 2032

   11.3.8.1.5 Post-Harvest Treatment Market Size & Forecast, By Mode of Application, 2021 – 2032

   11.3.8.1.6 Post-Harvest Treatment Market Size & Forecast, By End User, 2021 – 2032

  11.3.8.2 UK

   11.3.8.2.1 Post-Harvest Treatment Market Size & Forecast, By Origin, 2021 – 2032

   11.3.8.2.2 Post-Harvest Treatment Market Size & Forecast, By Product, 2021 – 2032

   11.3.8.2.3 Post-Harvest Treatment Market Size & Forecast, By Crop Type, 2021 – 2032

   11.3.8.2.4 Post-Harvest Treatment Market Size & Forecast, By Application, 2021 – 2032

   11.3.8.2.5 Post-Harvest Treatment Market Size & Forecast, By Mode of Application, 2021 – 2032

   11.3.8.2.6 Post-Harvest Treatment Market Size & Forecast, By End User, 2021 – 2032

  11.3.8.3 France

   11.3.8.3.1 Post-Harvest Treatment Market Size & Forecast, By Origin, 2021 – 2032

   11.3.8.3.2 Post-Harvest Treatment Market Size & Forecast, By Product, 2021 – 2032

   11.3.8.3.3 Post-Harvest Treatment Market Size & Forecast, By Crop Type, 2021 – 2032

   11.3.8.3.4 Post-Harvest Treatment Market Size & Forecast, By Application, 2021 – 2032

   11.3.8.3.5 Post-Harvest Treatment Market Size & Forecast, By Mode of Application, 2021 – 2032

   11.3.8.3.6 Post-Harvest Treatment Market Size & Forecast, By End User, 2021 – 2032

  11.3.8.4 Italy

   11.3.8.4.1 Post-Harvest Treatment Market Size & Forecast, By Origin, 2021 – 2032

   11.3.8.4.2 Post-Harvest Treatment Market Size & Forecast, By Product, 2021 – 2032

   11.3.8.4.3 Post-Harvest Treatment Market Size & Forecast, By Crop Type, 2021 – 2032

   11.3.8.4.4 Post-Harvest Treatment Market Size & Forecast, By Application, 2021 – 2032

   11.3.8.4.5 Post-Harvest Treatment Market Size & Forecast, By Mode of Application, 2021 – 2032

   11.3.8.4.6 Post-Harvest Treatment Market Size & Forecast, By End User, 2021 – 2032

  11.3.8.5 Spain

   11.3.8.5.1 Post-Harvest Treatment Market Size & Forecast, By Origin, 2021 – 2032

   11.3.8.5.2 Post-Harvest Treatment Market Size & Forecast, By Product, 2021 – 2032

   11.3.8.5.3 Post-Harvest Treatment Market Size & Forecast, By Crop Type, 2021 – 2032

   11.3.8.5.4 Post-Harvest Treatment Market Size & Forecast, By Application, 2021 – 2032

   11.3.8.5.5 Post-Harvest Treatment Market Size & Forecast, By Mode of Application, 2021 – 2032

   11.3.8.5.6 Post-Harvest Treatment Market Size & Forecast, By End User, 2021 – 2032

  11.3.8.6 Russia

   11.3.8.6.1 Post-Harvest Treatment Market Size & Forecast, By Origin, 2021 – 2032

   11.3.8.6.2 Post-Harvest Treatment Market Size & Forecast, By Product, 2021 – 2032

   11.3.8.6.3 Post-Harvest Treatment Market Size & Forecast, By Crop Type, 2021 – 2032

   11.3.8.6.4 Post-Harvest Treatment Market Size & Forecast, By Application, 2021 – 2032

   11.3.8.6.5 Post-Harvest Treatment Market Size & Forecast, By Mode of Application, 2021 – 2032

   11.3.8.6.6 Post-Harvest Treatment Market Size & Forecast, By End User, 2021 – 2032

  11.3.8.7 Poland

   11.3.8.7.1 Post-Harvest Treatment Market Size & Forecast, By Origin, 2021 – 2032

   11.3.8.7.2 Post-Harvest Treatment Market Size & Forecast, By Product, 2021 – 2032

   11.3.8.7.3 Post-Harvest Treatment Market Size & Forecast, By Crop Type, 2021 – 2032

   11.3.8.7.4 Post-Harvest Treatment Market Size & Forecast, By Application, 2021 – 2032

   11.3.8.7.5 Post-Harvest Treatment Market Size & Forecast, By Mode of Application, 2021 – 2032

   11.3.8.7.6 Post-Harvest Treatment Market Size & Forecast, By End User, 2021 – 2032

  11.3.8.8 Rest of Europe

   11.3.8.8.1 Post-Harvest Treatment Market Size & Forecast, By Origin, 2021 – 2032

   11.3.8.8.2 Post-Harvest Treatment Market Size & Forecast, By Product, 2021 – 2032

   11.3.8.8.3 Post-Harvest Treatment Market Size & Forecast, By Crop Type, 2021 – 2032

   11.3.8.8.4 Post-Harvest Treatment Market Size & Forecast, By Application, 2021 – 2032

   11.3.8.8.5 Post-Harvest Treatment Market Size & Forecast, By Mode of Application, 2021 – 2032

   11.3.8.8.6 Post-Harvest Treatment Market Size & Forecast, By End User, 2021 – 2032

11.4 Asia-Pacific

 11.4.1 Key Trends

 11.4.2 Post-Harvest Treatment Market Size & Forecast, By Origin, 2021 – 2032

 11.4.3 Post-Harvest Treatment Market Size & Forecast, By Product, 2021 – 2032

 11.4.4 Post-Harvest Treatment Market Size & Forecast, By Crop Type, 2021 – 2032

 11.4.5 Post-Harvest Treatment Market Size & Forecast, By Application, 2021 – 2032

 11.4.6 Post-Harvest Treatment Market Size & Forecast, By Mode of Application, 2021 – 2032

 11.4.7 Post-Harvest Treatment Market Size & Forecast, By End User, 2021 – 2032

 11.4.8 Post-Harvest Treatment Market Size & Forecast, By Country, 2021 – 2032

  11.4.8.1 China

   11.4.8.1.1 Post-Harvest Treatment Market Size & Forecast, By Origin, 2021 – 2032

   11.4.8.1.2 Post-Harvest Treatment Market Size & Forecast, By Product, 2021 – 2032

   11.4.8.1.3 Post-Harvest Treatment Market Size & Forecast, By Crop Type, 2021 – 2032

   11.4.8.1.4 Post-Harvest Treatment Market Size & Forecast, By Application, 2021 – 2032

   11.4.8.1.5 Post-Harvest Treatment Market Size & Forecast, By Mode of Application, 2021 – 2032

   11.4.8.1.6 Post-Harvest Treatment Market Size & Forecast, By End User, 2021 – 2032

  11.4.8.2 India

   11.4.8.2.1 Post-Harvest Treatment Market Size & Forecast, By Origin, 2021 – 2032

   11.4.8.2.2 Post-Harvest Treatment Market Size & Forecast, By Product, 2021 – 2032

   11.4.8.2.3 Post-Harvest Treatment Market Size & Forecast, By Crop Type, 2021 – 2032

   11.4.8.2.4 Post-Harvest Treatment Market Size & Forecast, By Application, 2021 – 2032

   11.4.8.2.5 Post-Harvest Treatment Market Size & Forecast, By Mode of Application, 2021 – 2032

   11.4.8.2.6 Post-Harvest Treatment Market Size & Forecast, By End User, 2021 – 2032

  11.4.8.3 Japan

   11.4.8.3.1 Post-Harvest Treatment Market Size & Forecast, By Origin, 2021 – 2032

   11.4.8.3.2 Post-Harvest Treatment Market Size & Forecast, By Product, 2021 – 2032

   11.4.8.3.3 Post-Harvest Treatment Market Size & Forecast, By Crop Type, 2021 – 2032

   11.4.8.3.4 Post-Harvest Treatment Market Size & Forecast, By Application, 2021 – 2032

   11.4.8.3.5 Post-Harvest Treatment Market Size & Forecast, By Mode of Application, 2021 – 2032

   11.4.8.3.6 Post-Harvest Treatment Market Size & Forecast, By End User, 2021 – 2032

  11.4.8.4 South Korea

   11.4.8.4.1 Post-Harvest Treatment Market Size & Forecast, By Origin, 2021 – 2032

   11.4.8.4.2 Post-Harvest Treatment Market Size & Forecast, By Product, 2021 – 2032

   11.4.8.4.3 Post-Harvest Treatment Market Size & Forecast, By Crop Type, 2021 – 2032

   11.4.8.4.4 Post-Harvest Treatment Market Size & Forecast, By Application, 2021 – 2032

   11.4.8.4.5 Post-Harvest Treatment Market Size & Forecast, By Mode of Application, 2021 – 2032

   11.4.8.4.6 Post-Harvest Treatment Market Size & Forecast, By End User, 2021 – 2032

  11.4.8.5 Australia

   11.4.8.5.1 Post-Harvest Treatment Market Size & Forecast, By Origin, 2021 – 2032

   11.4.8.5.2 Post-Harvest Treatment Market Size & Forecast, By Product, 2021 – 2032

   11.4.8.5.3 Post-Harvest Treatment Market Size & Forecast, By Crop Type, 2021 – 2032

   11.4.8.5.4 Post-Harvest Treatment Market Size & Forecast, By Application, 2021 – 2032

   11.4.8.5.5 Post-Harvest Treatment Market Size & Forecast, By Mode of Application, 2021 – 2032

   11.4.8.5.6 Post-Harvest Treatment Market Size & Forecast, By End User, 2021 – 2032

  11.4.8.6 ASEAN Countries

   11.4.8.6.1 Post-Harvest Treatment Market Size & Forecast, By Origin, 2021 – 2032

   11.4.8.6.2 Post-Harvest Treatment Market Size & Forecast, By Product, 2021 – 2032

   11.4.8.6.3 Post-Harvest Treatment Market Size & Forecast, By Crop Type, 2021 – 2032

   11.4.8.6.4 Post-Harvest Treatment Market Size & Forecast, By Application, 2021 – 2032

   11.4.8.6.5 Post-Harvest Treatment Market Size & Forecast, By Mode of Application, 2021 – 2032

   11.4.8.6.6 Post-Harvest Treatment Market Size & Forecast, By End User, 2021 – 2032

  11.4.8.7 Rest of Asia-Pacific

   11.4.8.7.1 Post-Harvest Treatment Market Size & Forecast, By Origin, 2021 – 2032

   11.4.8.7.2 Post-Harvest Treatment Market Size & Forecast, By Product, 2021 – 2032

   11.4.8.7.3 Post-Harvest Treatment Market Size & Forecast, By Crop Type, 2021 – 2032

   11.4.8.7.4 Post-Harvest Treatment Market Size & Forecast, By Application, 2021 – 2032

   11.4.8.7.5 Post-Harvest Treatment Market Size & Forecast, By Mode of Application, 2021 – 2032

   11.4.8.7.6 Post-Harvest Treatment Market Size & Forecast, By End User, 2021 – 2032

11.5 Latin America

 11.5.1 Key Trends

 11.5.2 Post-Harvest Treatment Market Size & Forecast, By Origin, 2021 – 2032

 11.5.3 Post-Harvest Treatment Market Size & Forecast, By Product, 2021 – 2032

 11.5.4 Post-Harvest Treatment Market Size & Forecast, By Crop Type, 2021 – 2032

 11.5.5 Post-Harvest Treatment Market Size & Forecast, By Application, 2021 – 2032

 11.5.6 Post-Harvest Treatment Market Size & Forecast, By Mode of Application, 2021 – 2032

 11.5.7 Post-Harvest Treatment Market Size & Forecast, By End User, 2021 – 2032

 11.5.8 Post-Harvest Treatment Market Size & Forecast, By Country, 2021 – 2032

  11.5.8.1 Brazil

   11.5.8.1.1 Post-Harvest Treatment Market Size & Forecast, By Origin, 2021 – 2032

   11.5.8.1.2 Post-Harvest Treatment Market Size & Forecast, By Product, 2021 – 2032

   11.5.8.1.3 Post-Harvest Treatment Market Size & Forecast, By Crop Type, 2021 – 2032

   11.5.8.1.4 Post-Harvest Treatment Market Size & Forecast, By Application, 2021 – 2032

   11.5.8.1.5 Post-Harvest Treatment Market Size & Forecast, By Mode of Application, 2021 – 2032

   11.5.8.1.6 Post-Harvest Treatment Market Size & Forecast, By End User, 2021 – 2032

  11.5.8.2 Argentina

   11.5.8.2.1 Post-Harvest Treatment Market Size & Forecast, By Origin, 2021 – 2032

   11.5.8.2.2 Post-Harvest Treatment Market Size & Forecast, By Product, 2021 – 2032

   11.5.8.2.3 Post-Harvest Treatment Market Size & Forecast, By Crop Type, 2021 – 2032

   11.5.8.2.4 Post-Harvest Treatment Market Size & Forecast, By Application, 2021 – 2032

   11.5.8.2.5 Post-Harvest Treatment Market Size & Forecast, By Mode of Application, 2021 – 2032

   11.5.8.2.6 Post-Harvest Treatment Market Size & Forecast, By End User, 2021 – 2032

  11.5.8.3 Mexico

   11.5.8.3.1 Post-Harvest Treatment Market Size & Forecast, By Origin, 2021 – 2032

   11.5.8.3.2 Post-Harvest Treatment Market Size & Forecast, By Product, 2021 – 2032

   11.5.8.3.3 Post-Harvest Treatment Market Size & Forecast, By Crop Type, 2021 – 2032

   11.5.8.3.4 Post-Harvest Treatment Market Size & Forecast, By Application, 2021 – 2032

   11.5.8.3.5 Post-Harvest Treatment Market Size & Forecast, By Mode of Application, 2021 – 2032

   11.5.8.3.6 Post-Harvest Treatment Market Size & Forecast, By End User, 2021 – 2032

  11.5.8.4 Colombia

   11.5.8.4.1 Post-Harvest Treatment Market Size & Forecast, By Origin, 2021 – 2032

   11.5.8.4.2 Post-Harvest Treatment Market Size & Forecast, By Product, 2021 – 2032

   11.5.8.4.3 Post-Harvest Treatment Market Size & Forecast, By Crop Type, 2021 – 2032

   11.5.8.4.4 Post-Harvest Treatment Market Size & Forecast, By Application, 2021 – 2032

   11.5.8.4.5 Post-Harvest Treatment Market Size & Forecast, By Mode of Application, 2021 – 2032

   11.5.8.4.6 Post-Harvest Treatment Market Size & Forecast, By End User, 2021 – 2032

  11.5.8.5 Rest of Latin America

   11.5.8.5.1 Post-Harvest Treatment Market Size & Forecast, By Origin, 2021 – 2032

   11.5.8.5.2 Post-Harvest Treatment Market Size & Forecast, By Product, 2021 – 2032

   11.5.8.5.3 Post-Harvest Treatment Market Size & Forecast, By Crop Type, 2021 – 2032

   11.5.8.5.4 Post-Harvest Treatment Market Size & Forecast, By Application, 2021 – 2032

   11.5.8.5.5 Post-Harvest Treatment Market Size & Forecast, By Mode of Application, 2021 – 2032

   11.5.8.5.6 Post-Harvest Treatment Market Size & Forecast, By End User, 2021 – 2032

11.6 Middle East & Africa

 11.6.1 Key Trends

 11.6.2 Post-Harvest Treatment Market Size & Forecast, By Origin, 2021 – 2032

 11.6.3 Post-Harvest Treatment Market Size & Forecast, By Product, 2021 – 2032

 11.6.4 Post-Harvest Treatment Market Size & Forecast, By Crop Type, 2021 – 2032

 11.6.5 Post-Harvest Treatment Market Size & Forecast, By Application, 2021 – 2032

 11.6.6 Post-Harvest Treatment Market Size & Forecast, By Mode of Application, 2021 – 2032

 11.6.7 Post-Harvest Treatment Market Size & Forecast, By End User, 2021 – 2032

 11.6.8 Post-Harvest Treatment Market Size & Forecast, By Country, 2021 – 2032

  11.6.8.1 UAE

   11.6.8.1.1 Post-Harvest Treatment Market Size & Forecast, By Origin, 2021 – 2032

   11.6.8.1.2 Post-Harvest Treatment Market Size & Forecast, By Product, 2021 – 2032

   11.6.8.1.3 Post-Harvest Treatment Market Size & Forecast, By Crop Type, 2021 – 2032

   11.6.8.1.4 Post-Harvest Treatment Market Size & Forecast, By Application, 2021 – 2032

   11.6.8.1.5 Post-Harvest Treatment Market Size & Forecast, By Mode of Application, 2021 – 2032

   11.6.8.1.6 Post-Harvest Treatment Market Size & Forecast, By End User, 2021 – 2032

  11.6.8.2 Saudi Arabia

   11.6.8.2.1 Post-Harvest Treatment Market Size & Forecast, By Origin, 2021 – 2032

   11.6.8.2.2 Post-Harvest Treatment Market Size & Forecast, By Product, 2021 – 2032

   11.6.8.2.3 Post-Harvest Treatment Market Size & Forecast, By Crop Type, 2021 – 2032

   11.6.8.2.4 Post-Harvest Treatment Market Size & Forecast, By Application, 2021 – 2032

   11.6.8.2.5 Post-Harvest Treatment Market Size & Forecast, By Mode of Application, 2021 – 2032

   11.6.8.2.6 Post-Harvest Treatment Market Size & Forecast, By End User, 2021 – 2032

  11.6.8.3 Qatar

   11.6.8.3.1 Post-Harvest Treatment Market Size & Forecast, By Origin, 2021 – 2032

   11.6.8.3.2 Post-Harvest Treatment Market Size & Forecast, By Product, 2021 – 2032

   11.6.8.3.3 Post-Harvest Treatment Market Size & Forecast, By Crop Type, 2021 – 2032

   11.6.8.3.4 Post-Harvest Treatment Market Size & Forecast, By Application, 2021 – 2032

   11.6.8.3.5 Post-Harvest Treatment Market Size & Forecast, By Mode of Application, 2021 – 2032

   11.6.8.3.6 Post-Harvest Treatment Market Size & Forecast, By End User, 2021 – 2032

  11.6.8.4 Egypt

   11.6.8.4.1 Post-Harvest Treatment Market Size & Forecast, By Origin, 2021 – 2032

   11.6.8.4.2 Post-Harvest Treatment Market Size & Forecast, By Product, 2021 – 2032

   11.6.8.4.3 Post-Harvest Treatment Market Size & Forecast, By Crop Type, 2021 – 2032

   11.6.8.4.4 Post-Harvest Treatment Market Size & Forecast, By Application, 2021 – 2032

   11.6.8.4.5 Post-Harvest Treatment Market Size & Forecast, By Mode of Application, 2021 – 2032

   11.6.8.4.6 Post-Harvest Treatment Market Size & Forecast, By End User, 2021 – 2032

  11.6.8.5 South Africa

   11.6.8.5.1 Post-Harvest Treatment Market Size & Forecast, By Origin, 2021 – 2032

   11.6.8.5.2 Post-Harvest Treatment Market Size & Forecast, By Product, 2021 – 2032

   11.6.8.5.3 Post-Harvest Treatment Market Size & Forecast, By Crop Type, 2021 – 2032

   11.6.8.5.4 Post-Harvest Treatment Market Size & Forecast, By Application, 2021 – 2032

   11.6.8.5.5 Post-Harvest Treatment Market Size & Forecast, By Mode of Application, 2021 – 2032

   11.6.8.5.6 Post-Harvest Treatment Market Size & Forecast, By End User, 2021 – 2032

  11.6.8.6 Rest of Middle East & Africa

   11.6.8.6.1 Post-Harvest Treatment Market Size & Forecast, By Origin, 2021 – 2032

   11.6.8.6.2 Post-Harvest Treatment Market Size & Forecast, By Product, 2021 – 2032

   11.6.8.6.3 Post-Harvest Treatment Market Size & Forecast, By Crop Type, 2021 – 2032

   11.6.8.6.4 Post-Harvest Treatment Market Size & Forecast, By Application, 2021 – 2032

   11.6.8.6.5 Post-Harvest Treatment Market Size & Forecast, By Mode of Application, 2021 – 2032

   11.6.8.6.6 Post-Harvest Treatment Market Size & Forecast, By End User, 2021 – 2032

12. Competitive Landscape

 12.1 Key Players' Positioning

 12.2 Competitive Developments

  12.2.1 Key Strategies Adopted (%), By Key Players, 2024

  12.2.2 Year-Wise Strategies & Development, 2021 – 2025

  12.2.3 Number Of Strategies Adopted By Key Players, 2024

 12.3 Market Share Analysis, 2024

 12.4 Product/Service & Product Benchmarking

  12.4.1 Product/Service Specifications & Features By Key Players

  12.4.2 Product/Service Heatmap By Key Players

  12.4.3 Product Heatmap By Key Players

 12.5 Industry Start-Up & Innovation Landscape

 12.6 Key Company Profiles

12.6 Key Company Profiles

 12.6.1 AgroFresh Solutions, Inc.

  12.6.1.1 Company Overview & Snapshot

  12.6.1.2 Product/Service Portfolio

  12.6.1.3 Key Company Financials

  12.6.1.4 SWOT Analysis

 12.6.2 Citrosol

  12.6.2.1 Company Overview & Snapshot

  12.6.2.2 Product/Service Portfolio

  12.6.2.3 Key Company Financials

  12.6.2.4 SWOT Analysis

12.6.3 Hazel Technologies Inc.

  12.6.3.1 Company Overview & Snapshot

  12.6.3.2 Product/Service Portfolio

  12.6.3.3 Key Company Financials

  12.6.3.4 SWOT Analysis

12.6.4 JBT Corporation

  12.6.4.1 Company Overview & Snapshot

  12.6.4.2 Product/Service Portfolio

  12.6.4.3 Key Company Financials

  12.6.4.4 SWOT Analysis

 12.6.5 Lytone Enterprise Inc.

  12.6.5.1 Company Overview & Snapshot

  12.6.5.2 Product/Service Portfolio

  12.6.5.3 Key Company Financials

  12.6.5.4 SWOT Analysis

 12.6.6 Xeda International S.A.S.

  12.6.6.1 Company Overview & Snapshot

  12.6.6.2 Product/Service Portfolio

  12.6.6.3 Key Company Financials

  12.6.6.4 SWOT Analysis

 12.6.7 Colin Campbell Chemicals Pty Ltd.

  12.6.7.1 Company Overview & Snapshot

  12.6.7.2 Product/Service Portfolio

  12.6.7.3 Key Company Financials

  12.6.7.4 SWOT Analysis

 12.6.8 Fomesa Fruitech

  12.6.8.1 Company Overview & Snapshot

  12.6.8.2 Product/Service Portfolio

  12.6.8.3 Key Company Financials

  12.6.8.4 SWOT Analysis

12.6.9 PostHarvest Technologies

  12.6.9.1 Company Overview & Snapshot

  12.6.9.2 Product/Service Portfolio

  12.6.9.3 Key Company Financials

  12.6.9.4 SWOT Analysis

12.6.10 Post Harvest Solution Ltd.

  12.6.10.1 Company Overview & Snapshot

  12.6.10.2 Product/Service Portfolio

  12.6.10.3 Key Company Financials

  12.6.10.4 SWOT Analysis

 12.6.11 Fine Chemicals Inc.

  12.6.11.1 Company Overview & Snapshot

  12.6.11.2 Product/Service Portfolio

  12.6.11.3 Key Company Financials

  12.6.11.4 SWOT Analysis

 12.6.12 Apeel Sciences

  12.6.12.1 Company Overview & Snapshot

  12.6.12.2 Product/Service Portfolio

  12.6.12.3 Key Company Financials

  12.6.12.4 SWOT Analysis

 12.6.13 Sufresca Ltd.

  12.6.13.1 Company Overview & Snapshot

  12.6.13.2 Product/Service Portfolio

  12.6.13.3 Key Company Financials

  12.6.13.4 SWOT Analysis

 12.6.14 KitoZyme, LLC

  12.6.14.1 Company Overview & Snapshot

  12.6.14.2 Product/Service Portfolio

  12.6.14.3 Key Company Financials

  12.6.14.4 SWOT Analysis

 12.6.15 Ceradis B.V.

  12.6.15.1 Company Overview & Snapshot

  12.6.15.2 Product/Service Portfolio

  12.6.15.3 Key Company Financials

  12.6.15.4 SWOT Analysis

 12.6.16 Jingold S.p.A.

  12.6.16.1 Company Overview & Snapshot

  12.6.16.2 Product/Service Portfolio

  12.6.16.3 Key Company Financials

  12.6.16.4 SWOT Analysis

 12.6.17 Symbiotech Research Pvt. Ltd.

  12.6.17.1 Company Overview & Snapshot

  12.6.17.2 Product/Service Portfolio

  12.6.17.3 Key Company Financials

  12.6.17.4 SWOT Analysis

 12.6.18 NTC Agri

  12.6.18.1 Company Overview & Snapshot

  12.6.18.2 Product/Service Portfolio

  12.6.18.3 Key Company Financials

  12.6.18.4 SWOT Analysis

 12.6.19 Agrosta SARL

  12.6.19.1 Company Overview & Snapshot

  12.6.19.2 Product/Service Portfolio

  12.6.19.3 Key Company Financials

  12.6.19.4 SWOT Analysis

 12.6.20 Decco Ibérica Postcosecha S.A.U.

  12.6.20.1 Company Overview & Snapshot

  12.6.20.2 Product/Service Portfolio

  12.6.20.3 Key Company Financials

  12.6.20.4 SWOT Analysis

13. Analyst Recommendations

 13.1 SNS Insider Opportunity Map

 13.2 Industry Low-Hanging Fruit Assessment

 13.3 Market Entry & Growth Strategy

 13.4 Analyst Viewpoint & Suggestions On Market Growth

14. Assumptions

15. Disclaimer

16. Appendix

 16.1 List Of Tables

 16.2 List Of Figures

Key Segments: 

By Origin

  • Natural

  • Synthetic

By Product

  • Coatings

  • Cleaners

  • Fungicides

  • Insecticides

  • Ethylene Blockers

  • Sanitizers

  • Others

By Crop Type

  • Cereals & Grains

  • Oilseeds & Pulses

  • Fruits & Vegetables

  • Flowers & Ornamentals

  • Others

By Application

  • Disease Control

  • Ripening Inhibition

  • Moisture Retention

  • Disinfection

  • Others

By Mode of Application

  • Spraying

  • Dipping

  • Fumigation

  • Coating

By End User

  • Growers

  • Packers

  • Others

Request for Segment Customization as per your Business Requirement: Segment Customization Request

Regional Coverage: 

North America

  • US

  • Canada

  • Mexico

Europe

  • Germany

  • France

  • UK

  • Italy

  • Spain

  • Poland

  • Turkey

  • Rest of Europe

Asia Pacific

  • China

  • India

  • Japan

  • South Korea

  • Singapore

  • Australia

  • Rest of Asia Pacific

Middle East & Africa

  • UAE

  • Saudi Arabia

  • Qatar

  • South Africa

  • Rest of Middle East & Africa

Latin America

  • Brazil

  • Argentina

  • Rest of Latin America

Request for Country Level Research Report: Country Level Customization Request

Available Customization 

With the given market data, SNS Insider offers customization as per the company’s specific needs. The following customization options are available for the report: 

  • Detailed Volume Analysis 

  • Criss-Cross segment analysis (e.g. Product X Application) 

  • Competitive Product Benchmarking 

  • Geographic Analysis 

  • Additional countries in any of the regions 

  • Customized Data Representation 

  • Detailed analysis and profiling of additional market players

An accurate research report requires proper strategizing as well as implementation. There are multiple factors involved in the completion of good and accurate research report and selecting the best methodology to compete the research is the toughest part. Since the research reports we provide play a crucial role in any company’s decision-making process, therefore we at SNS Insider always believe that we should choose the best method which gives us results closer to reality. This allows us to reach at a stage wherein we can provide our clients best and accurate investment to output ratio.

Each report that we prepare takes a timeframe of 350-400 business hours for production. Starting from the selection of titles through a couple of in-depth brain storming session to the final QC process before uploading our titles on our website we dedicate around 350 working hours. The titles are selected based on their current market cap and the foreseen CAGR and growth.


The 5 steps process:

Step 1: Secondary Research:

Secondary Research or Desk Research is as the name suggests is a research process wherein, we collect data through the readily available information. In this process we use various paid and unpaid databases which our team has access to and gather data through the same. This includes examining of listed companies’ annual reports, Journals, SEC filling etc. Apart from this our team has access to various associations across the globe across different industries. Lastly, we have exchange relationships with various university as well as individual libraries.

Secondary Research

Step 2: Primary Research

When we talk about primary research, it is a type of study in which the researchers collect relevant data samples directly, rather than relying on previously collected data.  This type of research is focused on gaining content specific facts that can be sued to solve specific problems. Since the collected data is fresh and first hand therefore it makes the study more accurate and genuine.

We at SNS Insider have divided Primary Research into 2 parts.

Part 1 wherein we interview the KOLs of major players as well as the upcoming ones across various geographic regions. This allows us to have their view over the market scenario and acts as an important tool to come closer to the accurate market numbers. As many as 45 paid and unpaid primary interviews are taken from both the demand and supply side of the industry to make sure we land at an accurate judgement and analysis of the market.

This step involves the triangulation of data wherein our team analyses the interview transcripts, online survey responses and observation of on filed participants. The below mentioned chart should give a better understanding of the part 1 of the primary interview.

Primary Research

Part 2: In this part of primary research the data collected via secondary research and the part 1 of the primary research is validated with the interviews from individual consultants and subject matter experts.

Consultants are those set of people who have at least 12 years of experience and expertise within the industry whereas Subject Matter Experts are those with at least 15 years of experience behind their back within the same space. The data with the help of two main processes i.e., FGDs (Focused Group Discussions) and IDs (Individual Discussions). This gives us a 3rd party nonbiased primary view of the market scenario making it a more dependable one while collation of the data pointers.

Step 3: Data Bank Validation

Once all the information is collected via primary and secondary sources, we run that information for data validation. At our intelligence centre our research heads track a lot of information related to the market which includes the quarterly reports, the daily stock prices, and other relevant information. Our data bank server gets updated every fortnight and that is how the information which we collected using our primary and secondary information is revalidated in real time.

Data Bank Validation

Step 4: QA/QC Process

After all the data collection and validation our team does a final level of quality check and quality assurance to get rid of any unwanted or undesired mistakes. This might include but not limited to getting rid of the any typos, duplication of numbers or missing of any important information. The people involved in this process include technical content writers, research heads and graphics people. Once this process is completed the title gets uploader on our platform for our clients to read it.

Step 5: Final QC/QA Process:

This is the last process and comes when the client has ordered the study. In this process a final QA/QC is done before the study is emailed to the client. Since we believe in giving our clients a good experience of our research studies, therefore, to make sure that we do not lack at our end in any way humanly possible we do a final round of quality check and then dispatch the study to the client.