Power Supply Unit Market Size & Trends:
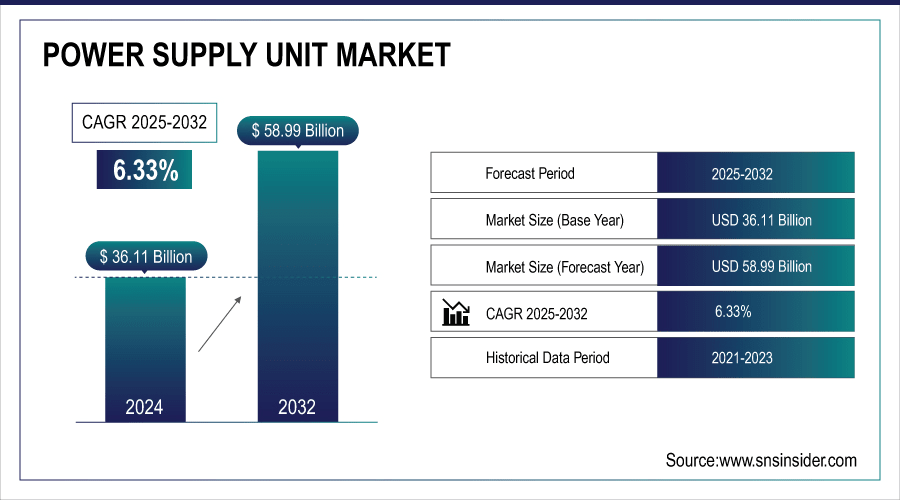
The Power Supply Unit Market size was valued at USD 36.11 Billion in 2024 and is projected to reach USD 58.99 Billion by 2032, growing at a CAGR of 6.33% during 2025-2032.
The global power supply unit (PSU) market is experiencing solid growth due to the growing worldwide need for energy efficient and higher power yielding solutions in consumer electronics, industrial automation, telecommunication, medical equipment and military. Compact designs, higher power density and improved thermal management are driving acceptance. The move to renewable energy and electric mobility is also driving demand for dependable and scalable PSUs. Regulatory and governmental incentives to increase energy efficiency continue to drive manufacturers to focus on AC-DC, DC-DC, and UPS solutions. Increase in smart grid, data centers, and industrial IoT is also fueling the integrated PSU market. In general, the market is headed toward intelligent, digitally enabled, application specific devices to provide stable and efficient power.
China has connected 5&6 units of the Hongyanhe Nuclear Power Station to the grid, the country’s biggest nuclear plant with a 6.71 GW combined capacity. The new ACPR-1000 reactors are intended to have improved safety and economics, consistent with China's target of 70 GW nuclear capacity by 2025. The plant will help cut CO₂ emissions dramatically and promote district heating in Northeast China.
To Get More Information On Power Supply Unit Market - Request Free Sample Report
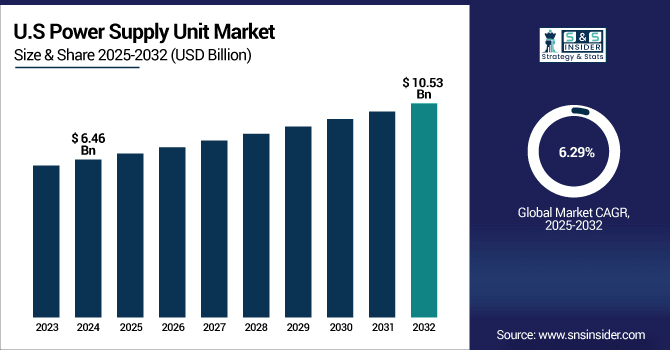
The U.S. Power Supply Unit Market size was valued at USD 6.46 Billion in 2024 and is projected to reach USD 10.53 Billion by 2032, growing at a CAGR of 6.29% during 2025-2032, driven by rising demand for energy-efficient electronics, growth in data centers, industrial automation, and advancements in electric vehicles. Moreover, with the Power Supply Unit growth in the adoption of renewable energy systems, along with numerous government endeavors aimed at energy efficiency, there is a rising demand for dependable, high-efficiency power supply solutions within industries.
Power Supply Unit Market Dynamics:
Drivers:
-
Rising GPU Power Demands and Multi-GPU Use Drive Growth and Innovation in the PSU Market
The power supply unit (PSU) market is growing aggressively, due to the increasing penetration of HPC, AI, AGP, and GPU. With the advancement of PCI-E generation, GPU performance is increased, with higher power consumption, and there is an increasing demand for high wattage and high efficiency power supply. Gaming, data center, and professional workstation systems have all begun to support multiple GPUs, and now PSUs are following suit with specialty models made just for these types of rigs.
Furthermore, modular PSU are now very common due to the versatility and space savings and less clutter from extraneous wires. Environmental concerns and regulatory pressures are also driving innovation toward greener power supplies, another factor contributing to the market growth. All these factors combined together bode well for the PSU market in the year ahead.
InWin introduces 1650W GPU-Only Power Supply with Quad 16-Pin Connectors InWin today announced the IW-1650W, a 1650W modular GPU power supply with quad 12V-2x6 pin connectors designed for multi-GPU gaming rigs, which meets new demanding PCIe 5.1 CEM standards.
Restraints:
-
Complex Regulatory Standards and High Production Costs Hinder Power Supply Unit Market Growth
The Power Supply Unit (PSU) market faces restraints due to increasingly complex regulatory standards aimed at energy efficiency and safety, which can slow down product development and increase compliance costs for manufacturers. Additionally, the rising cost of raw materials, such as semiconductors and electronic components, elevates production expenses, making high-performance PSUs more expensive for consumers. The technical challenges involved in designing reliable, high-wattage, and modular PSUs also contribute to longer development cycles. Furthermore, market competition from integrated power solutions and alternative energy technologies limits PSU demand in some sectors. These factors collectively restrict rapid market expansion and pose challenges to new entrants seeking to innovate while maintaining cost-effectiveness.
Opportunities:
-
Growing AI and Hyper scale Data Center Needs Accelerate Power Supply Unit Market Opportunities
The rapid expansion of AI technologies and hyperscale data centers is driving a significant demand for high-capacity and efficient power supply units (PSUs). With AI workloads getting more and more power-hungry, data center PSUs must be capable of higher wattage while consuming less power to feed high end GPUs and processors. This represents huge opportunities for manufacturers to capitalize on the latest technologies, such as GaN and SiC devices, to reduce power dissipation and enhance thermal performance. Moreover, adherence to industry standards, such as Open Rack and OCP increases product acceptance, which in turn is contributing to the generation of overall power supply unit market trends. Growing applications for scalable, efficient, and green power solutions set the stage for the PSU market to experience high growth in the next few years.
Navitas Semiconductor has introduced a 12 kW power source MegaBuck, targeted at high performance AI datacenters and boasting a combination of the most advanced GaN and SiC technologie offering higher efficiency. The PSU which reduces the power loss by 30% and supports high power rack capability 120KW, conforms to form factor of Open Rack v3 and OCP.
Challenges:
-
High Costs and Rapid Innovation Challenges Impede Power Supply Unit Market Growth
The Power Supply Unit (PSU) market faces several challenges that could impact its growth. High developmental and manufacturing costs of modern energy-efficient PSU's may inhibit affordability and less precisely targeting applications of such PSU's. The quick pace of technological change demands on-going innovation, and manufacturers are not immune from this pressure to stay relevant. The hardware base is diverse and constantly evolving, with compatibility being a difficult issue for design and integration.
Furthermore, the requirement to meet strict regulatory requirements and environmental laws will impose the complexity and costs of operations. Competitive pressures from alternative power solutions and the requirement for miniaturization without performance degradation are also significant challenges. These are challenges that call for strategic investment and innovation if we are to continue growing and to meet increasing demand for reliable, affordable power.
Power Supply Unit Market Segmentation Overview:
By Product Type
The AC-DC Power Supply segment held a dominant Power Supply Unit Market share of around 45% in 2024, and finds applications in the consumer electronics, industrial equipment, and telecommunications sectors. The rapid adoption of these devices and the growing need for efficient, reliable power conversion are driving force behind its innovation and market growth.
The DC-DC Power Supply segment is expected to experience the fastest growth in the Power Supply Unit Market over 2025-2032 with a CAGR of 6.70%, due to increasing demand in electric vehicles, renewable energy systems, and portable electronics. It has special capability to translate voltage levels for a variety of applications and increase the energy efficiency, thus being one of the good choices for automotive, industrial, and consumer applications.
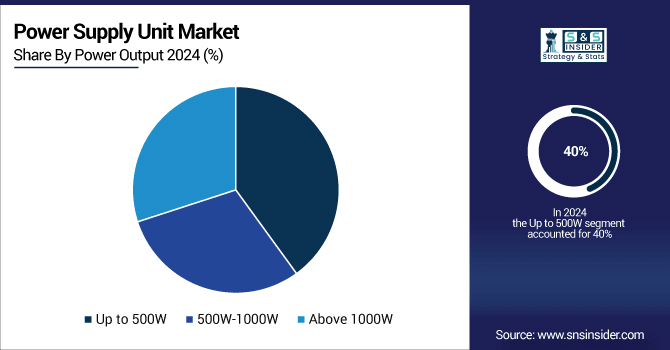
By Power Output
The Up to 500W segment held a dominant Power Supply Unit Market share of around 40% in 2024, on account of its extensive use in consumer electronics, small industrial equipment, IoT devices etc. Small form factor, efficiency, and cost effectiveness combine to ease the rising demand for robust power in low to medium power applications, driving continued market growth and widespread penetration across various verticals.
The 500W-1000W segment is expected to experience the fastest growth in the Power Supply Unit Market over 2025-2032 with a CAGR of 7.66%, owing to its rising demand for high performance computing, gaming, and industrial applications that need moderate to high power. Greater efficiency, scalability and support for high-end hardware contribute to its widespread use, along with the growing popularity of multi-GPU configurations and AI workloads, which act as another incentive for many users to opt for a reliable power supply in this output category.
By Application
Consumer Electronics segment is to hold the largest Power Supply Unit Market share revenue of around 41% in 2024, and expected to reach fastest growing segment during the forecast period of 2025-2032, due to the widespread use of smartphones, laptops, wearables, and smart home devices, driving consistent demand for efficient and compact power supplies. Rapid technological advancements, increasing adoption of IoT devices, and the need for reliable, energy-efficient power solutions fuel this segment’s growth. Additionally, rising consumer spending and growing awareness of energy conservation further boost market expansion, positioning.
By Distribution Channel
The Offline segment held a dominant Power Supply Unit Market share of around 63% in 2024, owing to its wide availability, cost competitiveness and compatibility with multiple devices. Its proven effectiveness in conventional applications and its market penetrability in various industries contribute to its sustainable demand, which is an essential growth factor in the market.
The Online segment is expected to experience the fastest growth in the Power Supply Unit Market over 2025-2032 with a CAGR of 10.79%. as more and more shoppers prefer to shop online, and a variety of PSU options available online. Better digital infrastructure, fast delivery and competitive pricing is contributing to the surge, in particular among gamers, DIY PC builders and tech capable pros.
Power Supply Unit Market Regional Analysis:
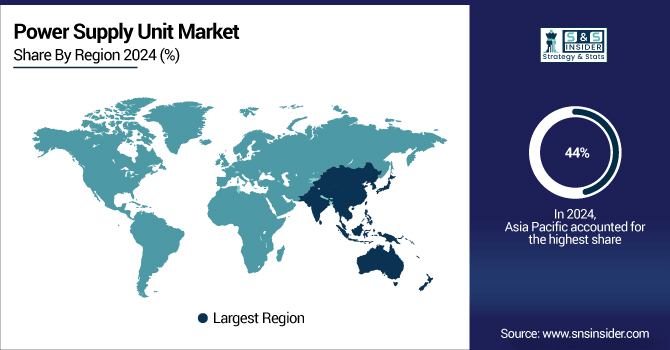
In 2024, the Asia Pacific dominated the Power Supply Unit market and accounted for 44% of revenue share, on account of robust electronics production, increasing demand for energy efficient products, and rising infrastructure in developing economy. Rapid industrialization, rising implementation of automation, and supportive government regulations to promote the technological and renewable energy inclusions are also some of the factors fueling the overall initiative strength.
Get Customized Report as Per Your Business Requirement - Enquiry Now
China's dominance in the Asia Pacific Power Supply Unit market with massive renewable energy projects including the 1GW solar-thermal project, demanding installation of higher capacity of efficient PSUs.
North America is projected to register the fastest CAGR of 7.32% during 2025-2032, is accelerating due to the rise in funding for AI, data centers, and electric vehicles. The growing digitalization in every sector, combined with increased usage of advanced computing installations and renewable energy assets is driving demand for ultra-high efficient and rugged power supply products.
The U.S. leads the domes for Power Supply Unit market, due to major demand from the data centers consumer electronics, and defense in the U.S. Fast-paced technological innovations and early acceptance of AI and IoT also drive the growth of the market.
In 2024, Europe emerged as a promising region in the Power Supply Unit, as huge investments are being made in renewable energy, electric vehicle and smart grid infrastructure in the region. The stringent energy efficiency standards in the region and the surge in focus on sustainability are spurring the demand for high-performance, high-efficiency power supplies in applications like the automotive sector, industrial automation, and consumer electronics.
LATAM and MEA is experiencing steady growth in the Power Supply Unit market, owing to growing electrification, industrial growth and consumer electronics consumption. This in turn is challenging infrastructure development and enabling the expansion of renewable energy investment by the government in these growing regions.
Key Players:
The Power Supply Unit Companies are Delta Electronics, Emerson Electric, LITE-ON Technology, Acbel Polytech, Salcomp, Siemens, Navitas Semiconductor, InWin, MEAN WELL, and TDK Corporation.
Recent Developments:
-
In May 2025, Delta Electronics unveiled AI-focused containerized data centers and 800V HVDC power solutions at COMPUTEX 2025, aiming to enhance energy efficiency and sustainability for next-gen AI infrastructure. These innovations support rapid deployment and advanced cooling for demanding AI workloads.
-
In April 2025, Emerson will launch its next-gen Branson Polaris ultrasonic welding platform this summer, integrating actuator, power supply, and controls for improved efficiency. The system offers advanced features and enhanced cybersecurity for diverse industries.
| Report Attributes | Details |
|---|---|
| Market Size in 2024 | USD 36.11 Billion |
| Market Size by 2032 | USD 58.99 Billion |
| CAGR | CAGR of 6.33% From 2025 to 2032 |
| Base Year | 2024 |
| Forecast Period | 2025-2032 |
| Historical Data | 2021-2023 |
| Report Scope & Coverage | Market Size, Segments Analysis, Competitive Landscape, Regional Analysis, DROC & SWOT Analysis, Forecast Outlook |
| Key Segments | • By Product Type(AC-DC Power Supply, DC-DC Power Supply, Uninterruptible Power Supply (UPS)) • By Power Output(Up to 500W, 500W-1000W, Above 1000W) • By Application(Consumer Electronics, Industrial Equipment, Telecommunications, Medical and Healthcare, Military and Aerospace, Others) • By Distribution Channel(Online, Offline) |
| Regional Analysis/Coverage | North America (US, Canada, Mexico), Europe (Germany, France, UK, Italy, Spain, Poland, Turkey, Rest of Europe), Asia Pacific (China, India, Japan, South Korea, Singapore, Australia, Taiwan, Rest of Asia Pacific), Middle East & Africa (UAE, Saudi Arabia, Qatar, South Africa, Rest of Middle East & Africa), Latin America (Brazil, Argentina, Rest of Latin America) |
| Company Profiles | The Power Supply Unit market companies are Delta Electronics, Emerson Electric, LITE-ON Technology, Acbel Polytech, Salcomp, Siemens, Navitas Semiconductor, InWin, MEAN WELL, and TDK Corporation. |
Frequently Asked Questions
Ans: Asia-Pacific dominated the Power Supply Unit Market in 2024.
Ans: The “AC-DC Power Supply” segment dominated the Power Supply Unit Market.
Ans: The key drivers of the Power Supply Unit Market are rising demand for energy-efficient electronics, rapid industrial automation, and increasing adoption of IoT and renewable energy systems.
Ans: Power Supply Unit Market size was valued at USD 36.11 Billion in 2024 and is projected to reach USD 58.99 Billion by 2032
Ans: The Power Supply Unit Market is expected to grow at a CAGR of 6.33% during 2025-2032.
Get in Touch
