Precipitated Silica Market Report Scope & Overview:
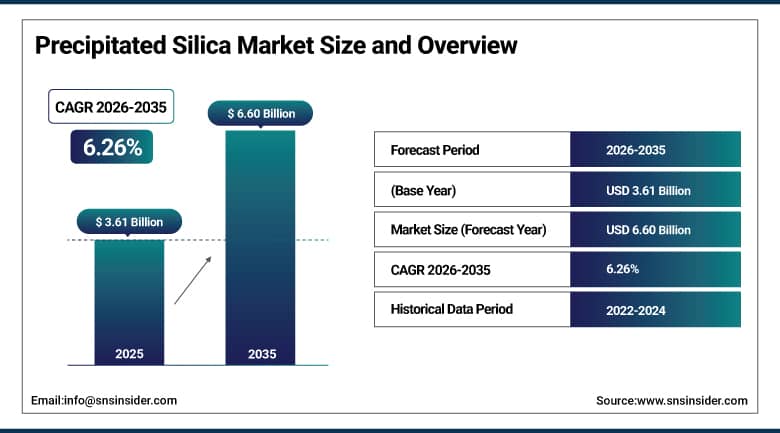
The Precipitated Silica Market was valued at USD 3.61 billion in 2025 and is expected to reach USD 6.60 billion by 2035, growing at a CAGR of 6.26% from 2026 to 2035.
Precipitated silica has quietly evolved into one of the most versatile and strategically important specialty chemicals in the global industrial landscape. Produced through a controlled chemical precipitation process that converts sodium silicate and sulfuric acid into a finely structured amorphous white powder, precipitated silica combines an exceptionally high surface area with tunable particle morphology, porosity, and surface chemistry that make it uniquely suited to an extraordinarily diverse range of functional applications. In the tire industry, it serves as the foundational reinforcing filler in fuel saving green tire compounds, replacing carbon black with a material that demonstrably reduces rolling resistance without sacrificing wet grip or durability. In oral care, it functions as the abrasive and cleaning agent in virtually every commercial toothpaste formulation on the market. In food processing, it acts as an anti-caking agent, carrier, and flow improver for powdered food ingredients across global supply chains. Its growing role in electric vehicle battery separator manufacturing, pharmaceutical excipient applications, and personal care formulation is steadily broadening the market's revenue base and attracting investment from major specialty chemical producers who are expanding capacity to meet rising demand across multiple end use verticals.
The U.S. Environmental Protection Agency estimates that reducing tire rolling resistance through precipitated silica reinforcement could save more than one billion gallons of fuel annually across the U.S. vehicle fleet alone, a figure that powerfully encapsulates why the tire and automotive sectors remain the single largest and most strategically important demand driver for the global precipitated silica market, with green tire adoption mandates spreading from Europe across Asia Pacific and North America creating a sustained multi decade demand tailwind for high performance rubber grade silica.
Precipitated Silica Market Size and Forecast
-
Market Size in 2025: USD 3.61 Billion
-
Market Size by 2035: USD 6.60 Billion
-
CAGR: 6.26% from 2026 to 2035
-
Base Year: 2025
-
Forecast Period: 2026 to 2035
-
Historical Data: 2022 to 2024
To Get More Information On Precipitated Silica Market - Request Free Sample Report
Precipitated Silica Market Trends
-
Rapidly accelerating adoption of green tire technology globally as automakers pursue rolling resistance reduction targets under increasingly stringent fuel economy and CO2 emission regulations, driving structural demand growth for high performance rubber grade precipitated silica across both replacement and OEM tire markets.
-
Growing incorporation of silica into electric vehicle battery separator membranes as EV manufacturers seek to improve thermal stability, ionic conductivity, and safety performance in lithium ion cell architectures, creating a new high growth end use segment beyond the traditional automotive tire application.
-
Expanding use of food grade and pharma grade precipitated silica as an excipient, anti caking agent, and carrier in processed food products, nutraceutical formulations, and pharmaceutical solid dosage manufacturing driven by growing consumer demand for flowable, shelf stable powdered product formats.
-
Increasing investment by leading precipitated silica producers in capacity expansion and process technology upgrades to meet rising demand while improving manufacturing energy efficiency and reducing environmental footprint across production sites in North America, Europe, and Asia Pacific.
-
Rising demand for ultra high purity and functionalized precipitated silica grades in electronics manufacturing, where silica is used as a moisture scavenger and performance enhancer in display devices, semiconductor packaging, and precision optics applications.
U.S. Precipitated Silica Market Size Outlook:
The U.S. Precipitated Silica Market was valued at USD 625 million in 2025 and is expected to reach USD 1.01 billion by 2035, registering a CAGR of approximately 6.2% during 2026 to 2035.
USA is considered to be the most commercially developed and technologically advanced national market for precipitated silica, being influenced by the high level of investments into specialty chemicals production, high demand from the largest tire and personal care industries in the world, and stable regulatory environment that brings predictability for producers and consumers alike. The demand for rubber grade precipitated silica has been driven by the tire fuel efficiency labeling requirement stipulated by the U.S. Energy Independence and Security Act. As a result, the silica reinforced tire compounds have become widely used both by original equipment manufacturers and replacement tire producers. The FDA GRAS approval for food grade precipitated silica, regulated by 21 CFR 172.480, has played an important role in making this material a popular choice among food additives, supporting the high demand from the USA's large processed foods and nutraceuticals production industry. Evonik Industries' mid double digit million euro capacity expansion at the Charleston, South Carolina plant that aims to increase North American production capacity by 50% shows the high level of confidence in U.S. market development during the forecast period.
The rapid scaling of domestic electric vehicle production by manufacturers including Tesla, Ford, General Motors, and new entrants is creating an important new demand vector for precipitated silica in battery separator applications, a segment that did not exist at meaningful commercial scale a decade ago but is now attracting dedicated product development investment from major silica producers seeking to establish early technical and commercial leadership in what could become one of the market's highest growth application categories through the second half of the forecast decade.

Precipitated Silica Market Segment Insights
-
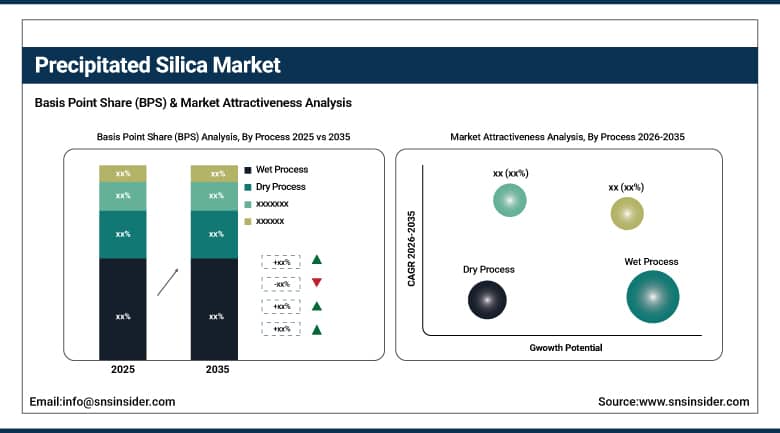
Based on Process, Wet Process accounted for the largest market share (~87%) in 2025; Dry Process expected to register the fastest growth through the forecast period.
-
Based on Grade, Rubber Grade accounted for the largest market share (~51%) in 2025; Dentifrice Grade expected to be the second largest, Food Grade the fastest growing grade through 2035.
-
Based on Application, Rubber Reinforcement accounted for the largest market share (~48%) in 2025; Battery Separators expected to be the fastest growing application through 2035.
-
Based on End Use Industry, Tire and Rubber dominated with the largest market share in 2025; Electronics and Personal Care expected to register the fastest growing end use CAGR.
By Process, Wet Process dominates; Dry Process emerging for specialty applications
The wet process constituted about 87% of the total precipitated silica produced globally in 2025, thus cementing its status as the most dominant manufacturing process. The wet process precipitation entails a well-controlled precipitation of the sodium silicate with a mineral acid in aqueous media followed by filtration, washing, and drying. In this process, manufacturers enjoy great flexibility in controlling particle size, surface area, and morphology through careful control of reaction temperature, pH, concentration, and rate. Due to its flexibility, this process allows the manufacture of specialized grades for specific uses from the same equipment in the areas of rubber, oral care products, foods, and cosmetics, among others.
Dry process precipitation, while representing a relatively small share of current production, is gaining attention for certain specialty applications where ultra fine particle size, distinctive surface chemistry, or specific morphological characteristics that are difficult to achieve through conventional wet chemistry are required. Research investment in advanced dry process manufacturing technology aimed at producing novel precipitated silica grades for electronics and high-performance coating applications is expected to gradually expand the commercial footprint of dry process production through the forecast period.
By Grade, Rubber Grade dominates; Dentifrice Grade holds strong position; Food Grade fastest growing
Rubber grade precipitated silica commanded approximately 51% of the global market in 2025, reflecting the sheer scale of the global tire and rubber goods manufacturing sector and the deepening penetration of silica-based tire compound formulations across vehicle categories. Rubber grade silica is engineered for high surface area, controlled aggregate structure, and optimized silane coupling agent reactivity that enables tire manufacturers to achieve the demanding combination of low rolling resistance, superior wet traction, and extended tread life required by both regulatory performance labeling programs and premium vehicle OEM specifications. The ongoing global transition from carbon black to silica reinforced tire compounds in passenger, truck, and specialty tire categories continues to create sustained volume demand growth across major producing regions.
Dentifrice grade precipitated silica ranks second in terms of global grade share, being used as the key abrasive and cleaning ingredient in toothpaste formulations in both mass and premium oral care products. The unique attributes of dentifrice grade precipitated silica include its controlled particle size distribution, purity, chemical inertness, and compatibility with fluoride active ingredients which make it an ideal abrasive ingredient for most leading oral care brands. Food grade precipitated silica is expected to witness the highest CAGR during the forecast period from 2021 to 2035 due to increasing use of processed and packaged foods in Asia Pacific and other emerging economies. Increasing urbanization in these regions is boosting the demand for shelf stable, free flowing powdered food ingredients utilizing the anti-caking properties of silica.
By Application, Rubber Reinforcement dominates; Battery Separators emerging as fastest growing
The rubber reinforcement segment made up about 48% of precipitated silica demand by end use in 2025, due to the essential nature of precipitated silica in manufacturing fuel-efficient tire compounds for the worldwide automotive industry. The formation of strong covalent bonds between silica and rubber polymer chains via organ silane coupling technology gives rise to a unique reinforcing effect which cannot be replicated by carbon black in reducing rolling resistance, making precipitated silica a must-have ingredient for tire makers in the increasingly competitive market of fuel-efficient tires. Demand growth for rubber reinforcement silica is strongly associated with automobile production volume, penetration rate of green tires, and expansion of performance tire labeling systems to more regions.
Oral care represents the second largest application segment, with silica serving as the primary abrasive in toothpaste across global oral hygiene product ranges. Its controlled cleaning efficiency, whitening capability, and formulation compatibility make it the standard abrasive choice for major consumer goods companies. Battery separator applications are expected to register the fastest CAGR through 2035, as the global electric vehicle production ramp drives demand for silica coated polyethylene separator membranes that improve thermal shutdown performance and ionic conductivity in lithium-ion battery cells. Food additive, coatings, agriculture, and personal care applications collectively represent important and growing demand segments that are diversifying the market's end use revenue base.
By End Use Industry, Tire and Rubber dominates; Electronics and Personal Care fastest growing
The tire and rubber end use industry maintained its dominant position in the precipitated silica market in 2025, accounting for the majority of global consumption by virtue of its scale, technical specification requirements, and the structural shift from carbon black to silica reinforced compound formulations across global tire manufacturing. Major tire producers including Michelin, Bridgestone, Goodyear, and Continental have progressively expanded their silica tire portfolios, creating sustained volume demand growth that benefits all major precipitated silica producers with established rubber grade product capabilities. Oral care and cosmetics, food and beverage, paints and coatings, agrochemicals, and electronics collectively represent growing end use segments whose combined contribution to market revenue is steadily increasing as precipitated silica application technology advances and producers develop new grades optimized for these industry requirements. Electronics is expected to be among the fastest growing end use segments through 2035, driven by rising demand for silica moisture scavengers, encapsulants, and performance modifiers in semiconductor, display, and optoelectronics manufacturing.
Precipitated Silica Market Regional Analysis:
|
Region |
Major Country |
Share within Region (%) |
|---|---|---|
|
North America |
United States |
33% |
|
Europe |
Germany |
28% |
|
Asia Pacific |
China |
45% |
|
Middle East & Africa |
Saudi Arabia |
27% |
|
Latin America |
Brazil |
46% |
Asia Pacific Precipitated Silica Market Insights
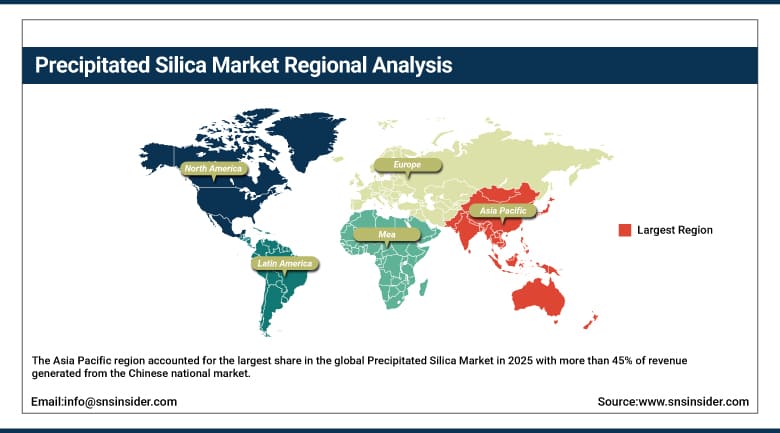
The Asia Pacific region accounted for the largest share in the global Precipitated Silica Market in 2025 with more than 45% of revenue generated from the Chinese national market, being the largest tire producer and consumer in the region. The huge tire production base, growing EVs manufacturing industry, burgeoning oral care consumer market, and large scale processed food manufacturing sector make China the largest national market for precipitated silica in the world. India is a rising market due to growing tire manufacturing capacity in the country, rising consumer goods manufacturing, and government initiatives in developing the specialty chemicals manufacturing industry in the country. Japan and South Korea contribute due to their high-end tire manufacturing, electronics, and personal care manufacturing industries, which use high specification grades of precipitated silica at premium prices.
Get Customized Report as Per Your Business Requirement - Enquiry Now
North America Precipitated Silica Market Insights
North America is the fastest growing region in the global Precipitated Silica Market during the forecast period, with the United States representing the dominant national market. The U.S. market was valued at approximately USD 625 million in 2025 and is projected to reach USD 1.01 billion by 2035, with strong demand from the large domestic tire manufacturing base, the world's largest oral care consumer market, and growing electric vehicle production. Regulatory drivers including tire fuel efficiency labeling and tightening EPA emissions standards are reinforcing structural demand for rubber grade silica. Evonik's significant Charleston capacity expansion underscores major producer commitment to serving North American demand growth. Canada contributes through its automotive manufacturing sector and growing food processing industry demand for anti-caking and flow improvement applications.
Europe Precipitated Silica Market Insights
In 2025, Europe held a considerable share of the global Precipitated Silica Market. Germany, France, and Belgium were the leading countries in this region in terms of market performance. Europe was the birthplace of green tires, and due to its regulatory leadership concerning tire rolling resistance labeling in accordance with the EU Regulation 1222/2009, this region became the global leader in using silica in tires. There is a highly developed personal care and cosmetics sector in Europe, which involves a number of French and German consumer goods companies; therefore, there is considerable demand for dental grade and cosmetic grade silica in the region. Europe also has established standards of food safety regulation concerning food grade silica provided by EFSA.
Middle East & Africa and Latin America Precipitated Silica Market Insights
The Middle East and Africa and Latin America represent emerging growth markets for precipitated silica, with Brazil leading Latin America at approximately 46% of regional revenue, supported by its significant domestic tire production capacity, large agro industrial sector, and growing personal care manufacturing industry. Saudi Arabia leads the MEA market, driven by expanding downstream chemical manufacturing ambitions under Vision 2030, growing tire imports and local manufacturing investment, and a large consumer goods market. Sub Saharan African markets represent longer term growth opportunities as industrialization and consumer market development gradually expand demand for specialty silica across tire, food, and personal care applications.
Precipitated Silica Market Growth Drivers:
-
Green tire mandates and electric vehicle proliferation creating structural, multi decade demand growth for high performance precipitated silica.
The single most powerful growth driver for the Precipitated Silica Market is the global automotive industry's irreversible structural transition toward fuel efficient green tire compounds, where precipitated silica is the technically essential and non-substitutable reinforcing filler that enables the rolling resistance reduction demanded by regulatory performance standards across North America, Europe, Japan, China, and South Korea. Every new vehicle sold globally is increasingly likely to be fitted with silica reinforced tires, and the expanding replacement tire market ensures a growing recurring demand stream that parallels vehicle fleet expansion. The rapid global scaling of electric vehicle production is amplifying this dynamic in two ways simultaneously, first through the inherently higher rolling resistance sensitivity of heavier electric vehicles that makes silica compound optimization commercially essential, and second through the entirely new demand stream from battery separator applications that is creating a structurally important new revenue segment for silica producers with the right product development capabilities.
ETRMA data confirming a 3.5% year on year rise in silica reinforced tire demand across European markets in 2024, combined with China's mandatory tire label implementation extending green tire requirements to the world's largest national vehicle market, signals that the global tire industry's structural shift toward precipitated silica reinforcement is accelerating rather than plateauing, creating compounding demand momentum that is expected to sustain above market average volume growth for rubber grade precipitated silica producers through 2035.
Precipitated Silica Market Restraints:
-
Raw material price volatility and energy intensive manufacturing constraining margin stability and limiting capacity investment returns.
A significant constraint on the Precipitated Silica Market is the vulnerability of the economics of manufacturing to fluctuations in the prices of raw materials used in production, which include sodium silicate and sulfuric acid, and which may change substantially due to changes in the prices of energy, sulfur, and other factors in the supply chain of chemicals. The manufacture of precipitated silica is highly energy-intensive, as the process involves considerable amounts of heat in the drying and processing phases, and is therefore highly sensitive to any changes in prices of natural gas and electricity, thereby affecting the economics of production. The capital-intensive nature of setting up new capacity for manufacturing precipitated silica, together with the challenge of qualifying new products by customers in end use industries such as tires, pharmaceuticals, and food, results in long payback periods for investments.
Precipitated Silica Market Opportunities:
-
EV battery separators, bio-based silica development, and specialty grade innovation for electronics and cosmetics.
The electric vehicle revolution is creating the most significant new application opportunity for the precipitated silica industry in a generation, with silica coated battery separators representing a high value, technically sophisticated, and rapidly scaling demand segment that current capacity investments are beginning to target. Producers with the product development expertise to engineer silica grades optimized for separator coating applications, meeting the demanding requirements for particle size uniformity, surface chemistry, and dispersibility in aqueous coating systems, are positioning themselves to capture premium pricing and long-term supply agreements in this strategically important new market. Simultaneously, the growing interest in sustainable raw material sourcing across the chemical industry is creating opportunity for producers developing bio-based silica extraction technologies from agricultural byproducts including rice husk ash, which could offer both cost and sustainability credentials that resonate strongly with environmentally conscious end users in food, personal care, and cosmetics markets.
Recent Developments:
-
2026: Evonik Industries completed the expansion of its Charleston, South Carolina precipitated silica facility, adding approximately 50% to North American production capacity, directly targeting the growing U.S. rubber grade silica demand from both OEM and replacement tire manufacturers responding to federal fuel efficiency labeling requirements.
-
2025 (May): Solvay announced a strategic partnership with a leading EV battery manufacturer to co-develop next generation silica coated separator materials for lithium-ion battery cells, combining Solvay's precipitated silica surface engineering expertise with the battery partner's large format cell production knowledge to create application specific silica grades for this rapidly emerging market segment.
-
2024 (September): PPG Industries completed an upgrade of its precipitated silica production process at a North American facility, incorporating advanced waste water treatment and byproduct recovery technology that reduced sodium sulfate byproduct generation by 30%, improving the environmental footprint of production and reducing wastewater management costs while maintaining product quality.
-
2024 (March): Madhu Silica Pvt. Ltd. announced a significant capacity expansion at its Kutch, Gujarat facility in India, adding 50,000 metric tons per year of new rubber and dentifrice grade precipitated silica production capacity to serve growing domestic demand from Indian tire manufacturers and multinational oral care companies expanding their Indian manufacturing operations.
-
2025 (February): Huber Engineered Materials introduced a new line of ultra-high purity food grade precipitated silica grades specifically engineered for nutraceutical and dietary supplement powder applications, targeting the rapidly growing global supplements market with silica products that meet the most stringent heavy metal and impurity specifications across all major global pharmacopeias.
Precipitated Silica Market Key Players:
-
Evonik Industries AG
-
Solvay S.A.
-
PPG Industries Inc.
-
W.R. Grace & Co.
-
Huber Engineered Materials (J.M. Huber Corporation)
-
Madhu Silica Pvt. Ltd.
-
PQ Corporation
-
Tosoh Silica Corporation
-
Quechen Silicon Chemical Co. Ltd.
-
Fujian Zhengsheng Inorganic Material Co. Ltd.
-
Zhuzhou Xinglong New Material Co. Ltd.
-
Tata Chemicals Ltd.
-
IQE Group
-
Anten Chemical Co. Ltd.
-
MLA Group
-
Elkem Silicones
-
Cabot Corporation
-
Oriental Silicas Corporation
-
Alibek Silica Co. Ltd.
-
Gujarat Multi Gas Base Chemicals Pvt. Ltd.
Precipitated Silica Market Report Scope:
| Report Attributes | Details |
|---|---|
| Market Size in 2025 | USD 3.61 Billion |
| Market Size by 2035 | USD 6.60 Billion |
| CAGR | CAGR of 6.26% From 2026 to 2035 |
| Base Year | 2025 |
| Forecast Period | 2026-2035 |
| Historical Data | 2022-2024 |
| Report Scope & Coverage | Market Size, Segments Analysis, Competitive Landscape, Regional Analysis, DROC & SWOT Analysis, Forecast Outlook |
| Key Segments | • By Grade (Rubber Grade, Dentifrice Grade, Food Grade, Cosmetic Grade, Others) • By Process (Wet Process, Dry Process) • By Application (Rubber Reinforcement, Oral Care, Food Additives, Coatings and Inks, Battery Separators, Agriculture, Personal Care, Others) • By End Use Industry (Tire and Rubber, Oral Care and Cosmetics, Food and Beverage, Paints and Coatings, Agrochemicals, Electronics, Others) |
| Regional Analysis/Coverage | North America (US, Canada, Mexico), Europe (Eastern Europe [Poland, Romania, Hungary, Turkey, Rest of Eastern Europe] Western Europe] Germany, France, UK, Italy, Spain, Netherlands, Switzerland, Austria, Rest of Western Europe]), Asia Pacific (China, India, Japan, South Korea, Vietnam, Singapore, Australia, Rest of Asia Pacific), Middle East & Africa (Middle East [UAE, Egypt, Saudi Arabia, Qatar, Rest of Middle East], Africa [Nigeria, South Africa, Rest of Africa], Latin America (Brazil, Argentina, Colombia, Rest of Latin America) |
| Company Profiles | Evonik Industries AG, Solvay S.A., PPG Industries Inc., W.R. Grace & Co., Huber Engineered Materials (J.M. Huber Corporation), Madhu Silica Pvt. Ltd., PQ Corporation, Tosoh Silica Corporation, Quechen Silicon Chemical Co. Ltd., Fujian Zhengsheng Inorganic Material Co. Ltd., Zhuzhou Xinglong New Material Co. Ltd., Tata Chemicals Ltd., IQE Group, Anten Chemical Co. Ltd., MLA Group, Elkem Silicones, Cabot Corporation, Oriental Silicas Corporation, Alibek Silica Co. Ltd., Gujarat Multi Gas Base Chemicals Pvt. Ltd. |
Frequently Asked Questions
Ans: The Precipitated Silica Market is expected to grow at a CAGR of 6.26% from 2026 to 2035.
Ans: The Precipitated Silica Market was valued at USD 3.61 billion in 2025.
Ans: The global transition toward green tire technology driven by regulatory rolling resistance and fuel efficiency standards, combined with growing electric vehicle production creating new demand in battery separator applications and expanding use across oral care, food, personal care, and electronics industries, constitutes the primary structural growth driver through 2035.
Ans: The Rubber Grade segment dominated the Precipitated Silica Market in 2025 with approximately 51% of global revenue, driven by its essential role as the primary reinforcing filler in fuel efficient green tire compounds across OEM and replacement tire markets globally.
Ans: Asia Pacific dominated the Precipitated Silica Market in 2025, led by China which serves as the world's largest tire manufacturing base and is the single largest national consumer of rubber grade precipitated silica, alongside strong demand from the region's growing oral care, food processing, and electric vehicle battery manufacturing sectors.
Get in Touch
