Ferrochrome Market Report Scope & Overview:
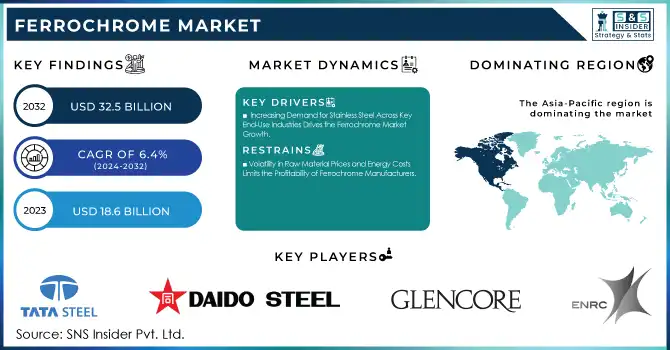
The Ferrochrome Market Size was valued at USD 18.6 billion in 2023 and is expected to reach USD 32.5 billion by 2032 and grow at a CAGR of 6.4% over the forecast period 2024-2032.
Get E-PDF Sample Report on Ferrochrome Market - Request Sample Report
The Ferrochrome market continues to evolve, driven by its essential role in producing stainless steel and various other alloys, critical across industries like automotive, construction, and aerospace. Demand for high-quality stainless steel is increasing as industries prioritize durability and corrosion resistance, fueling the need for ferrochrome. Additionally, environmental concerns are shaping the production processes, with companies embracing innovations to reduce emissions and energy consumption. Recent advancements highlight the industry’s focus on sustainable practices, such as Tata Steel’s successful biomass trial for ferrochrome production in July 2024. This initiative demonstrated the feasibility of using renewable energy sources in smelting operations, aligning with global sustainability goals and setting a benchmark for greener metallurgical processes.
Capacity expansions and strategic collaborations mark the competitive landscape. For example, Metso secured a major order in January 2024 to design and supply equipment for FACOR’s new ferrochrome plant in India, showcasing the industry's investment in modernizing production facilities to meet growing demand. On the operational front, Merafe reported a 2% increase in ferrochrome output during the first nine months of 2024, highlighting efficiency improvements and stable production in challenging market conditions. These developments underscore the market's resilience and ability to adapt through technological innovation and strategic investments. The confluence of these dynamic factors ensures that the ferrochrome sector remains a vital component of industrial progress.
Ferrochrome Market Dynamics:
Drivers:
-
Increasing Demand for Stainless Steel Across Key End-Use Industries Drives the Ferrochrome Market Growth
The global reliance on stainless steel for various applications has been a major driver for the ferrochrome market. Stainless steel, known for its strength, durability, and resistance to corrosion, is widely used in the automotive, construction, and consumer goods industries. In the automotive sector, stainless steel components such as exhaust systems and structural reinforcements are in high demand due to their ability to withstand extreme conditions while ensuring lightweight properties. The construction sector utilizes stainless steel in high-rise buildings, bridges, and modern architectural designs, where strength and aesthetic appeal are crucial. Consumer goods manufacturers rely on stainless steel for durable and hygienic kitchen appliances, cutlery, and cookware. As urbanization and industrialization accelerate in emerging economies, particularly in Asia-Pacific, demand for stainless steel and, consequently, ferrochrome is increasing. For example, large-scale infrastructure projects in India and China are contributing significantly to the consumption of stainless steel. Additionally, advancements in manufacturing processes have enabled the production of higher-grade stainless steel for specialized applications, further driving ferrochrome usage globally.
-
Rising Infrastructure Development in Emerging Economies Spurs Ferrochrome Consumption in the Construction Sector
-
Stringent Regulations Pushing the Adoption of Energy-Efficient and Low-Emission Ferrochrome Production Technologies
The ferrochrome industry is undergoing a transformation to meet stringent environmental regulations aimed at reducing carbon emissions and energy consumption. Governments and international organizations are pressuring industries to adopt greener production methods, including energy-efficient smelting technologies and renewable energy integration. Companies are innovating by using advanced equipment, such as waste heat recovery systems and electric arc furnaces, to achieve compliance while enhancing operational efficiency. A notable example is Tata Steel’s biomass trial for ferrochrome production, completed in 2024, which demonstrated the feasibility of renewable energy sources in the smelting process. This shift not only helps companies reduce their carbon footprint but also aligns with global sustainability goals, attracting environmentally conscious investors and customers. Compliance with such regulations is becoming a key differentiator, as companies that prioritize sustainability gain a competitive edge. However, these innovations often come with high initial costs, posing a challenge for small-scale producers. Nevertheless, the trend toward sustainable production is expected to reshape the industry, with significant long-term benefits for both producers and the environment.
Restraint:
-
Volatility in Raw Material Prices and Energy Costs Limits the Profitability of Ferrochrome Manufacturers
The ferrochrome market faces significant challenges from raw material and energy price fluctuations. Chromite ore, the key raw material, experiences price volatility due to supply-demand imbalances, geopolitical tensions, and mining restrictions. Additionally, ferrochrome production is energy-intensive, with rising electricity tariffs and unstable energy supplies further driving up costs. Producers in regions with unreliable energy infrastructure face reduced competitiveness. While manufacturers are adopting renewable energy and energy-efficient technologies to mitigate these issues, the high capital investment required poses challenges, especially for smaller players. These factors create market uncertainty, impacting profitability and growth.
Opportunity:
-
Growing Investments in Renewable Energy Integration for Ferrochrome Smelting Processes Offer a Lucrative Growth Opportunity
-
Collaborations Between Key Industry Players and Research Institutes Drive Innovation and Market Expansion
Partnerships between ferrochrome manufacturers and research institutes foster innovation and drive market growth. These collaborations enable the development of advanced production techniques, such as low-emission smelting processes and high-purity ferrochrome grades for specialized applications. Additionally, joint ventures and strategic alliances help companies expand their geographic reach, particularly in emerging markets with growing demand for ferrochrome. By leveraging shared expertise and resources, these partnerships create opportunities for market players to enhance their competitiveness and sustainability.
Challenge:
-
Stringent Environmental Regulations and Emission Norms Pose Operational Challenges for Ferrochrome Producers
The ferrochrome industry faces mounting pressure to meet strict environmental regulations targeting emissions and ecological impact. Energy-intensive smelting processes, a major source of greenhouse gases, require costly investments in pollution control technologies and renewable energy. While improving sustainability, these measures raise production costs, challenging small and medium-sized manufacturers. Non-compliance risks fines, shutdowns, and reputational harm, making regulatory compliance a critical yet costly balancing act for the industry.
Production and Consumption Trends in the Ferrochrome Market
The ferrochrome market has witnessed notable shifts in production and consumption trends driven by technological advancements, environmental regulations, and growing demand from key industries.
|
Trend |
Description |
Impact |
|
Shift to Renewable Energy Sources |
Companies adopting renewable energy for ferrochrome production to reduce emissions. |
Lower production costs and improved sustainability of operations. |
|
Rise in Stainless Steel Demand |
Increased consumption of ferrochrome driven by the growing stainless steel market in construction. |
Higher ferrochrome production volumes to meet industry-specific demands. |
|
Technological Advancements in Smelting |
Deployment of energy-efficient smelting technologies. |
Reduced energy consumption and lower environmental impact. |
|
Regional Production Shifts |
Growth of ferrochrome production in Asia-Pacific due to cost advantages and resource availability. |
Increased competition for established producers in Europe and North America. |
|
Chromite Ore Scarcity Concerns |
Limited chromite ore reserves in certain regions, causing production challenges. |
Shift toward optimizing resource utilization and exploring new reserves. |
The ferrochrome market is adapting to multiple dynamic trends, with sustainability playing a pivotal role. For instance, the use of renewable energy sources by leading producers helps reduce environmental footprints and aligns with stricter regulations. Meanwhile, rising demand for stainless steel, particularly in the construction and automotive sectors, has led to an upsurge in ferrochrome consumption. The adoption of advanced smelting technologies enables cost-effective and eco-friendly production. Additionally, regional shifts in production, especially in Asia-Pacific, underscore the growing influence of emerging economies in the global ferrochrome trade. However, challenges such as chromite ore scarcity persist, prompting the exploration of new reserves and innovative resource management strategies.
Ferrochrome Market Segments
By Type
High Carbon Ferrochrome dominated the Ferrochrome Market in 2023 with a market share of around 70%. High carbon ferrochrome is primarily used in the production of stainless steel, which continues to be the largest consumer of ferrochrome globally. The high carbon variety, due to its cost-effectiveness and superior alloying properties, is the most widely produced and consumed. It is particularly sought after in industries requiring a high degree of strength and durability, such as construction and automotive manufacturing. Major ferrochrome producers, such as Glencore and Ferro Alloys Corporation, continue to focus on high carbon ferrochrome production to meet the rising demand in these industries.
By Application
Stainless Steel application dominated the Ferrochrome Market in 2023 with a market share of approximately 85%. Ferrochrome is predominantly used in the production of stainless steel due to its crucial role in enhancing the alloy’s corrosion resistance, strength, and durability. As stainless steel is vital in industries like construction, automotive, and manufacturing, the demand for ferrochrome in stainless steel production remains robust. For instance, companies like Outokumpu and Acerinox continue to invest in advanced stainless steel production technologies, further solidifying ferrochrome’s role in this application. The rise in global infrastructure development and automotive manufacturing has bolstered this trend.
By End-use Industry
The Automotive industry dominated the Ferrochrome Market in 2023 with a market share of around 40%. The demand for ferrochrome in the automotive industry has been significantly driven by the increasing need for high-strength stainless steel and alloy components, which are essential for the production of vehicle body parts and engine components. The automotive sector's drive towards producing more durable, fuel-efficient, and safe vehicles has heightened the need for high-quality materials like stainless steel, where ferrochrome plays a pivotal role. Leading automotive manufacturers such as Toyota and Ford continue to prioritize the use of stainless steel, consequently influencing the higher demand for ferrochrome in this segment.
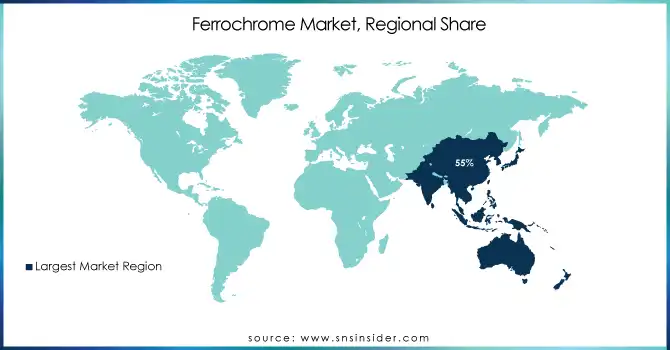
Ferrochrome Market Regional Analysis
Asia-Pacific dominated the Ferrochrome Market in 2023 with a market share of around 55%. The region's dominance is primarily driven by the large-scale production and consumption of ferrochrome in countries like China, India, and Japan. China, being the world's largest producer and consumer of ferrochrome, accounts for a significant share of global ferrochrome demand, with a substantial portion used in its thriving stainless st eel industry. For example, China’s total ferrochrome production in 2023 reached approximately 3.5 million metric tons, driven by its vast stainless steel sector, which saw continued growth in both production and consumption. India, another major player in the region, produces a substantial portion of its ferrochrome for domestic use in stainless steel production and exports. The Indian ferrochrome market, with key producers like Tata Steel and Ferro Alloys Corporation, continues to expand its production capacities, benefiting from the region’s relatively low production costs and abundant raw material resources. Additionally, Japan's demand for ferrochrome is supported by its advanced manufacturing sectors, particularly automotive and electronics, which use high-quality stainless steel. The strategic positioning of these countries, supported by a strong industrial base and resource availability, enables Asia-Pacific to maintain its dominance in the global ferrochrome market.
Get Customized Report as Per Your Business Requirement - Request For Customized Report
Key Players
-
Daido Steel Co. Ltd (High Carbon Ferrochrome, Low Carbon Ferrochrome)
-
Eurasian Resources Group (High Carbon Ferrochrome, Charge Chrome)
-
Ferro Alloys Co. Ltd. (High Carbon Ferrochrome, Low Carbon Ferrochrome)
-
Glencore (High Carbon Ferrochrome, Charge Chrome)
-
Hernic Ferrochrome Ltd (High Carbon Ferrochrome, Low Carbon Ferrochrome)
-
International Ferro Metals Ltd. (High Carbon Ferrochrome, Charge Chrome)
-
Merafe Resources Ltd. (High Carbon Ferrochrome, Charge Chrome)
-
Samancor Chrome Ltd. (High Carbon Ferrochrome, Medium Carbon Ferrochrome)
-
Shanxi Jiang County Minmetal Co Ltd. (High Carbon Ferrochrome, Low Carbon Ferrochrome)
-
TATA Steel (High Carbon Ferrochrome, Medium Carbon Ferrochrome)
-
Afarak Group (High Carbon Ferrochrome, Medium Carbon Ferrochrome)
-
Balasore Alloys Ltd. (High Carbon Ferrochrome, Low Carbon Ferrochrome)
-
Century Enka Ltd. (High Carbon Ferrochrome, Medium Carbon Ferrochrome)
-
Chandan Steel Limited (High Carbon Ferrochrome, Low Carbon Ferrochrome)
-
China Steel Corporation (High Carbon Ferrochrome, Charge Chrome)
-
Elkem ASA (High Carbon Ferrochrome, Low Carbon Ferrochrome)
-
Ferrosilicon Alloys (Pty) Ltd. (High Carbon Ferrochrome, Charge Chrome)
-
Jindal Stainless Steel Ltd. (High Carbon Ferrochrome, Low Carbon Ferrochrome)
-
Manganese Metal Company (High Carbon Ferrochrome, Low Carbon Ferrochrome)
-
Zimasco (Private) Ltd. (High Carbon Ferrochrome, Medium Carbon Ferrochrome)
Recent Developments
-
July 2024: Tata Steel completed a successful biomass trial at its ferrochrome production facility in Odisha, India. This trial aimed to reduce CO2 emissions by substituting traditional fossil fuels with biomass, aligning with the company's sustainability goals.
-
September 2023: Indian Metals and Ferro Alloys Ltd. revealed plans to expand its existing ore mining capacity and establish a new greenfield smelting facility in Kalinganagar, Odisha, to meet the growing domestic demand for stainless steel.
| Report Attributes | Details |
|---|---|
| Market Size in 2023 | US$ 18.6 Billion |
| Market Size by 2032 | US$ 32.5 Billion |
| CAGR | CAGR of 6.4% From 2024 to 2032 |
| Base Year | 2023 |
| Forecast Period | 2024-2032 |
| Historical Data | 2020-2022 |
| Report Scope & Coverage | Market Size, Segments Analysis, Competitive Landscape, Regional Analysis, DROC & SWOT Analysis, Forecast Outlook |
| Key Segments | •By Type (High Carbon, Medium Carbon, Low Carbon) •By Application (Stainless Steel, Cast Iron, Powder Metallurgy, Others) •By End-Use Industry (Automotive, Construction, Aerospace, Energy, Others) |
| Regional Analysis/Coverage | North America (US, Canada, Mexico), Europe (Eastern Europe [Poland, Romania, Hungary, Turkey, Rest of Eastern Europe] Western Europe] Germany, France, UK, Italy, Spain, Netherlands, Switzerland, Austria, Rest of Western Europe]), Asia Pacific (China, India, Japan, South Korea, Vietnam, Singapore, Australia, Rest of Asia Pacific), Middle East & Africa (Middle East [UAE, Egypt, Saudi Arabia, Qatar, Rest of Middle East], Africa [Nigeria, South Africa, Rest of Africa], Latin America (Brazil, Argentina, Colombia, Rest of Latin America) |
| Company Profiles | Eurasian Resources Group, Merafe Resources Ltd., Hernic Ferrochrome Ltd, TATA Steel, International Ferro Metals Ltd., Samancor Chrome Ltd., Ferro Alloys Co. Ltd., Shanxi Jiang County Minmetal Co Ltd., Daido Steel Co. Ltd, Glencore and other key players |
| Key Drivers | •Rising Infrastructure Development in Emerging Economies Spurs Ferrochrome Consumption in the Construction Sector • Stringent Regulations Pushing the Adoption of Energy-Efficient and Low-Emission Ferrochrome Production Technologies |
| Restraints | •Volatility in Raw Material Prices and Energy Costs Limits the Profitability of Ferrochrome Manufacturers |
Frequently Asked Questions
Ans: Asia-Pacific dominated the Ferrochrome Market in 2023 with a 55% market share, driven by large-scale production and consumption in China, India, and Japan, supported by robust stainless steel industries and abundant resources.
Ans: Stringent environmental regulations and emission norms are increasing operational challenges for ferrochrome producers, requiring costly investments in pollution control technologies and renewable energy while balancing compliance with profitability.
Ans: Growing investments in renewable energy integration for ferrochrome smelting, the expanding use of high-carbon ferrochrome in specialty steel, and collaborations between industry players and research institutes are driving market opportunities, fostering sustainability, and enhancing product innovation.
Ans: The Ferrochrome Market Size was valued at USD 18.6 billion in 2023 and is expected to reach USD 32.5 billion by 2032
Ans: The Ferrochrome Market is expected to grow at a CAGR of 6.4%
Get in Touch
