Prescriptive Analytics Market Report Scope & Overview:
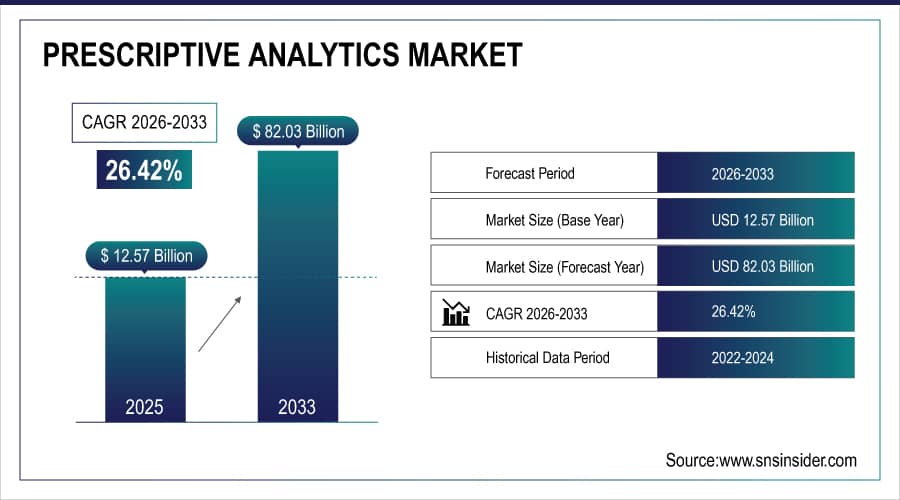
The Prescriptive Analytics Market was valued at USD 12.57 billion in 2025E and is expected to reach USD 82.03 billion by 2033, growing at a CAGR of 26.42% from 2026-2033. With the increasing adoption of technologies, such as such as AI, IoT, and cloud computing, the market of Prescriptive Analytics is growing since the technologies allows real-time data-based decision-making. Emerging network infrastructures such as 5G and edge computing are augmenting processing power, and increasing malign cyber activity is generating interest in AI-driven risk assessment. With the potential of automatic prescriptive analytics to solve industry-specific problems, new trends in Quantum Computing, Explainable AI, and Edge AI are preparing the future by making prescriptions faster, more transparent, and specific to need.
To Get More Information On Prescriptive Analytics Market - Request Free Sample Report
Prescriptive Analytics Market Size and Forecast
-
Market Size in 2025E: USD 12.57 Billion
-
Market Size by 2033: USD 82.03 Billion
-
CAGR: 26.42% from 2026 to 2033
-
Base Year: 2025E
-
Forecast Period: 2026–2033
-
Historical Data: 2022–2024
Prescriptive Analytics Market Trends
-
Rising demand for data-driven decision-making is driving the prescriptive analytics market.
-
Growing adoption of AI, machine learning, and optimization algorithms is enhancing predictive and prescriptive capabilities.
-
Expansion across BFSI, healthcare, retail, manufacturing, and logistics sectors is fueling market growth.
-
Integration with big data platforms, ERP, and business intelligence tools is improving operational efficiency and strategic planning.
-
Increasing focus on risk management, cost reduction, and process optimization is shaping adoption trends.
-
Advancements in cloud-based analytics and real-time data processing are boosting accessibility and scalability.
-
Collaborations between software providers, analytics consultancies, and enterprises are accelerating innovation and global market deployment.
Prescriptive Analytics Market Growth Drivers:
-
The growing use of advanced technologies like AI and ML to enhance the capabilities of prescriptive analytics for better, data-driven decision-making.
By combining AI and machine learning with prescriptive analytics, decision-making processes can be optimally managed. These technologies enable organizations to extract relevant insights from large datasets to improve operational efficiencies, reduce belongings, and gain a competitive edge. With the help of AI-driven algorithms, the predictive capability of prescriptive analytics becomes a very important asset for all industries, primarily healthcare, finance, and manufacturing, where decisions are data-driven and need to be accurate. The rapid adoption of AI and ML technology is speeding up the global prescriptive analytics market as brands want smarter automated solutions to increase performance.
Prescriptive Analytics Market Restraints:
-
Data privacy concerns and regulatory compliance hurdles prevent the widespread adoption of prescriptive analytics.
Data privacy and security concerns are one of the major restraining factors for the prescriptive analytics market. However, because prescriptive analytics requires massive amounts of sensitive data, organizations will have to tackle the ever-increasing challenge of safely buffering, storing, and processing that information. With regulatory requirements like GDPR and CCPA, compliance becomes stricter as businesses adopt analytics tools, and they face the threat of data breaches and legal consequences if they fail to comply. In sectors where data security is critical, these worries can hinder adoption.
Prescriptive Analytics Market Opportunities:
-
The growing emphasis on data-driven decision-making fuels the demand for prescriptive analytics in various sectors.
With more businesses striving to become data-driven, the demand for prescriptive analytics is increasing quickly. More organizations are turning to data when creating a strategy or making decisions, instead of going with one intuitive choice or the next just because it's what they have always done in the past. Businesses can incorporate prescriptive analytics into their operations to help them prescribe the next best action, optimize processes, improve resource allocation, and reduce risks. As businesses continue to make data-driven decisions, prescriptive analytics providers experience significant growth in sectors like healthcare, finance, and retail.
Prescriptive Analytics Market Challenges:
-
High upfront costs and the need for skilled personnel create barriers to adopting prescriptive analytics, particularly for smaller businesses.
The high cost of implementation technology is one of the key challenges for the prescriptive analytics market. Implementing enterprise-grade analytics solutions into existing systems takes a lot of investment in software and infrastructure. Moreover, organizations require personnel to run and optimize these tools. This may prevent mass adoption as it will be hard for smaller or budget-constrained businesses to justify the spending. To tackle this, vendors need to offer new affordable, flexible, adaptable solutions that can scale up or down based on the needs of the organization who is at any point of their digital transformation journey.
Prescriptive Analytics Market Segment Analysis
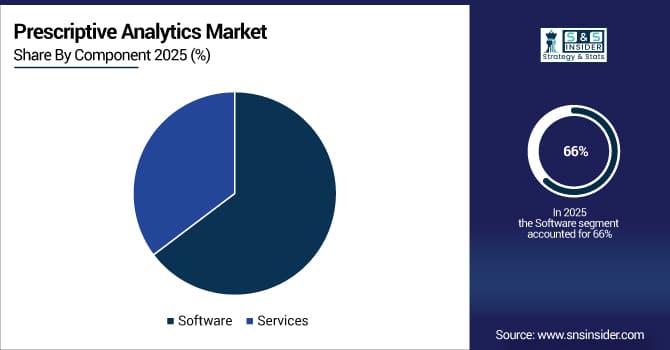
By Component, Software dominated the Prescriptive Analytics Market, while Services are expected to register the fastest CAGR
The software segment dominated the market with a 66% share of revenues in 2025. it offers critical tools and platforms that help organizations in conducting advanced data analytics, modeling predicaments, and making data-driven insights. These software programs are at the heart of prescriptive analytics, typically equipped with extensive capabilities, including optimization algorithms, predictive modeling, and decision automation.
The services segment is expected to register the fastest CAGR during the forecast period. The services segment is booming as there has been a surge in the need for professional consulting, deployment, and support to ensure high value provision through prescriptive analytics solutions.
By Application, Supply Chain Management led the market, with Operations Management projected to grow at the fastest rate
In 2025, the supply chain management segment dominated the market and accounted for a revenue share of more than 38%. due to high dependence on analytics-based decision-making to improve complex interdependent processes, such as inventory management, demand forecasting, and logistics.
The operations management segment is projected to experience substantial growth throughout the forecast period as companies increasingly look to optimize internal processes, resource deployment and improve productivity.
By End-Use, IT & Telecom held the largest market share, while Finance & Banking is expected to experience the highest CAGR
IT & telecom segment dominated the market and held a significant revenue share in 2025 as it functions in a data-intensive environment, where real-time decision-making and optimization are essential. Telecoms leverage prescriptive analytics to ensure quality of network performance, utilization of bandwidth, and improvements in customer experience by predicting and preventing the issues before they degrade service quality. With ample usage and customer data along with large and complex network metrics present, the sector inherently employs advanced analytics for regular service reporting and keeping the services reliable and competitive.
The finance and banking industry is anticipated to register the fastest CAGR during the forecast period owing to the increasing need for this sector for risk management, fraud detection, and personalized customer experience. Prescriptive analytics are used by financial institutions to forecast market trends, identify optimal investment strategies and better comply with regulatory obligations.
Prescriptive Analytics Market Regional Analysis
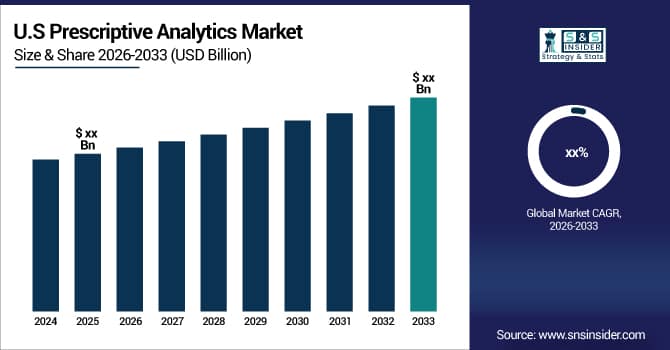
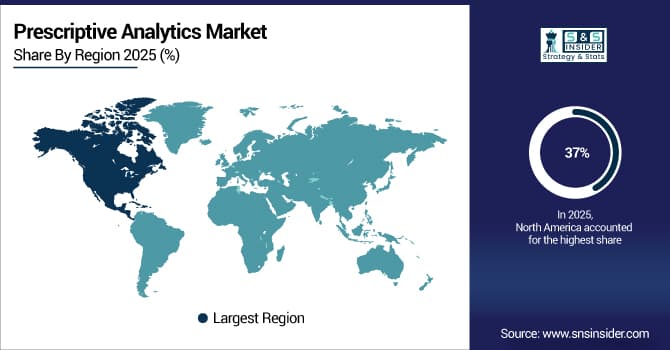
North America Prescriptive Analytics Market Insights
In 2025, North America dominated the market and held a 37% share. The increasing adoption of prescriptive analytics across North America is driven by the need of the business houses to keep pace with changing market needs by using advanced data tools to gain a competitive advantage. Canada in particular thanks in part to its modernization of industries like manufacturing and energy—along with Mexico is witnessing growth in prescriptive analytics as it allows business leaders to cut costs and drive operations more effectively.
Get Customized Report as Per Your Business Requirement - Enquiry Now
Asia Pacific Prescriptive Analytics Market Insights
Asia Pacific is expected to capture the fastest CAGR in the prescriptive analytics market during the forecast period. The prescriptive analytics market in the Asia Pacific is growing at a significant rate owing to an increase in digitalization and economic development taking place in nations like China, India, and Japan. Faced with competitive markets that need ever greater resilience, focus and ingenuity to get by, businesses here are turning to prescriptive analytics to improve supply chains, drive operational efficiency and optimize customer experiences.
Europe Prescriptive Analytics Market Insights
The Europe Prescriptive Analytics Market is growing steadily, driven by increasing adoption of advanced analytics across industries. Key factors include rising demand for data-driven decision-making, integration of AI and machine learning, and digital transformation initiatives. Organizations leverage prescriptive analytics to optimize operations, enhance efficiency, reduce costs, and improve customer experience, while supportive government policies and technological infrastructure further fuel market growth in the region.
Middle East & Africa and Latin America Prescriptive Analytics Market Insights
The Middle East & Africa (MEA) and Latin America Prescriptive Analytics markets are expanding due to growing adoption of AI-driven decision-making tools. Increasing digital transformation, demand for operational efficiency, and cost optimization drive growth. Enterprises across sectors are leveraging analytics to improve productivity, enhance customer experience, and gain competitive advantage, while investments in IT infrastructure and supportive government initiatives further bolster market development in these regions.
Prescriptive Analytics Market Competitive Landscape:
Alteryx, Inc.
Alteryx, Inc. is a leader in self-service data analytics and AI-powered data orchestration, enabling organizations to transform raw data into actionable insights. Its platform integrates data preparation, blending, analytics, and automation, supporting business intelligence, predictive modeling, and prescriptive workflows. Alteryx emphasizes cloud and hybrid deployments, scalability, and ease of use, empowering enterprises to centralize, govern, and operationalize data for faster, data-driven decision-making across diverse industries worldwide.
-
2025: Alteryx unveiled a renewed vision with Alteryx One as an “AI Data Clearinghouse,” centralizing clean, governed data to power analytics, ML, and AI agents for enterprise-scale prescriptive workflows.
-
2024: The Fall 2024 release introduced cloud/hybrid deployment capabilities (Standard Mode, LiveQuery), enhanced data-warehouse connectors, and Magic Reports for automated insight generation and improved analytics-to-action readiness.
IBM Corporation
IBM Corporation is a global technology and consulting leader, offering AI, cloud, and data-driven solutions to enterprises. Its platforms support large-scale analytics, machine learning, and AI-driven automation, enabling businesses to extract actionable insights from complex datasets. IBM emphasizes scalability, open architecture, and integration with modern data infrastructure to empower organizations with prescriptive, predictive, and real-time decision-making capabilities across industries including finance, healthcare, and manufacturing.
-
IBM’s watsonx.data 2.2 release introduced vector-data support via Milvus, enhanced Spark engine support, and improved storage integrations, boosting scalability and flexibility for ML and data-intensive analytics workloads to enable advanced prescriptive analytics.
Microsoft Corporation
Microsoft Corporation provides a comprehensive suite of cloud, productivity, and business intelligence solutions, empowering enterprises with data-driven insights and AI-assisted workflows. Its Power Platform, Dynamics 365, and Power BI offerings enable scalable analytics, visualization, and automation for predictive and prescriptive decision-making. Microsoft emphasizes low-code, AI integration, and hybrid-cloud compatibility to streamline business processes, enhance operational efficiency, and enable organizations to leverage data for actionable insights across CRM, ERP, and enterprise-wide applications.
-
2024: Power BI June 2024 update introduced large-semantic-model downloads and enhanced data modeling/visualization capabilities, supporting robust BI pipelines for predictive and prescriptive analytics.
-
2024: In the 2024 release-wave for Power Platform / Dynamics 365, Microsoft expanded AI integrations (Copilot, low-code tools, data automation) to facilitate analytics-driven decision workflows across business processes.
Key Players
Some of the Prescriptive Analytics Market Companies
-
IBM Corporation
-
SAS Institute Inc.
-
Microsoft Corporation
-
Oracle Corporation
-
SAP SE
-
TIBCO Software Inc.
-
FICO (Fair Isaac Corporation)
-
RapidMiner Inc.
-
Alteryx, Inc.
-
Dataiku SAS
-
QlikTech International AB
-
Sisense Inc.
-
MathWorks Inc.
-
Domo, Inc.
-
Tableau Software (Salesforce)
-
Board International
-
Information Builders (TIBCO Company)
-
Anaplan, Inc.
-
Google LLC
-
Amazon Web Services, Inc.
| Report Attributes | Details |
|---|---|
|
Market Size in 2025 |
USD 9.0 Billion |
|
Market Size by 2033 |
USD 74.5 Billion |
|
CAGR |
CAGR of 26.42% From 2026 to 2033 |
|
Base Year |
2025 |
|
Forecast Period |
2026-2033 |
|
Historical Data |
2022-2024 |
|
Report Scope & Coverage |
Market Size, Segments Analysis, Competitive Landscape, Regional Analysis, DROC & SWOT Analysis, Forecast Outlook |
|
Key Segments |
• By Component (Software, Services) |
|
Regional Analysis/Coverage |
North America (US, Canada, Mexico), Europe (Eastern Europe [Poland, Romania, Hungary, Turkey, Rest of Eastern Europe] Western Europe] Germany, France, UK, Italy, Spain, Netherlands, Switzerland, Austria, Rest of Western Europe]), Asia Pacific (China, India, Japan, South Korea, Vietnam, Singapore, Australia, Rest of Asia Pacific), Middle East & Africa (Middle East [UAE, Egypt, Saudi Arabia, Qatar, Rest of Middle East], Africa [Nigeria, South Africa, Rest of Africa], Latin America (Brazil, Argentina, Colombia, Rest of Latin America) |
|
Company Profiles |
IBM Corporation, SAS Institute Inc., Microsoft Corporation, Oracle Corporation, SAP SE, TIBCO Software Inc., FICO (Fair Isaac Corporation), RapidMiner Inc., Alteryx, Inc., Dataiku SAS, QlikTech International AB, Sisense Inc., MathWorks Inc., Domo, Inc., Tableau Software (Salesforce), Board International, Information Builders (TIBCO Company), Anaplan, Inc., Google LLC, Amazon Web Services, Inc. |
Frequently Asked Questions
Ans: North America led the market in 2025, supported by high adoption of advanced analytics tools and strong enterprise focus on competitive advantage.
Ans: The Software segment dominated the market, while Services are expected to grow at the fastest CAGR during the forecast period.
Ans: Growth is driven by AI and machine learning integration, enabling optimized decision-making, operational efficiency, cost reduction, and competitive advantage across industries.
Ans: The market was valued at USD 12.57 billion in 2025, reflecting rising demand for data-driven decision-making and advanced analytics solutions.
Ans: The Prescriptive Analytics Market is expected to grow at a CAGR of 26.42% from 2026 to 2033, driven by AI and machine learning adoption.
Get in Touch
