Pressure Control Equipment Market Report Scope & Overview:
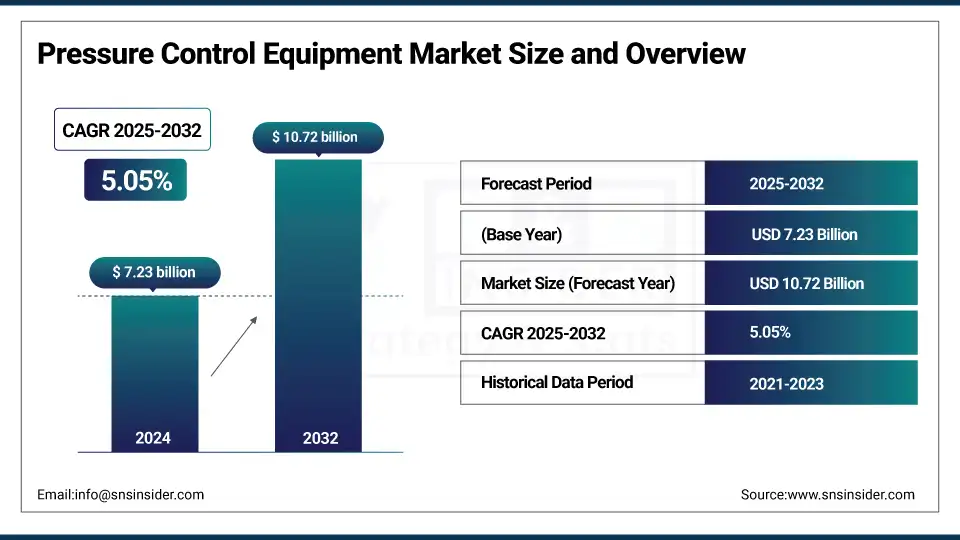
The Pressure Control Equipment Market size was valued at USD 7.23 billion in 2024 and is expected to reach USD 10.72 billion by 2032, growing at a CAGR of 5.05% over the forecast period of 2025-2032.
The pressure control equipment market is expected to grow at a compound annual growth rate over the forecast period due to the increasing demand from oil & gas, power generation, manufacturing, and other industries. Pressure control equipment is essential for maintaining system integrity and a safe operational environment, whilst increasing production efficiency by regulating, monitoring, and controlling the pressure levels in the specified application. The pressure control equipment industry is largely driven by the rising number of drilling activities, especially in the unconventional oil and gas field, and the improvement of high-pressure technologies. Surge in investments regarding automation and digital monitoring systems to enhance operational reliability, control, and reduce manual interventions is also augmenting the growth of the market.
To Get more information On Pressure Control Equipment Market - Request Free Sample Report
Some of the prominent pressure control equipment market trends include advancements in blowout preventers (BOPs), control valves, and pressure relief devices for extreme environments and high-pressure applications. Furthermore, the continuing trend toward cellular-based devices with remote monitoring and predictive maintenance may also affect the pressure control equipment market growth. Researchers are focused on developing high-performance and sustained products. Therefore, manufacturers are focusing more on research and development to make rigid abundant resources with inbuilt safety and environmental regulations. With pressure control solutions being the pillar of various industry operations, operational cost reductions and process optimization are also fostering the switching demand for pressure control solutions, thus making the pressure control systems market highly dynamic and innovation-centric.
In June 2025, Baker Hughes agreed to sell a 65% stake in its surface pressure control business to Cactus for USD 344.5 million, forming a joint venture. The deal strengthens Cactus’s position in global markets, with most revenues from the Middle East. This division provides critical pressure control equipment, including wellheads and production tree systems. The transaction is expected to close in the second half of 2025.
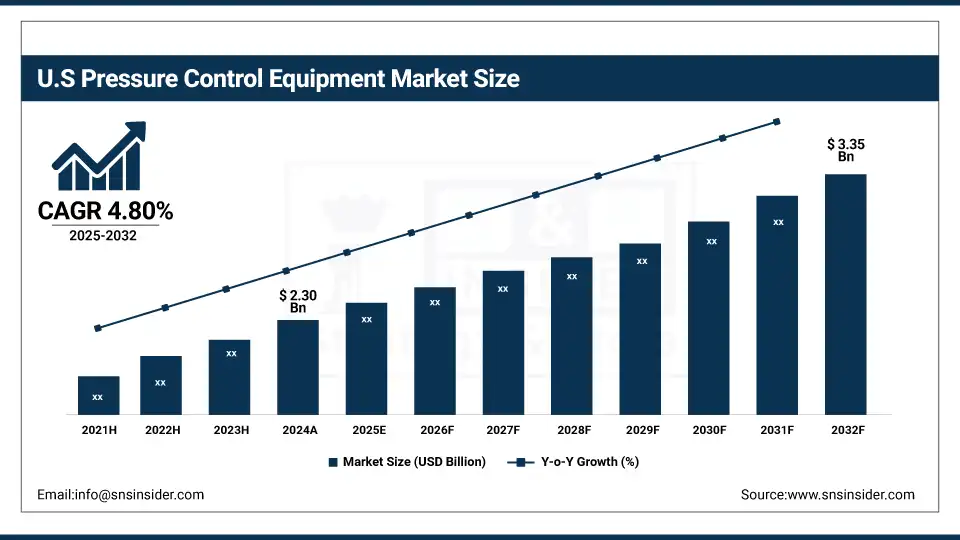
The U.S. pressure control equipment market was valued at USD 2.30 billion in 2024 and is expected to reach USD 3.35 billion by 2032, growing at a 4.80% CAGR. Growth is driven by strong oil & gas activities, shale exploration, and increasing adoption of advanced pressure control technologies.
Pressure Control Equipment Market Dynamics:
Drivers:
-
Digital Revolution is Driving Innovation in the Global Pressure Control Equipment Market
Technological advancement and digitalization act as the driving factor in the global pressure control equipment market. The advent of smart sensors, IoT, AI, and more advanced automation technologies has improved the operational performance and efficiency of pressure control systems. Such advancements help in monitoring, predictive maintenance, and remote operations in real-time, minimizing downtime, and increasing operational safety. With the advancements in technologies targeting better process control and reliability in different industries, there is a rising chance that a complete digital solution is indispensable. Research reveals that more than 65% of oil and gas companies have already deployed or are currently piloting digital pressure control solutions for operational optimization.
Moreover, innovations including cloud-derived stages joined with data analytics contraptions make constant checking of tension levels possible, accordingly gaining support for proactive decision-making. This is also expected to lower human error risks while complying with strict regulations by the end-user, which in turn is expected to drive the market growth of automated pressure control systems. Such digital transformations are believed to continue being one of the significant growth drivers of the Global Pressure Control Equipment Market in the upcoming years.
In June 2025, Chart Industries and Flowserve announced a USD 19 billion all-stock merger to create a global leader in gas and liquid technologies. The combined company, expected to close the deal by Q4 2025, targets USD 300 million in cost synergies and will be headquartered in Dallas.
Restraint
-
High Initial and Operating Costs Hinder Adoption of Advanced Pressure Control Equipment Among SMEs
Initial and running costs are high, which acts as a restraining force for the pressure control equipment market. The adoption of advanced systems, including high-end practices including automated technology, high-performance, corrosion-resistant materials, and an IoT platform, significantly increases upfront investment. Installation, training, and ongoing maintenance all add to the TCO as well. This especially demotivates SMEs (Small and Medium Enterprises) to migrate to newer technologies. Data from studies show that almost 60% of SMEs in industrial sectors prefer to postpone the modernization of equipment due to high capital expenditures and uncertain ROI.
The price tag for IoT-enabled pressure control solutions can also carry a 30-40 % premium over traditional equipment, as it will require more costly sensors, analytics software, and cybersecurity programs, among others. In industries with low margins needing tight operational budgets, such an inordinate expense is a dark cloud, constraining system-level adoption of advanced pressure control systems across developing markets and small operators alike.
Pressure Control Equipment Market Segmentation Analysis:
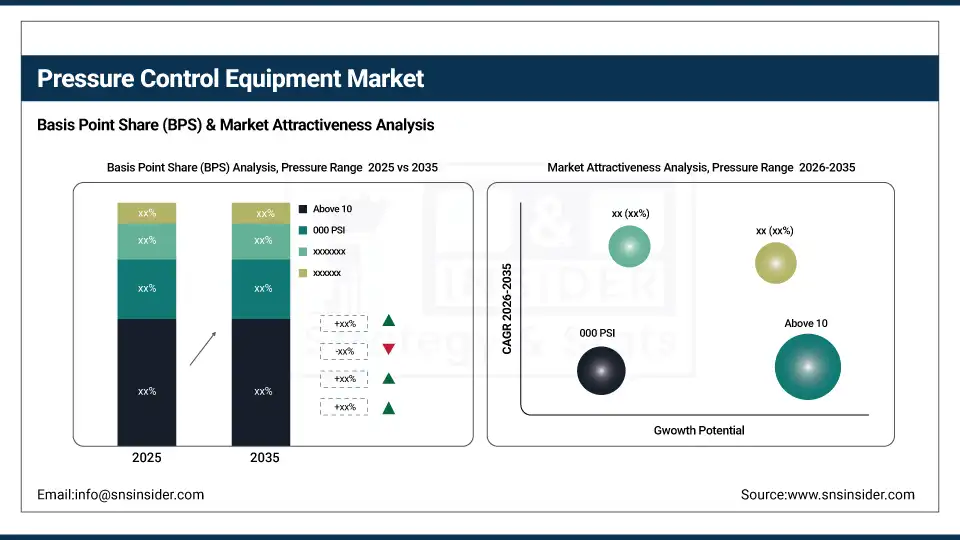
By Pressure Range
The above 10,000 PSI segment dominated the market and accounted for 42% of the Pressure Control Equipment Market share. Such dominance is largely driven by its use in high-demand drilling applications, for instance, ultra-deepwater and HPHT wells. Such operations need strong pressure control systems operating in extreme conditions to take control of operations safely and efficiently. This pressure range is used for oil & gas companies to increase production and reduce the risks in these high complexity projects, particularly in North America and the Middle East, where deep drilling plays a significant role. Technological developments in advanced materials and systems for pressure control are also supporting this segment.
The below 10,000 PSI segment is projected to be the fastest growing in the market. The increasing count of newly drilled low-to-medium depth wells and shale gas exploration works, especially in the Asia-Pacific and Latin America regions, is stimulating this growth. Once again, it is a big reason for relatively lower operational costs, lower technical complexity, and simple maintenance of operational equipment lying under this range, which attracts the operators, especially those targeting environments less extreme. Furthermore, the surge in onshore drilling, along with the rising interest in exploring unconventional resources, is also anticipated to further drive this segment's growth over the forecast period, especially for small and mid-sized operators.
By Component
Valves emerged as the dominant component in the pressure control equipment market, holding a significant 48% market share in 2024. This unavoidable aspect of the valve, especially its importance in controlling, directing, and regulating the flow of fluids during drilling and production operations, has made it irreplaceable across a number of applications. They are used for simple flow balancing to high-end pressure control for onshore and offshore processes. Additionally, the frequent replacement requirements, regular servicing, and development of newer valve technologies with features like automation and remote monitoring are contributing to their higher adoption. In addition, their multi-range talent at different levels of pressure increases the scope of business for them in the market.
The Control Head segment is anticipated to be the fastest growing within the component category. The growth is attributed to the growing uptake of automated and advanced pressure control systems, which help enhance safety and operational efficiency. They are increasingly being adopted in applications in which control over well pressure is critical, such as in directional drilling and underbalanced drilling, owing to the fact that control heads provide optimized performance. This is driven by the digitalization and smart feature-driven investments being made and integrated within control heads to improve their performance, reliability, and monitoring. Moreover, increasing shale drilling activities coupled with the technological advancements in control head designs are precluding the global expansion scope of this segment.
By Application
Onshore operations dominate the pressure control equipment market, commanding around 58% of the total market share in 2024. This segment will dominate the market over the forecast period as most of the drilling operations are onshore compared to offshore, as it incurs lesser operational cost with quick deployment and easier logistics. Regions, such as North America, the Middle East, and some to a certain degree, Asia Pacific continue to pour investments into onshore exploration and production projects, such as shale oil and gas extraction. Furthermore, the pressure control equipment is driven by high demand in onshore due to continuous development in seam drilling methods and rising investments in brownfield.
The Offshore segment is identified as the fastest-growing application for pressure control equipment. This growth is attributed to dual scenarios, such as the growing emphasis on deepwater and ultra-deepwater drilling and the revival in offshore exploration projects. Globally, oil & gas operators expand their offshore portfolios to meet the energy demand on a global scale, specifically in South America, Africa, and Southeast Asia. Demand in this segment is also driven by technological complexity and the incorporation of high-performance and corrosion-resistant equipment due to harsh marine conditions. The high adoption rate of advanced pressure control solutions in offshore due to high investments in floating production systems and offshore rigs will provide a high growth opportunity to the pressure control service market during the forecast period.
Pressure Control Equipment Market Regional Outlook:
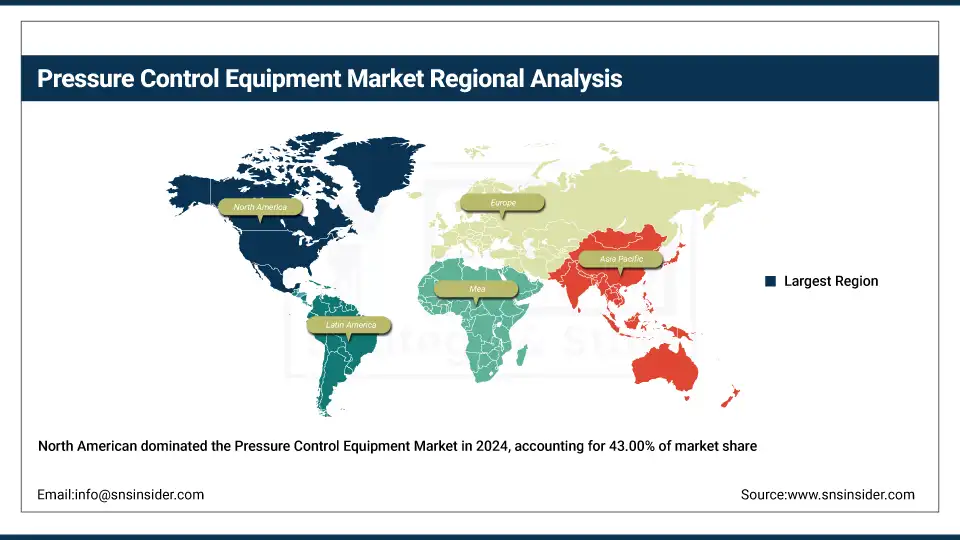
North America holds the dominant position in the market with a substantial 43.00% share. The region is ascribed to advanced infrastructure, higher penetration of innovative technology, and clear demand from the construction and agriculture, and mining industries. However, the availability of well-established market players and high investments in research and development is driving the growth of the market in the region. In addition, the work of the U.S. is more integral as the factor drives the development of infrastructure projects, and the government in the U.S. is in support of the modernization and proper use of machinery in the field. Additionally, easy access to low-cost financing options and an excellent aftermarket service network enhances the sales of advanced equipment in the region. North America boasts a strong, established supply chain and skilled workforce that helps it retain market share.
Get Customized Report as per Your Business Requirement - Enquiry Now
Europe holds a significant share of the market due to its strong focus on energy efficiency, sustainability, and strict regulatory standards. Europe accounts for the leading share in the market. Industrial sectors, such as construction, agriculture, and forestry account for the demand in the region, specifically in Germany, France, and Italy. Manufacturers in Europe focus on environmentally friendly and electric machinery due to the increasing environmental concerns and regulatory mandates concerning the use of green and eco-friendly machinery. Furthermore, rising government promotional initiatives for green technologies and subsidizing electric and hybrid machinery are other factors fostering market growth. Technological advancements related to automation and precision engineering are another contributing factor to the steady replacement of existing older equipment with superior models in Europe. This large market position is due in part to a mature economy and high urbanization rates in the region.
In Europe, Russia dominates the pressure control equipment market due to its large-scale oil and gas production and significant upstream activities. The country’s extensive reserves and continuous investments in energy infrastructure drive high demand for pressure control systems, making it a key market within the region.
Asia-Pacific is the fastest-growing region in the market, fueled by rapid urbanization, expanding construction activities, and growing industrialization in emerging economies, such as China, India, and Southeast Asian countries. With increasing government spending on roads, bridges, and housing, the demand for the market is becoming very high due to the growth of infrastructure development. In addition, the large-scale agriculture in Asia-Pacific is utilizing modernized tools, increasing productivity and efficiency, which is further fueling this market advancement. Market growth is also supported by cost-effective manufacturing and an increasing number of domestic players providing competitive products. In addition, the improving economic conditions and increasing disposable income of the region are further prompting small and medium enterprises (SMEs) to invest in high-end machinery solutions.
Key Players in the Pressure Control Equipment Market are:
Pressure control equipment companies are SLB, Weatherford, NOV Inc, Baker Hughes, The Weir Group PLC, Hunting, Emerson Electric Co, Flowserve Corporation, The IKM Group, and Control Flow Inc.
Recent Developments:
-
In March 2025, SLB launched its EWC (Electric Well Control) technology, replacing traditional hydraulic systems with electric-powered BOP controls. This innovation reduces operational costs, enhances safety through real-time monitoring, and simplifies maintenance. The technology was unveiled at the SPE/IADC Drilling Conference in Norway.
-
In May 2025, SLB unveiled its Electris portfolio of digitally‑enabled electric well completions, a suite designed to boost production and recovery while cutting total cost of ownership. The solution offers real-time reservoir management, enabling operators to optimize production zones and reduce water handling energy. Over 100 installations across five countries demonstrate its impact.
| Report Attributes | Details |
|---|---|
| Market Size in 2024 | USD 7.23 Billion |
| Market Size by 2032 | USD 10.72 Billion |
| CAGR | CAGR of 5.05% From 2025 to 2032 |
| Base Year | 2024 |
| Forecast Period | 2025-2032 |
| Historical Data | 2021-2023 |
| Report Scope & Coverage | Market Size, Segments Analysis, Competitive Landscape, Regional Analysis, DROC & SWOT Analysis, Forecast Outlook |
| Key Segments | • By Pressure Range (Above 10,000 PSI, Below 10,000 PSI) • By Component (Control Head, Valves, Wellhead Flange, Flow Tee, Adapter Flange, Quick Unions) • By Application (Onshore, Offshore) |
| Regional Analysis/Coverage | North America (US, Canada, Mexico), Europe (Germany, France, UK, Italy, Spain, Poland, Turkey, Rest of Europe), Asia Pacific (China, India, Japan, South Korea, Singapore, Australia, Rest of Asia Pacific), Middle East & Africa (UAE, Saudi Arabia, Qatar, South Africa, Rest of Middle East & Africa), Latin America (Brazil, Argentina, Rest of Latin America) |
| Company Profiles | SLB, Weatherford, NOV Inc, Baker Hughes, The Weir Group PLC, Hunting, Emerson Electric Co, Flowserve Corporation, The IKM Group, Control Flow Inc. |
Frequently Asked Questions
The North America region dominated the Pressure Control Equipment Market in 2024.
The “above 10,000 PSI” segment dominated the Pressure Control Equipment Market.
Digital Revolution Driving Innovation in the Global Pressure Control Equipment Market
The Pressure Control Equipment Market was USD 7.23 billion in 2024 and is expected to reach USD 10.72 billion by 2032.
The Pressure Control Equipment Market is expected to grow at a CAGR of 5.05% over 2025-2032.
Get in Touch
