Human Centric Lighting Market Report Scope & Overview:
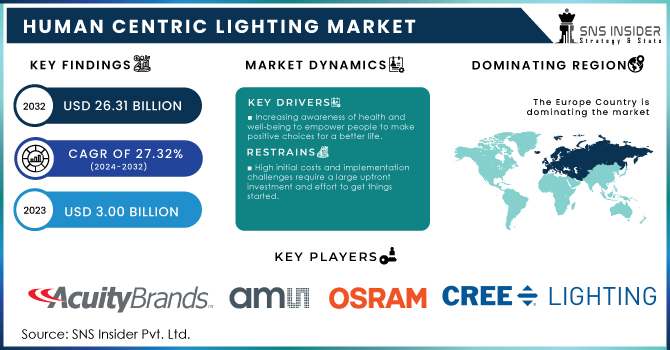
The Human Centric Lighting Market was valued at USD 3.82 billion in 2024 and is expected to reach USD 26.37 billion by 2032, growing at a CAGR of 6.23% over the forecast period of 2025-2032.
The human centric lighting market has experienced a substantial rise due to the expanding vision of the significance of lighting for human life and health. At the moment, the human centric lighting market can be characterized by a high level of the adoption of the new system in different sectors such as residential, commercial, healthcare, and education. The main precondition for the high level of adoption is related to the fact that people are searching for new energy-efficient solutions that are beneficial for the environment and correspond to the idea of sustainability.

Get More Information on Human Centric Lighting Market - Request Free Sample Report
Another important factor is the progression of lighting technologies, such as the incorporation of IoT and smart controls, enabling customized and adaptable lighting settings. This advancements in technology offer significant chances for businesses to create original products that meet the unique requirements of customers. Wi-Fi is the main technology in the current Internet of Things environment, with more than 30% of connections. Bluetooth, along with its low-power version BLE, ranks second with a 27% share. The expansion of Cellular IoT, which includes LTE-M and NB-IoT technologies, is increasing at a rate of 20%, driven by more effective alternatives that are replacing outdated 2G and 3G networks. China is significantly dominant in the cellular IoT market, as major operators have control over more than 80% of connections and 64% of revenue.
Key Human Centric Lighting Market Trends
-
Ultrasound-assisted positioning of Human Centric Lighting is increasingly adopted, reducing procedural mistakes, lowering contamination chances, and promoting usage in both emergency and outpatient environments.
-
Single-use and antimicrobial-treated devices are gaining popularity, decreasing bloodstream infection incidents, and complying with institutional hygiene regulations.
-
Growing preference for at-home infusion treatments drives demand for Human Centric Lighting as a safer substitute to central catheters, enabling therapies such as antibiotics, fluid replacement, and analgesic administration.
-
Expansion of medical facilities across Asia-Pacific, Latin America, and the Middle East, supported by government funding and local production, accelerates uptake of advanced Human Centric Lighting solutions.
Human Centric Lighting Market Growth Drivers:
-
Increasing awareness of health and well-being to empower people to make positive choices for a better life
One of the significant drivers for the Human Centric Lighting market is the increasing consciousness about the health and well-being of people and businesses. The majority of people realize the importance of lighting in homes and working environments and how artificial lights can harm human health and moods. Poorly designed and with constant light and ultraviolet emissions, it ceases to support our natural rhythms and patterns. Human Centric Lighting systems align more with the natural sequences of nature. The natural cycles even help us relax and induce sleep during the night so that natural melatonin can be generated. This alignment is intensely beneficial for people as numerous data provided shows. For instance, human centric lights can have 45% of improved sleep, 35% of increased alertness, and 20% of fewer depressive symptoms.
-
Supportive government policies and regulations achieve desired social or economic outcomes
Governments throughout the world have become more concerned about energy efficiency and people’s health. Thus, they are now more positive about modern lighting systems, including HCL. Governments have developed a variety of energy efficiency standards and guidelines that concern lighting systems in particular. The purpose was to include energy-efficient technologies in them. Specifically, HCL systems based on LED technology, which are now widely used, are distinguished by their energy efficiency. For Example, The European Union’s Ecodesign Directive, as well as its Energy Labelling Regulation, have set a range of specific energy performance standards for lighting products. The idea was to ensure that relevant technologies, including HCL, would help reduce energy consumption and carbon footprints. Similarly, the U.S. DOE Lighting Facts Label, as well as its Energy Star program, drive the adoption of energy-efficient lighting technologies.
Human Centric Lighting Market Restraints:
-
High initial costs and implementation challenges require a large upfront investment and effort to get things started.
The high costs of HCL systems are the result of expensive technology and components used in the system. HCL systems are based on high-quality LEDs frequently tailored to produce light at a wide range of color temperatures and intensities. Expensive LEDs require increased expenses compared to standard lighting solutions. However, most of the HCL systems included more sophisticated sensors, smart controls, and IoT instruments further increasing the cost. For example, tunable white LEDs necessary for creating a dynamic environment of natural daylight are more expensive to produce and install compared to standard LEDs. Adding smart controls and integrating with IoT platforms have added to the cost of the system. These components should also be properly paired for perfect system functioning. It ultimately means that once a single component is changed within the system after the installation, the provider of this single component tests and assures its compatibility with the other already installed components. It is a challenge and cost higher for the supplier leading to increased prices and costs of the HCL system.
-
Complexity in integration with existing systems due to differences in technology, data formats, and communication protocols.
The complexity related to the implementation of human centric lighting systems with existing building infrastructure and managing systems plays the role of a significant restraint as well. Several factors and conditions should be properly considered, including the effective compatibility and coordination between various managing systems. For instance, the integration of HCL into the existent smart building solutions or replacing traditional lighting can be technically complicated and expensive to implement in older buildings with fixed design and infrastructure. In addition, traditional lighting systems are not prepared for the required functions and maintenance of HCL with their effective information and control complex for every light fixture as a system component. HCL can be implemented only if there are efficient energy supply and other managing systems. The planning, design, and implementation of a new HCL system in an existing building needs to consider the compatibility and integration of new lighting systems with the existing electrical system.
Human Centric Lighting Market Segment Analysis
By Type
The new segment captured the highest market share of 67.00% in 2024. The rise of smart homes and the increasing focus on improving residential living standards are the primary drivers of the new installation of HCLs. The most common smart home integration involves the use of mobile phone apps or the use of voice assistants that provide various settings to adapt accordingly. Making the residential premise more comfortable and adaptable for select times during the day also requires the installation of human-centric lighting.
The retrofit segment is expected to grow at a CAGR of over 27.65% during the forecast period 2025-2032. The increasing number of retrofit projects act as the primary driver of the reactive installations. In the office space, retrofitting lights would be of additional benefit in improving the well-being of the employees. A better work environment for employees will offer an elevated level of work efficiency.
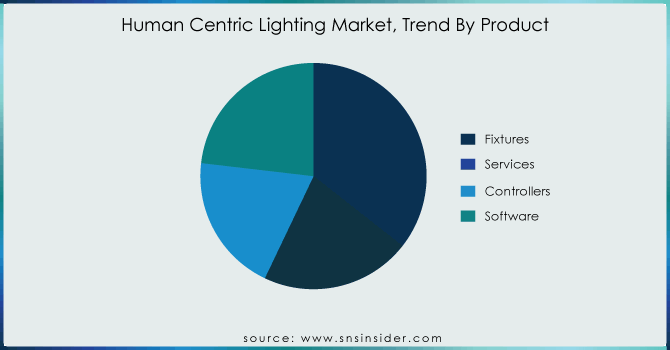
By Product
The fixtures segment accounted for 35.59% in 2024 and became the dominating segment. The need for human-centric lighting to improve the working environment has triggered businesses to adopt the technology. Fixtures made for HCL could be programmed to act throughout the day, modulating the color temperature and intensity of light. It might be used to affect people’s daily mood and sleep quality.
The services segment is expected to expand at the fastest CAGR during 2025-3032. With the change in people’s lifestyles and behaviors, many organizations and individuals in various sectors have realized the significance of human-centric lighting and the benefits that come with it. The combination of artificial sources to provide the optimum energy intensity and the time spectrum of natural daylight plays a fundamental role in enhancing people’s moods and treasures their productivity on their daily demands, regardless of the environment in which they dwell.

Get Customized Report as per your Business Requirement - Request For Customized Report
By Application
The commercial segment held the largest market share of 59.13% in 2024. In commercial environments, human centric lighting significantly provides higher production rates and increases workers’ safety. Proper lighting eases eye strain and fatigue, thereby increasing concentration levels and reducing errors as a result.
The residential segment is expected to grow at a CAGR of 27.63% during the forecast period. The application of human-centric lighting in residential premises significantly beautifies homes. Human-centric lighting or lighting controls enhance the proper blending of color temperature and brightness in homes. It also provides a good environment for improved visibility and comfort in terms of reading, including preparing and consuming meals.
Human Centric Lighting Market Regional Analysis
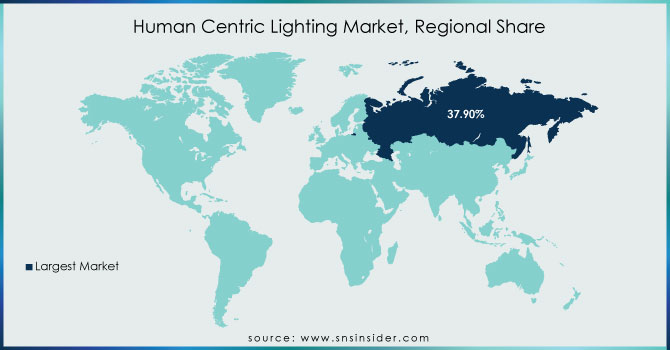
Europe Human Centric Lighting Market Insights
Europe’s human centric lighting market is primarily driven by regulatory frameworks and building standards. Initiatives to enhance energy efficiency have contributed to the development of innovative human-centric lighting solutions. The U.K.’s commitment to sustainability and climate action supports the growth of the lighting market. Human-centric lighting aids in transitioning to a low-carbon economy while offering environmental benefits without compromising human comfort. Countries such as Germany, France, and the Netherlands are increasingly integrating smart lighting solutions in offices, healthcare facilities, and educational institutions. The trend of wellness-focused architecture and circadian rhythm-based lighting further accelerates adoption across residential and commercial segments.
North America Human Centric Lighting Market Insights
The adoption of intelligent lighting systems, including human-centric systems, is driven by the proliferation of smart technologies. Human-centric lighting can be seamlessly controlled through IoT-enabled devices, integrating with sensors, data analytics, and human interface systems to create dynamic lighting environments. Growth is further fueled by sustainability awareness, energy-efficient building regulations, and government incentives for green construction. Applications in offices, hospitals, and retail spaces are expanding due to the focus on enhancing productivity, sleep quality, and well-being. The U.S. and Canada are key contributors, with significant investment in R&D and pilot projects for human-centric lighting in smart cities.
Asia-Pacific Human Centric Lighting Market Insights
Asia-Pacific is witnessing rapid adoption of human-centric lighting, driven by urbanization, industrialization, and rising awareness of energy-efficient solutions. Countries such as China, Japan, South Korea, and India are investing in smart infrastructure, green buildings, and advanced lighting technologies. Human-centric lighting is increasingly implemented in hospitals to improve patient recovery and staff efficiency, and in offices and educational institutions to support circadian rhythm-based productivity. Collaborations between lighting manufacturers and technology providers are fostering integration with IoT and AI for smarter lighting environments.
Latin America (LATAM) Human Centric Lighting Market Insights
The LATAM market is experiencing growth due to rising investments in commercial and residential infrastructure in countries like Brazil, Mexico, and Argentina. Energy efficiency and sustainability initiatives are key drivers. Businesses in hospitality, healthcare, and retail sectors are recognizing the benefits of human-centric lighting for occupant comfort, mood, and productivity. Technological collaborations and growing awareness of environmental impact and cost savings encourage adoption. Smart city projects and urban modernization further support market expansion.
Middle East & Africa (MEA) Human Centric Lighting Market Insights
The MEA market is emerging steadily, supported by demand for energy-efficient and sustainable infrastructure in GCC countries, South Africa, and Egypt. Smart city initiatives, LEED-certified buildings, and sustainable urban development drive adoption. The hospitality and healthcare sectors are leading end-users due to their focus on occupant comfort, wellness, and productivity. Investments in commercial real estate, infrastructure modernization, and IoT-enabled lighting systems support growth. Awareness campaigns and government incentives for green technologies are expected to further accelerate adoption.

Human Centric Lighting Market Key Players:
Some of the Human Centric Lighting Market Companies
-
Acuity Brands Inc.
-
ams-Osram AG
-
Cree Lighting LLC
-
Eaton
-
Fagerhults
-
Helvar
-
Hubbell Lighting
-
LEDVANCE GmbH
-
Legrand SA
-
Lutron Electronics Co. Inc.
-
Schneider Electric
-
Signify Holding
-
Trilux
-
Wipro
-
Zumtobel
-
Panasonic Corporation
-
GE Current, a Daintree Company
-
OSRAM GmbH
-
Acme Electric Company
-
Havells India Limited
Human Centric Lighting Market for Competitive Landscape:
-
In July 2024, Signify Partners partnered with Mercedes-AMG PETRONAS F1 to leverage Signify's expertise in sustainable lighting solutions. Signify will likely provide advanced lighting systems to the team's facilities, potentially including HCL technology to optimize athlete performance and well-being.
-
In February 2022, Crestron is making a significant push into HCL with a new line of LED light fixtures. It potentially allows lights to mimic natural sunlight patterns, enhancing the human biological response to light.
Report Attributes | Details |
Market Size in 2024 | USD 3.82 Billion |
Market Size by 2032 | USD 26.37 Billion |
CAGR | CAGR of 6.23% from 2025 to 2032 |
Base Year | 2024 |
Forecast Period | 2025-2032 |
Historical Data | 2021-2023 |
Report Scope & Coverage | Market Size, Segments Analysis, Competitive Landscape, Regional Analysis, DROC & SWOT Analysis, Forecast Outlook |
Key Segments | • By Type (New, Retrofit) • By Product (Fixtures, Services, Controllers, Software) • By Application(Residential ,Commercial) |
Regional Analysis/Coverage |
North America (US, Canada), Europe (Germany, France, UK, Italy, Spain, Poland, Russsia, Rest of Europe), Asia Pacific (China, India, Japan, South Korea, Australia,ASEAN Countries, Rest of Asia Pacific), Middle East & Africa (UAE, Saudi Arabia, Qatar, Egypt, South Africa, Rest of Middle East & Africa), Latin America (Brazil, Argentina, Mexico, Colombia Rest of Latin America) |
Company Profiles | Acuity Brands Inc., ams-Osram AG, Cree Lighting LLC, Eaton, Fagerhults, Helvar, Hubbell Lighting, LEDVANCE GmbH, Legrand SA, Lutron Electronics Co. Inc., Schneider Electric, Signify Holding, Trilux, Wipro, Zumtobel, , and others. |
Key Drivers | • Increasing awareness of health and well-being to empower people to make positive choices for a better life • Supportive government policies and regulations achieve desired social or economic outcomes |
RESTRAINTS | • High initial costs and implementation challenges require a large upfront investment and effort to get things started. • Complexity in integration with existing systems due to differences in technology, data formats, and communication protocols. |
Table Of Contents
1. Introduction
1.1 Market Definition & Scope
1.2 Research Assumptions & Abbreviations
1.3 Research Methodology
2. Executive Summary
2.1 Market Snapshot
2.2 Market Absolute $ Opportunity Assessment & Y-o-Y Analysis, 2021–2032
2.3 Market Size & Forecast, By Segmentation, 2021–2032
2.3.1 Market Size By Type
2.3.2 Market Size By Product
2.3.3 Market Size By Application
2.4 Market Share & Bps Analysis By Region, 2024
2.5 Industry Growth Scenarios – Conservative, Likely & Optimistic
2.6 Industry CxO’s Perspective
3. Market Overview
3.1 Market Dynamics
3.1.1 Drivers
3.1.2 Restraints
3.1.3 Opportunities
3.1.4 Key Market Trends
3.2 Industry PESTLE Analysis
3.3 Key Industry Forces (Porter’s) Impacting Market Growth
3.4 Industry Supply Chain Analysis
3.4.1 Raw Material Suppliers
3.4.2 Manufacturers
3.4.3 Distributors/Suppliers
3.4.4 Customers/End-Users
3.5 Industry Life Cycle Assessment
3.6 Parent Market Overview
3.7 Market Risk Assessment
4. Statistical Insights & Trends Reporting
4.1 Cost & Expenditure Patterns
4.1.1 Differences in unit pricing among ambient panels, task luminaires, circadian fixtures, and adaptive bulbs
4.1.2 Side-by-side evaluation of tunable LED arrays versus conventional lighting modules
4.1.3 Anticipated shifts shaped by rare-earth phosphors, driver electronics, and optical material scarcity
4.2 Manufacturing & Distribution Overview
4.2.1 Production capacity review in North America, Europe, Asia-Pacific, and Latin America
4.2.2 Dependence on raw components including dimmers, diffusers, and smart sensors
4.2.3 Cross-border shipment statistics for wellness, productivity, and residential installations
4.3 Innovation & Technology Insights
4.3.1 Breakthroughs in circadian-aligned, glare-free, and adaptive spectrum solutions
4.3.2 Investment trends targeting ergonomic, mood-enhancing, and energy-efficient designs
4.3.3 Market share analysis of bespoke configurations versus off-the-shelf lighting units
4.4 User & Environment Outcomes
4.4.1 Improvement in alertness, sleep regulation, and post-activity recuperation
4.4.2 Light uniformity, intensity modulation, and visual comfort performance
4.4.3 Longevity effects for architectural, healthcare, and educational installations
5. Aromatic Solvents Market Segmental Analysis & Forecast, By Type, 2021 – 2032, Value (USD Billion)
5.1 Introduction
5.2 New
5.2.1 Key Trends
5.2.2 Market Size & Forecast, 2021 – 2032
5.3 Retrofit
6. Aromatic Solvents Market Segmental Analysis & Forecast, By Product, 2021 – 2032, Value (USD Billion)
6.1 Introduction
6.2 Fixtures
6.2.1 Key Trends
6.2.2 Market Size & Forecast, 2021 – 2032
6.3 Services
6.4 Controllers
6.5 Software
7. Aromatic Solvents Market Segmental Analysis & Forecast, By Application, 2021 – 2032, Value (USD Billion)
7.1 Introduction
7.2 Residential
7.2.1 Key Trends
7.2.2 Market Size & Forecast, 2021 – 2032
7.3 Commercial
8. Aromatic Solvents Market Segmental Analysis & Forecast By Region, 2021 – 2025, Value (USD Billion)
8.1 Introduction
8.2 North America
8.2.1 Key Trends
8.2.2 Aromatic Solvents Market Size & Forecast, By Type, 2021 – 2032
8.2.3 Aromatic Solvents Market Size & Forecast, By Product, 2021 – 2032
8.2.4 Aromatic Solvents Market Size & Forecast, By Application, 2021 – 2032
8.2.5 Aromatic Solvents Market Size & Forecast, By Country, 2021 – 2032
8.2.5.1 USA
8.2.5.1.1 Aromatic Solvents Market Size & Forecast, By Type, 2021 – 2032
8.2.5.1.2 Aromatic Solvents Market Size & Forecast, By Product, 2021 – 2032
8.2.5.1.3 Aromatic Solvents Market Size & Forecast, By Application, 2021 – 2032
8.2.5.2 Canada
8.2.5.2.1 Aromatic Solvents Market Size & Forecast, By Type, 2021 – 2032
8.2.5.2.2 Aromatic Solvents Market Size & Forecast, By Product, 2021 – 2032
8.2.5.2.3 Aromatic Solvents Market Size & Forecast, By Application, 2021 – 2032
8.3 Europe
8.3.1 Key Trends
8.3.2 Aromatic Solvents Market Size & Forecast, By Type, 2021 – 2032
8.3.3 Aromatic Solvents Market Size & Forecast, By Product, 2021 – 2032
8.3.4 Aromatic Solvents Market Size & Forecast, By Application, 2021 – 2032
8.3.5 Aromatic Solvents Market Size & Forecast, By Country, 2021 – 2032
8.3.5.1 Germany
8.3.5.1.1 Aromatic Solvents Market Size & Forecast, By Type, 2021 – 2032
8.3.5.1.2 Aromatic Solvents Market Size & Forecast, By Product, 2021 – 2032
8.3.5.1.3 Aromatic Solvents Market Size & Forecast, By Application, 2021 – 2032
8.3.5.2 UK
8.3.5.2.1 Aromatic Solvents Market Size & Forecast, By Type, 2021 – 2032
8.3.5.2.2 Aromatic Solvents Market Size & Forecast, By Product, 2021 – 2032
8.3.5.2.3 Aromatic Solvents Market Size & Forecast, By Application, 2021 – 2032
8.3.5.3 France
8.3.5.3.1 Aromatic Solvents Market Size & Forecast, By Type, 2021 – 2032
8.3.5.3.2 Aromatic Solvents Market Size & Forecast, By Product, 2021 – 2032
8.3.5.3.3 Aromatic Solvents Market Size & Forecast, By Application, 2021 – 2032
8.3.5.4 Italy
8.3.5.4.1 Aromatic Solvents Market Size & Forecast, By Type, 2021 – 2032
8.3.5.4.2 Aromatic Solvents Market Size & Forecast, By Product, 2021 – 2032
8.3.5.4.3 Aromatic Solvents Market Size & Forecast, By Application, 2021 – 2032
8.3.5.5 Spain
8.3.5.5.1 Aromatic Solvents Market Size & Forecast, By Type, 2021 – 2032
8.3.5.5.2 Aromatic Solvents Market Size & Forecast, By Product, 2021 – 2032
8.3.5.5.3 Aromatic Solvents Market Size & Forecast, By Application, 2021 – 2032
8.3.5.6 Russia
8.3.5.6.1 Aromatic Solvents Market Size & Forecast, By Type, 2021 – 2032
8.3.5.6.2 Aromatic Solvents Market Size & Forecast, By Product, 2021 – 2032
8.3.5.6.3 Aromatic Solvents Market Size & Forecast, By Application, 2021 – 2032
8.3.5.7 Poland
8.3.5.7.1 Aromatic Solvents Market Size & Forecast, By Type, 2021 – 2032
8.3.5.7.2 Aromatic Solvents Market Size & Forecast, By Product, 2021 – 2032
8.3.5.7.3 Aromatic Solvents Market Size & Forecast, By Application, 2021 – 2032
8.3.5.8 Rest of Europe
8.3.5.8.1 Aromatic Solvents Market Size & Forecast, By Type, 2021 – 2032
8.3.5.8.2 Aromatic Solvents Market Size & Forecast, By Product, 2021 – 2032
8.3.5.8.3 Aromatic Solvents Market Size & Forecast, By Application, 2021 – 2032
8.4 Asia-Pacific
8.4.1 Key Trends
8.4.2 Aromatic Solvents Market Size & Forecast, By Type, 2021 – 2032
8.4.3 Aromatic Solvents Market Size & Forecast, By Product, 2021 – 2032
8.4.4 Aromatic Solvents Market Size & Forecast, By Application, 2021 – 2032
8.4.5 Aromatic Solvents Market Size & Forecast, By Country, 2021 – 2032
8.4.5.1 China
8.4.5.1.1 Aromatic Solvents Market Size & Forecast, By Type, 2021 – 2032
8.4.5.1.2 Aromatic Solvents Market Size & Forecast, By Product, 2021 – 2032
8.4.5.1.3 Aromatic Solvents Market Size & Forecast, By Application, 2021 – 2032
8.4.5.2 India
8.4.5.2.1 Aromatic Solvents Market Size & Forecast, By Type, 2021 – 2032
8.4.5.2.2 Aromatic Solvents Market Size & Forecast, By Product, 2021 – 2032
8.4.5.2.3 Aromatic Solvents Market Size & Forecast, By Application, 2021 – 2032
8.4.5.3 Japan
8.4.5.3.1 Aromatic Solvents Market Size & Forecast, By Type, 2021 – 2032
8.4.5.3.2 Aromatic Solvents Market Size & Forecast, By Product, 2021 – 2032
8.4.5.3.3 Aromatic Solvents Market Size & Forecast, By Application, 2021 – 2032
8.4.5.4 South Korea
8.4.5.4.1 Aromatic Solvents Market Size & Forecast, By Type, 2021 – 2032
8.4.5.4.2 Aromatic Solvents Market Size & Forecast, By Product, 2021 – 2032
8.4.5.4.3 Aromatic Solvents Market Size & Forecast, By Application, 2021 – 2032
8.4.5.5 Australia
8.4.5.5.1 Aromatic Solvents Market Size & Forecast, By Type, 2021 – 2032
8.4.5.5.2 Aromatic Solvents Market Size & Forecast, By Product, 2021 – 2032
8.4.5.5.3 Aromatic Solvents Market Size & Forecast, By Application, 2021 – 2032
8.4.5.6 ASEAN Countries
8.4.5.6.1 Aromatic Solvents Market Size & Forecast, By Type, 2021 – 2032
8.4.5.6.2 Aromatic Solvents Market Size & Forecast, By Product, 2021 – 2032
8.4.5.6.3 Aromatic Solvents Market Size & Forecast, By Application, 2021 – 2032
8.4.5.7 Rest of Asia-Pacific
8.4.5.7.1 Aromatic Solvents Market Size & Forecast, By Type, 2021 – 2032
8.4.5.7.2 Aromatic Solvents Market Size & Forecast, By Product, 2021 – 2032
8.4.5.7.3 Aromatic Solvents Market Size & Forecast, By Application, 2021 – 2032
8.5 Latin America
8.5.1 Key Trends
8.5.2 Aromatic Solvents Market Size & Forecast, By Type, 2021 – 2032
8.5.3 Aromatic Solvents Market Size & Forecast, By Product, 2021 – 2032
8.5.4 Aromatic Solvents Market Size & Forecast, By Application, 2021 – 2032
8.5.5 Aromatic Solvents Market Size & Forecast, By Country, 2021 – 2032
8.5.5.1 Brazil
8.5.5.1.1 Aromatic Solvents Market Size & Forecast, By Type, 2021 – 2032
8.5.5.1.2 Aromatic Solvents Market Size & Forecast, By Product, 2021 – 2032
8.5.5.1.3 Aromatic Solvents Market Size & Forecast, By Application, 2021 – 2032
8.5.5.2 Argentina
8.5.5.2.1 Aromatic Solvents Market Size & Forecast, By Type, 2021 – 2032
8.5.5.2.2 Aromatic Solvents Market Size & Forecast, By Product, 2021 – 2032
8.5.5.2.3 Aromatic Solvents Market Size & Forecast, By Application, 2021 – 2032
8.5.5.3 Mexico
8.5.5.3.1 Aromatic Solvents Market Size & Forecast, By Type, 2021 – 2032
8.5.5.3.2 Aromatic Solvents Market Size & Forecast, By Product, 2021 – 2032
8.5.5.3.3 Aromatic Solvents Market Size & Forecast, By Application, 2021 – 2032
8.5.5.4 Colombia
8.5.5.4.1 Aromatic Solvents Market Size & Forecast, By Type, 2021 – 2032
8.5.5.4.2 Aromatic Solvents Market Size & Forecast, By Product, 2021 – 2032
8.5.5.4.3 Aromatic Solvents Market Size & Forecast, By Application, 2021 – 2032
8.5.5.5 Rest of Latin America
8.5.5.5.1 Aromatic Solvents Market Size & Forecast, By Type, 2021 – 2032
8.5.5.5.2 Aromatic Solvents Market Size & Forecast, By Product, 2021 – 2032
8.5.5.5.3 Aromatic Solvents Market Size & Forecast, By Application, 2021 – 2032
8.6 Middle East & Africa
8.6.1 Key Trends
8.6.2 Aromatic Solvents Market Size & Forecast, By Type, 2021 – 2032
8.6.3 Aromatic Solvents Market Size & Forecast, By Product, 2021 – 2032
8.6.4 Aromatic Solvents Market Size & Forecast, By Application, 2021 – 2032
8.6.5 Aromatic Solvents Market Size & Forecast, By Country, 2021 – 2032
8.6.5.1 UAE
8.6.5.1.1 Aromatic Solvents Market Size & Forecast, By Type, 2021 – 2032
8.6.5.1.2 Aromatic Solvents Market Size & Forecast, By Product, 2021 – 2032
8.6.5.1.3 Aromatic Solvents Market Size & Forecast, By Application, 2021 – 2032
8.6.5.2 Saudi Arabia
8.6.5.2.1 Aromatic Solvents Market Size & Forecast, By Type, 2021 – 2032
8.6.5.2.2 Aromatic Solvents Market Size & Forecast, By Product, 2021 – 2032
8.6.5.2.3 Aromatic Solvents Market Size & Forecast, By Application, 2021 – 2032
8.6.5.3 Qatar
8.6.5.3.1 Aromatic Solvents Market Size & Forecast, By Type, 2021 – 2032
8.6.5.3.2 Aromatic Solvents Market Size & Forecast, By Product, 2021 – 2032
8.6.5.3.3 Aromatic Solvents Market Size & Forecast, By Application, 2021 – 2032
8.6.5.4 Egypt
8.6.5.4.1 Aromatic Solvents Market Size & Forecast, By Type, 2021 – 2032
8.6.5.4.2 Aromatic Solvents Market Size & Forecast, By Product, 2021 – 2032
8.6.5.4.3 Aromatic Solvents Market Size & Forecast, By Application, 2021 – 2032
8.6.5.5 South Africa
8.6.5.5.1 Aromatic Solvents Market Size & Forecast, By Type, 2021 – 2032
8.6.5.5.2 Aromatic Solvents Market Size & Forecast, By Product, 2021 – 2032
8.6.5.5.3 Aromatic Solvents Market Size & Forecast, By Application, 2021 – 2032
8.6.5.6 Rest of Middle East & Africa
8.6.5.6.1 Aromatic Solvents Market Size & Forecast, By Type, 2021 – 2032
8.6.5.6.2 Aromatic Solvents Market Size & Forecast, By Product, 2021 – 2032
8.6.5.6.3 Aromatic Solvents Market Size & Forecast, By Application, 2021 – 2032
9. Competitive Landscape
9.1 Key Players' Positioning
9.2 Competitive Developments
9.2.1 Key Strategies Adopted (%), By Key Players, 2024
9.2.2 Year-Wise Strategies & Development, 2021 – 2025
9.2.3 Number Of Strategies Adopted By Key Players, 2024
9.3 Market Share Analysis, 2024
9.4 Product/Service & Application Benchmarking
9.4.1 Product/Service Specifications & Features By Key Players
9.4.2 Product/Service Heatmap By Key Players
9.4.3 Application Heatmap By Key Players
9.5 Industry Start-Up & Innovation Landscape
9.6 Key Company Profiles
9.6.1 Acuity Brands Inc.
9.6.1.1 Company Overview & Snapshot
9.6.1.2 Product/Service Portfolio
9.6.1.3 Key Company Financials
9.6.1.4 SWOT Analysis
9.6.2 ams-Osram AG
9.6.3 Cree Lighting LLC
9.6.4 Eaton
9.6.5 Fagerhults
9.6.6 Helvar
9.6.7 Hubbell Lighting
9.6.8 LEDVANCE GmbH
9.6.9 Legrand SA
9.6.10 Lutron Electronics Co. Inc.
9.6.11 Schneider Electric
9.6.12 Signify Holding
9.6.13 Trilux
9.6.14 Wipro
9.6.15 Zumtobel
9.6.16 Panasonic Corporation
9.6.17 GE Current, a Daintree Company
9.6.18 OSRAM GmbH
9.6.19 Acme Electric Company
9.6.20 Havells India Limited
10. Analyst Recommendations
10.1 SNS Insider Opportunity Map
10.2 Industry Low-Hanging Fruit Assessment
10.3 Market Entry & Growth Strategy
10.4 Analyst Viewpoint & Suggestions On Market Growth
11. Assumptions
12. Disclaimer
13. Appendix
13.1 List Of Tables
13.2 List Of Figures
Key Segments:
By Type
-
New
-
Retrofit
By Product
-
Fixtures
-
Services
-
Controllers
-
Software
By Application
-
Residential
-
Commercial
Request for Segment Customization as per your Business Requirement: Segment Customization Request
Regional Coverage:
North America
-
US
-
Canada
Europe
-
Germany
-
UK
-
France
-
Italy
-
Spain
-
Russia
-
Poland
-
Rest of Europe
Asia Pacific
-
China
-
India
-
Japan
-
South Korea
-
ASEAN Countries
-
Australia
-
Rest of Asia Pacific
Latin America
-
Brazil
-
Argentina
-
Mexico
-
Colombia
-
Rest of Latin America
Middle East & Africa
-
UAE
-
Saudi Arabia
-
Qatar
-
Egypt
-
South Africa
-
Rest of Middle East & Africa
Request for Country Level Research Report: Country Level Customization Request
Available Customization
With the given market data, SNS Insider offers customization as per the company’s specific needs. The following customization options are available for the report:
-
Detailed Volume Analysis
-
Criss-Cross segment analysis (e.g. Product X Application)
-
Competitive Product Benchmarking
-
Geographic Analysis
-
Additional countries in any of the regions
-
Customized Data Representation
-
Detailed analysis and profiling of additional market players
An accurate research report requires proper strategizing as well as implementation. There are multiple factors involved in the completion of good and accurate research report and selecting the best methodology to compete the research is the toughest part. Since the research reports we provide play a crucial role in any company’s decision-making process, therefore we at SNS Insider always believe that we should choose the best method which gives us results closer to reality. This allows us to reach at a stage wherein we can provide our clients best and accurate investment to output ratio.
Each report that we prepare takes a timeframe of 350-400 business hours for production. Starting from the selection of titles through a couple of in-depth brain storming session to the final QC process before uploading our titles on our website we dedicate around 350 working hours. The titles are selected based on their current market cap and the foreseen CAGR and growth.
The 5 steps process:
Step 1: Secondary Research:
Secondary Research or Desk Research is as the name suggests is a research process wherein, we collect data through the readily available information. In this process we use various paid and unpaid databases which our team has access to and gather data through the same. This includes examining of listed companies’ annual reports, Journals, SEC filling etc. Apart from this our team has access to various associations across the globe across different industries. Lastly, we have exchange relationships with various university as well as individual libraries.

Step 2: Primary Research
When we talk about primary research, it is a type of study in which the researchers collect relevant data samples directly, rather than relying on previously collected data. This type of research is focused on gaining content specific facts that can be sued to solve specific problems. Since the collected data is fresh and first hand therefore it makes the study more accurate and genuine.
We at SNS Insider have divided Primary Research into 2 parts.
Part 1 wherein we interview the KOLs of major players as well as the upcoming ones across various geographic regions. This allows us to have their view over the market scenario and acts as an important tool to come closer to the accurate market numbers. As many as 45 paid and unpaid primary interviews are taken from both the demand and supply side of the industry to make sure we land at an accurate judgement and analysis of the market.
This step involves the triangulation of data wherein our team analyses the interview transcripts, online survey responses and observation of on filed participants. The below mentioned chart should give a better understanding of the part 1 of the primary interview.

Part 2: In this part of primary research the data collected via secondary research and the part 1 of the primary research is validated with the interviews from individual consultants and subject matter experts.
Consultants are those set of people who have at least 12 years of experience and expertise within the industry whereas Subject Matter Experts are those with at least 15 years of experience behind their back within the same space. The data with the help of two main processes i.e., FGDs (Focused Group Discussions) and IDs (Individual Discussions). This gives us a 3rd party nonbiased primary view of the market scenario making it a more dependable one while collation of the data pointers.
Step 3: Data Bank Validation
Once all the information is collected via primary and secondary sources, we run that information for data validation. At our intelligence centre our research heads track a lot of information related to the market which includes the quarterly reports, the daily stock prices, and other relevant information. Our data bank server gets updated every fortnight and that is how the information which we collected using our primary and secondary information is revalidated in real time.

Step 4: QA/QC Process
After all the data collection and validation our team does a final level of quality check and quality assurance to get rid of any unwanted or undesired mistakes. This might include but not limited to getting rid of the any typos, duplication of numbers or missing of any important information. The people involved in this process include technical content writers, research heads and graphics people. Once this process is completed the title gets uploader on our platform for our clients to read it.
Step 5: Final QC/QA Process:
This is the last process and comes when the client has ordered the study. In this process a final QA/QC is done before the study is emailed to the client. Since we believe in giving our clients a good experience of our research studies, therefore, to make sure that we do not lack at our end in any way humanly possible we do a final round of quality check and then dispatch the study to the client.