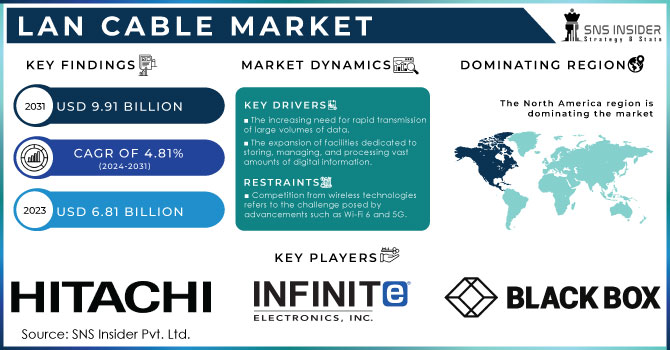
The LAN Cable Market Size was valued at USD 14.08 Billion in 2023 and is expected to reach USD 44.41 Billion by 2032 and grow at a CAGR of 13.63% over the forecast period 2024-2032.
The LAN (Local Area Network) Cable Market is undergoing transformative growth, which is being driven by the increasing need for high-speed and reliable network connectivity across residential, commercial, and industrial sectors. Global government policies and initiatives have taken up significant roles in terms of further boosting the demand in 2023 and 2024. For example, Europe's "Digital Decade" program focuses on full digital transformation, while India's "Digital India" initiative is focused on strengthening broadband infrastructure.
Get more information on LAN Cable Market - Request Sample Report
For instance, India is preparing for a significant advancement in digital connectivity with the introduction of three new subsea cable projects. In August 2024, reports indicated that projects—2Africa Pearls, India-Asia-Express (IAX), and India-Europe-Express (IEX)—are anticipated to increase India’s internet capacity fourfold, greatly enhancing the speed and dependability of its digital connectivity. Similarly, in the United States, a good amount of investment has gone into legacy networks upgradation as well as to promote advanced connectivity solutions in their infrastructure development agenda. These programs have boosted high-performance LAN cables deployment in the urban and industrial centers.
Technology is also remodeling the LAN cable market landscape. Innovations such as Cat 7 and Cat 8 cables, which provide ultra-fast data transfer speeds and minimal interference, gained significant traction in 2024 and are set to expand further in 2025. The growing adoption of IoT devices, smart homes, and industrial automation systems necessitates robust and efficient LAN cables to handle complex network requirements. Other innovations brought to the table in 2023 were environmentally friendly LAN cables, driven by the trend towards green and consumer-friendly products across the world.
The opportunities ahead for the LAN cable market are limitless, as is the promise that a variety of emerging trends bring. Rising dependency on cloud computing and other forms of digital services has caused data centers to increase dramatically and have become very popular; such infrastructure requires more complex LAN cables. Other major growth drivers are the deployment of 5G networks and smart city projects in countries across the globe. Over 75% of the global organizations will implement hybrid work models by 2024, meaning more dependability in remote working network solutions will drive demand for LAN cables.
Government and industry sources show data on the significant role LAN cables play in modernizing digital ecosystems. Continued investment in the upgrade of digital infrastructure and advances in cable technology mean that the LAN cable market is here to stay, an integral part of global connectivity solutions that drives innovation and economic development.
Key Drivers:
Expansion of Data Centers and Increasing Need for High-Performance LAN Cables in Hybrid Cloud Age
Data centers are very crucial in the support of global internet and cloud services. The data center deployment is expected to increase by 25% by 2024, with exponential growth in the generation, storage, and processing of data. New data centers are being established, and the private and government sectors are contributing significantly, particularly from the U.S., India, and China. LAN cables are very crucial for the interconnection of servers and for fast, low-latency data transfer.
As more than 80% of the enterprises are likely to shift towards hybrid cloud solutions by 2024, demand for high-performance LAN cables like Cat 6 and Cat 7 is going to increase dramatically. These cables ensure the required bandwidth and reliability needed for handling heavy loads of data and, thus, are a significant part of the modern data center infrastructure.
Increasing Need for LAN Cables Fueled by IoT Development and Expansion of Smart Home Technologies
There is an ever-increasing level of proliferation with IoT and smart home devices as it continues to grow worldwide; the estimation reached 35% in 2023. At the same time, there would be an exceeding number of interconnected IoT devices - more than 32 billion-in 2030 worldwide. They strictly depend on LAN cables for proper and efficient communication networking.
Fast developing smart home technology, particularly among North American and European customers, has boosted their demand for such network infrastructures. LAN cables, especially Cat 7 and Cat 8, are necessary for providing the gigabit speeds with minimal interference to support these applications. Governmental initiatives that enhance digital transformation are also increasing through subsidies on smart devices in places like Germany and the U.S. Therefore, the demand for LAN cables also increases.
Restrain:
The cost of installing and maintaining LAN cable networks is still a major challenge for the market.
High installation and maintenance costs have hindered the adoption of LAN cables in some regions, especially in developing economies. For example, installing advanced LAN cable networks such as Cat 7 or Cat 8 is 40% more expensive than standard options. These costs include purchasing high-grade materials, specialized labor for installation, and maintenance. Small and medium-sized enterprises (SMEs), which constitute 70% of businesses in emerging markets, usually find these costs too expensive. In addition, the cost of upgrading legacy systems to support newer LAN cables adds to the expense.
Government subsidies and tax benefits in North America and Europe have partly compensated for these costs, but other regions are limited by such incentives. In these cost-sensitive markets, the business continues to use less advanced alternatives, and the modern LAN cable is not used on a mass scale. This is the main reason why these cost-related issues must be overcome in order to realize the full potential of the LAN cable market.
By Application
In 2023, the Industrial Use segment dominated the LAN Cable Market, accounting for 48% of the market share. This is largely due to increased use of LAN cables in manufacturing units, logistics stations, and similar industrial establishments needing high-speed data transfer and effective network connectivity. The incorporation of automation and robots in industries escalated the demand for advanced LAN cables as well.
During the forecast period of 2024-2032, the Industrial Use segment is expected to grow at the fastest CAGR of 13.78%. It is driven by the emergent Industry 4.0 and smart factories that require high-bandwidth LAN cables for interconnected machines and real-time data analytics. Industry initiatives such as Germany's "Industry 4.0" program also are expected to boost further this segment. The remaining applications, which comprise commercial and residential uses, maintain a steady level of growth with the rising penetration of IoT devices and smart home technologies.
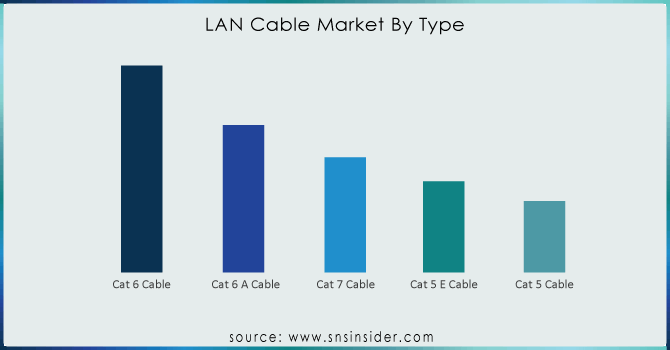
By Type
In 2023, Cat 6 cables dominated the LAN Cable Market. This type of cable was used in 33% of the market share because of its widespread application in commercial and residential areas. Cat 6 cables are superior in performance for gigabit Ethernet, which makes them applicable to many applications where reliable connectivity is needed.
The Cat 7 cable segment is expected to grow at the fastest CAGR of 14.40% during the forecast period of 2024-2032. Cat 7 cables offer better performance, including higher bandwidth and reduced interference, making them ideal for modern data centers and industrial networks. Increasing high-speed network deployment and a shift towards 10 Gbps Ethernet standards are driving demand for Cat 7 cables. In addition, the advancement of technology and growth in future-proofed networking infrastructure are definitely going to add considerable value to the market segment.
North America led the LAN Cable Market in 2023, with 36% of the market share. This can be attributed to the high penetration of advanced networking solutions in both industries and residential sectors. In addition, huge investments in data centers and supportive government policies toward digital infrastructure have increased the demand for LAN cables in the U.S. and Canada.
Europe is expected to lead the market in terms of CAGR at 13.95% during the forecast period of 2024-2032. This is due to rising investments in smart city projects and the adoption of Industry 4.0 technologies. Germany, France, and the U.K. are leading the way in digital infrastructure upgradation, which is a lucrative opportunity for LAN cable manufacturers.
Need any customization research on LAN Cable Market - Enquiry Now
Some of the Major Players in the LAN Cable Market Are
Belden Inc. (Cat 6 Cables, Cat 5e Cables)
Nexans (Cat 7 Cables, Cat 6A Cables)
Prysmian Group (Fiber Optic Cables, Cat 6 Cables)
Leviton Manufacturing Co., Inc. (Patch Cords, Ethernet Cables)
CommScope (Coaxial Cables, Fiber Patch Panels)
Schneider Electric (Cat 6A Cables, Patch Panels)
Panduit (Copper Cables, Fiber Optic Cables)
Siemon (High-Speed Patch Cords, Cat 7 Cables)
Superior Essex (Cat 5e Cables, Coaxial Cables)
TE Connectivity (RJ45 Connectors, Cat 6 Cables)
General Cable (Ethernet Cables, Fiber Optic Cables)
LS Cable & System (LAN Cables, Fiber Optic Cables)
Molex (Patch Cords, Cat 6A Cables)
Corning Incorporated (Fiber Optic Solutions, Connectors)
Hitachi Cable America (Cat 6A Cables, Fiber Optic Cables)
Allied Wire & Cable (Bulk LAN Cables, Patch Cords)
AMP Netconnect (Copper LAN Cables, Fiber Patch Cords)
Draka Communications (Cat 6 Cables, Fiber Optic Cables)
3M (Fiber Connectors, Cable Assemblies)
Fujikura (Fiber Cables, Connectors)
Major Suppliers (Components, Technologies)
Dow Chemical (Insulation Materials, Conductors)
BASF SE (Polymer Materials, Additives)
DuPont (Flame Retardants, Jacketing Materials)
Borealis AG (Polyethylene Compounds, Cable Insulation)
SABIC (Polypropylene, Polyethylene)
Arkema (Specialty Polymers, High-Performance Compounds)
Covestro (Polyurethane, Advanced Resins)
ExxonMobil (High-Density Polyethylene, Cable Fillers)
Solvay (Polyvinyl Chloride, Advanced Polymers)
LG Chem (Plasticizers, PVC Compounds)
Major Clients
Microsoft
Amazon Web Services
AT&T
Verizon
Cisco Systems
IBM
Facebook (Meta)
Huawei
Siemens
August 2024: Prysmian, a leading global company in the energy and telecommunications cable systems sector, reports the successful conclusion of sea trial assessments for the ultra-deep installation of a 500 kV HVDC MI1 cable at a depth of 2,150 meters. This represents a record-setting installation in the LAN Cable Market, being the first instance of an HVDC cable being placed at such a depth, establishing new standards for the market.
July 2024: To progress with its strategy to reduce its substantial debt burden, CommScope has finalized an agreement to sell its outdoor wireless networks (OWN) division and its distributed antenna systems (DAS) operations to Amphenol Corp. for $2.1 billion.
Report Attributes | Details |
---|---|
Market Size in 2023 |
USD 14.08 Billion |
Market Size by 2032 |
USD 44.41 Billion |
CAGR |
CAGR of 13.63% From 2024 to 2032 |
Base Year |
2023 |
Forecast Period |
2024-2032 |
Historical Data |
2020-2022 |
Report Scope & Coverage |
Market Size, Segments Analysis, Competitive Landscape, Regional Analysis, DROC & SWOT Analysis, Forecast Outlook |
Key Segments |
• By Type (Cat 7 Cable, Cat 6 Cable, Cat 6 A Cable, Cat 5 Cable, Cat 5 E Cable) |
Regional Analysis/Coverage |
North America (US, Canada, Mexico), Europe (Eastern Europe [Poland, Romania, Hungary, Turkey, Rest of Eastern Europe] Western Europe] Germany, France, UK, Italy, Spain, Netherlands, Switzerland, Austria, Rest of Western Europe]), Asia Pacific (China, India, Japan, South Korea, Vietnam, Singapore, Australia, Rest of Asia Pacific), Middle East & Africa (Middle East [UAE, Egypt, Saudi Arabia, Qatar, Rest of Middle East], Africa [Nigeria, South Africa, Rest of Africa], Latin America (Brazil, Argentina, Colombia, Rest of Latin America) |
Company Profiles |
Belden Inc., Nexans, Prysmian Group, Leviton Manufacturing Co., Inc., CommScope, Schneider Electric, Panduit, Siemon, Superior Essex, TE Connectivity, General Cable, LS Cable & System, Molex, Corning Incorporated, Hitachi Cable America, Allied Wire & Cable, AMP Netconnect, Draka Communications, 3M, Fujikura. |
Key Drivers |
• Expansion of Data Centers and Increasing Need for High-Performance LAN Cables in Hybrid Cloud Age. |
Restraints |
• The cost of installing and maintaining LAN cable networks is still a major challenge for the market. |
Ans: The LAN Cable Market is expected to grow at a CAGR of 13.63% during 2024-2032.
Ans: LAN Cable Market size was USD 14.08 Billion in 2023 and is expected to Reach USD 44.41 Billion by 2032.
Ans: The major growth factors of the LAN Cable Market are Increased Deployment of Data Centers Worldwide and Increasing Adoption of IoT and Smart Home Devices.
Ans: The Cat 6 cables segment dominated the LAN Cable Market.
Ans: North America dominated the LAN Cable Market in 2023.
1. Introduction
1.1 Market Definition
1.2 Scope (Inclusion and Exclusions)
1.3 Research Assumptions
2. Executive Summary
2.1 Market Overview
2.2 Regional Synopsis
2.3 Competitive Summary
3. Research Methodology
3.1 Top-Down Approach
3.2 Bottom-up Approach
3.3. Data Validation
3.4 Primary Interviews
4. Market Dynamics Impact Analysis
4.1 Market Driving Factors Analysis
4.1.2 Drivers
4.1.2 Restraints
4.2 PESTLE Analysis
4.3 Porter’s Five Forces Model
5. Statistical Insights and Trends Reporting
5.1 Key Vendors and Feature Analysis, 2023
5.2 Performance Benchmarks, 2023
5.3 Integration Capabilities
5.4 Usage Statistics, 2023
6. Competitive Landscape
6.1 List of Major Companies, By Region
6.2 Market Share Analysis, By Region
6.3 Product Benchmarking
6.3.1 Product specifications and features
6.3.2 Pricing
6.4 Strategic Initiatives
6.4.1 Marketing and promotional activities
6.4.2 Distribution and supply chain strategies
6.4.3 Expansion plans and new product launches
6.4.4 Strategic partnerships and collaborations
6.5 Technological Advancements
6.6 Market Positioning and Branding
7. LAN Cable Market Segmentation, by Type
7.1 Chapter Overview
7.2 Cat 7 Cable
7.2.1 Cat 7 Cable Market Trends Analysis (2020-2032)
7.2.2 Cat 7 Cable Market Size Estimates and Forecasts to 2032 (USD Billion)
7.3 Cat 6 Cable
7.3.1 Cat 6 Cable Market Trends Analysis (2020-2032)
7.3.2 Cat 6 Cable Market Size Estimates and Forecasts to 2032 (USD Billion)
7.4 Cat 6 A Cable
7.4.1 Cat 6 A Cable Market Trends Analysis (2020-2032)
7.4.2 Cat 6 A Cable Market Size Estimates and Forecasts to 2032 (USD Billion)
7.4 Cat 5 Cable
7.4.1 Cat 5 Cable Market Trends Analysis (2020-2032)
7.4.2 Cat 5 Cable Market Size Estimates and Forecasts to 2032 (USD Billion)
7.4 Cat 5 E Cable
7.4.1 Cat 5 E Cable Market Trends Analysis (2020-2032)
7.4.2 Cat 5 E Cable Market Size Estimates and Forecasts to 2032 (USD Billion)
8. LAN Cable Market Segmentation, By Application
8.1 Chapter Overview
8.2 Commercial Use
8.2.1 Commercial Use Market Trends Analysis (2020-2032)
8.2.2 Commercial Use Market Size Estimates and Forecasts to 2032 (USD Billion)
8.3 Office Use
8.3.1 Office Use Market Trends Analysis (2020-2032)
8.3.2 Office Use Market Size Estimates and Forecasts to 2032 (USD Billion)
8.4 Industrial Use
8.4.1 Industrial Use Market Trends Analysis (2020-2032)
8.4.2 Industrial Use Market Size Estimates and Forecasts to 2032 (USD Billion)
9. Regional Analysis
9.1 Chapter Overview
9.2 North America
9.2.1 Trends Analysis
9.2.2 North America LAN Cable Market Estimates and Forecasts, by Country (2020-2032) (USD Billion)
9.2.3 North America LAN Cable Market Estimates and Forecasts, by Type (2020-2032) (USD Billion)
9.2.4 North America LAN Cable Market Estimates and Forecasts, By Application (2020-2032) (USD Billion)
9.2.5 USA
9.2.5.1 USA LAN Cable Market Estimates and Forecasts, by Type (2020-2032) (USD Billion)
9.2.5.2 USA LAN Cable Market Estimates and Forecasts, By Application (2020-2032) (USD Billion)
9.2.6 Canada
9.2.6.1 Canada LAN Cable Market Estimates and Forecasts, by Type (2020-2032) (USD Billion)
9.2.6.2 Canada LAN Cable Market Estimates and Forecasts, By Application (2020-2032) (USD Billion)
9.2.7 Mexico
9.2.7.1 Mexico LAN Cable Market Estimates and Forecasts, by Type (2020-2032) (USD Billion)
9.2.7.2 Mexico LAN Cable Market Estimates and Forecasts, By Application (2020-2032) (USD Billion)
9.3 Europe
9.3.1 Eastern Europe
9.3.1.1 Trends Analysis
9.3.1.2 Eastern Europe LAN Cable Market Estimates and Forecasts, by Country (2020-2032) (USD Billion)
9.3.1.3 Eastern Europe LAN Cable Market Estimates and Forecasts, by Type (2020-2032) (USD Billion)
9.3.1.4 Eastern Europe LAN Cable Market Estimates and Forecasts, By Application (2020-2032) (USD Billion)
9.3.1.5 Poland
9.3.1.5.1 Poland LAN Cable Market Estimates and Forecasts, by Type (2020-2032) (USD Billion)
9.3.1.5.2 Poland LAN Cable Market Estimates and Forecasts, By Application (2020-2032) (USD Billion)
9.3.1.6 Romania
9.3.1.6.1 Romania LAN Cable Market Estimates and Forecasts, by Type (2020-2032) (USD Billion)
9.3.1.6.2 Romania LAN Cable Market Estimates and Forecasts, By Application (2020-2032) (USD Billion)
9.3.1.7 Hungary
9.3.1.7.1 Hungary LAN Cable Market Estimates and Forecasts, by Type (2020-2032) (USD Billion)
9.3.1.7.2 Hungary LAN Cable Market Estimates and Forecasts, By Application (2020-2032) (USD Billion)
9.3.1.8 Turkey
9.3.1.8.1 Turkey LAN Cable Market Estimates and Forecasts, by Type (2020-2032) (USD Billion)
9.3.1.8.2 Turkey LAN Cable Market Estimates and Forecasts, By Application (2020-2032) (USD Billion)
9.3.1.9 Rest of Eastern Europe
9.3.1.9.1 Rest of Eastern Europe LAN Cable Market Estimates and Forecasts, by Type (2020-2032) (USD Billion)
9.3.1.9.2 Rest of Eastern Europe LAN Cable Market Estimates and Forecasts, By Application (2020-2032) (USD Billion)
9.3.2 Western Europe
9.3.2.1 Trends Analysis
9.3.2.2 Western Europe LAN Cable Market Estimates and Forecasts, by Country (2020-2032) (USD Billion)
9.3.2.3 Western Europe LAN Cable Market Estimates and Forecasts, by Type (2020-2032) (USD Billion)
9.3.2.4 Western Europe LAN Cable Market Estimates and Forecasts, By Application (2020-2032) (USD Billion)
9.3.2.5 Germany
9.3.2.5.1 Germany LAN Cable Market Estimates and Forecasts, by Type (2020-2032) (USD Billion)
9.3.2.5.2 Germany LAN Cable Market Estimates and Forecasts, By Application (2020-2032) (USD Billion)
9.3.2.6 France
9.3.2.6.1 France LAN Cable Market Estimates and Forecasts, by Type (2020-2032) (USD Billion)
9.3.2.6.2 France LAN Cable Market Estimates and Forecasts, By Application (2020-2032) (USD Billion)
9.3.2.7 UK
9.3.2.7.1 UK LAN Cable Market Estimates and Forecasts, by Type (2020-2032) (USD Billion)
9.3.2.7.2 UK LAN Cable Market Estimates and Forecasts, By Application (2020-2032) (USD Billion)
9.3.2.8 Italy
9.3.2.8.1 Italy LAN Cable Market Estimates and Forecasts, by Type (2020-2032) (USD Billion)
9.3.2.8.2 Italy LAN Cable Market Estimates and Forecasts, By Application (2020-2032) (USD Billion)
9.3.2.9 Spain
9.3.2.9.1 Spain LAN Cable Market Estimates and Forecasts, by Type (2020-2032) (USD Billion)
9.3.2.9.2 Spain LAN Cable Market Estimates and Forecasts, By Application (2020-2032) (USD Billion)
9.3.2.10 Netherlands
9.3.2.10.1 Netherlands LAN Cable Market Estimates and Forecasts, by Type (2020-2032) (USD Billion)
9.3.2.10.2 Netherlands LAN Cable Market Estimates and Forecasts, By Application (2020-2032) (USD Billion)
9.3.2.11 Switzerland
9.3.2.11.1 Switzerland LAN Cable Market Estimates and Forecasts, by Type (2020-2032) (USD Billion)
9.3.2.11.2 Switzerland LAN Cable Market Estimates and Forecasts, By Application (2020-2032) (USD Billion)
9.3.2.12 Austria
9.3.2.12.1 Austria LAN Cable Market Estimates and Forecasts, by Type (2020-2032) (USD Billion)
9.3.2.12.2 Austria LAN Cable Market Estimates and Forecasts, By Application (2020-2032) (USD Billion)
9.3.2.13 Rest of Western Europe
9.3.2.13.1 Rest of Western Europe LAN Cable Market Estimates and Forecasts, by Type (2020-2032) (USD Billion)
9.3.2.13.2 Rest of Western Europe LAN Cable Market Estimates and Forecasts, By Application (2020-2032) (USD Billion)
9.4 Asia Pacific
9.4.1 Trends Analysis
9.4.2 Asia Pacific LAN Cable Market Estimates and Forecasts, by Country (2020-2032) (USD Billion)
9.4.3 Asia Pacific LAN Cable Market Estimates and Forecasts, by Type (2020-2032) (USD Billion)
9.4.4 Asia Pacific LAN Cable Market Estimates and Forecasts, By Application (2020-2032) (USD Billion)
9.4.5 China
9.4.5.1 China LAN Cable Market Estimates and Forecasts, by Type (2020-2032) (USD Billion)
9.4.5.2 China LAN Cable Market Estimates and Forecasts, By Application (2020-2032) (USD Billion)
9.4.6 India
9.4.5.1 India LAN Cable Market Estimates and Forecasts, by Type (2020-2032) (USD Billion)
9.4.5.2 India LAN Cable Market Estimates and Forecasts, By Application (2020-2032) (USD Billion)
9.4.5 Japan
9.4.5.1 Japan LAN Cable Market Estimates and Forecasts, by Type (2020-2032) (USD Billion)
9.4.5.2 Japan LAN Cable Market Estimates and Forecasts, By Application (2020-2032) (USD Billion)
9.4.6 South Korea
9.4.6.1 South Korea LAN Cable Market Estimates and Forecasts, by Type (2020-2032) (USD Billion)
9.4.6.2 South Korea LAN Cable Market Estimates and Forecasts, By Application (2020-2032) (USD Billion)
9.4.7 Vietnam
9.4.7.1 Vietnam LAN Cable Market Estimates and Forecasts, by Type (2020-2032) (USD Billion)
9.2.7.2 Vietnam LAN Cable Market Estimates and Forecasts, By Application (2020-2032) (USD Billion)
9.4.8 Singapore
9.4.8.1 Singapore LAN Cable Market Estimates and Forecasts, by Type (2020-2032) (USD Billion)
9.4.8.2 Singapore LAN Cable Market Estimates and Forecasts, By Application (2020-2032) (USD Billion)
9.4.9 Australia
9.4.9.1 Australia LAN Cable Market Estimates and Forecasts, by Type (2020-2032) (USD Billion)
9.4.9.2 Australia LAN Cable Market Estimates and Forecasts, By Application (2020-2032) (USD Billion)
9.4.10 Rest of Asia Pacific
9.4.10.1 Rest of Asia Pacific LAN Cable Market Estimates and Forecasts, by Type (2020-2032) (USD Billion)
9.4.10.2 Rest of Asia Pacific LAN Cable Market Estimates and Forecasts, By Application (2020-2032) (USD Billion)
9.5 Middle East and Africa
9.5.1 Middle East
9.5.1.1 Trends Analysis
9.5.1.2 Middle East LAN Cable Market Estimates and Forecasts, by Country (2020-2032) (USD Billion)
9.5.1.3 Middle East LAN Cable Market Estimates and Forecasts, by Type (2020-2032) (USD Billion)
9.5.1.4 Middle East LAN Cable Market Estimates and Forecasts, By Application (2020-2032) (USD Billion)
9.5.1.5 UAE
9.5.1.5.1 UAE LAN Cable Market Estimates and Forecasts, by Type (2020-2032) (USD Billion)
9.5.1.5.2 UAE LAN Cable Market Estimates and Forecasts, By Application (2020-2032) (USD Billion)
9.5.1.6 Egypt
9.5.1.6.1 Egypt LAN Cable Market Estimates and Forecasts, by Type (2020-2032) (USD Billion)
9.5.1.6.2 Egypt LAN Cable Market Estimates and Forecasts, By Application (2020-2032) (USD Billion)
9.5.1.7 Saudi Arabia
9.5.1.7.1 Saudi Arabia LAN Cable Market Estimates and Forecasts, by Type (2020-2032) (USD Billion)
9.5.1.7.2 Saudi Arabia LAN Cable Market Estimates and Forecasts, By Application (2020-2032) (USD Billion)
9.5.1.8 Qatar
9.5.1.8.1 Qatar LAN Cable Market Estimates and Forecasts, by Type (2020-2032) (USD Billion)
9.5.1.8.2 Qatar LAN Cable Market Estimates and Forecasts, By Application (2020-2032) (USD Billion)
9.5.1.9 Rest of Middle East
9.5.1.9.1 Rest of Middle East LAN Cable Market Estimates and Forecasts, by Type (2020-2032) (USD Billion)
9.5.1.9.2 Rest of Middle East LAN Cable Market Estimates and Forecasts, By Application (2020-2032) (USD Billion)
9.5.2 Africa
9.5.2.1 Trends Analysis
9.5.2.2 Africa LAN Cable Market Estimates and Forecasts, by Country (2020-2032) (USD Billion)
9.5.2.3 Africa LAN Cable Market Estimates and Forecasts, by Type (2020-2032) (USD Billion)
9.5.2.4 Africa LAN Cable Market Estimates and Forecasts, By Application (2020-2032) (USD Billion)
9.5.2.5 South Africa
9.5.2.5.1 South Africa LAN Cable Market Estimates and Forecasts, by Type (2020-2032) (USD Billion)
9.5.2.5.2 South Africa LAN Cable Market Estimates and Forecasts, By Application (2020-2032) (USD Billion)
9.5.2.6 Nigeria
9.5.2.6.1 Nigeria LAN Cable Market Estimates and Forecasts, by Type (2020-2032) (USD Billion)
9.5.2.6.2 Nigeria LAN Cable Market Estimates and Forecasts, By Application (2020-2032) (USD Billion)
9.5.2.7 Rest of Africa
9.5.2.7.1 Rest of Africa LAN Cable Market Estimates and Forecasts, by Type (2020-2032) (USD Billion)
9.5.2.7.2 Rest of Africa LAN Cable Market Estimates and Forecasts, By Application (2020-2032) (USD Billion)
9.6 Latin America
9.6.1 Trends Analysis
9.6.2 Latin America LAN Cable Market Estimates and Forecasts, by Country (2020-2032) (USD Billion)
9.6.3 Latin America LAN Cable Market Estimates and Forecasts, by Type (2020-2032) (USD Billion)
9.6.4 Latin America LAN Cable Market Estimates and Forecasts, By Application (2020-2032) (USD Billion)
9.6.5 Brazil
9.6.5.1 Brazil LAN Cable Market Estimates and Forecasts, by Type (2020-2032) (USD Billion)
9.6.5.2 Brazil LAN Cable Market Estimates and Forecasts, By Application (2020-2032) (USD Billion)
9.6.6 Argentina
9.6.6.1 Argentina LAN Cable Market Estimates and Forecasts, by Type (2020-2032) (USD Billion)
9.6.6.2 Argentina LAN Cable Market Estimates and Forecasts, By Application (2020-2032) (USD Billion)
9.6.7 Colombia
9.6.7.1 Colombia LAN Cable Market Estimates and Forecasts, by Type (2020-2032) (USD Billion)
9.6.7.2 Colombia LAN Cable Market Estimates and Forecasts, By Application (2020-2032) (USD Billion)
9.6.8 Rest of Latin America
9.6.8.1 Rest of Latin America LAN Cable Market Estimates and Forecasts, by Type (2020-2032) (USD Billion)
9.6.8.2 Rest of Latin America LAN Cable Market Estimates and Forecasts, By Application (2020-2032) (USD Billion)
10. Company Profiles
10.1 Belden Inc.
10.1.1 Company Overview
10.1.2 Financial
10.1.3 Products/ Services Offered
110.1.4 SWOT Analysis
10.2 Nexans
10.2.1 Company Overview
10.2.2 Financial
10.2.3 Products/ Services Offered
10.2.4 SWOT Analysis
10.3 Prysmian Group
10.3.1 Company Overview
10.3.2 Financial
10.3.3 Products/ Services Offered
10.3.4 SWOT Analysis
10.4 Leviton Manufacturing Co.
10.4.1 Company Overview
10.4.2 Financial
10.4.3 Products/ Services Offered
10.4.4 SWOT Analysis
10.5 CommScope
10.5.1 Company Overview
10.5.2 Financial
10.5.3 Products/ Services Offered
10.5.4 SWOT Analysis
10.6 Schneider Electric
10.6.1 Company Overview
10.6.2 Financial
10.6.3 Products/ Services Offered
10.6.4 SWOT Analysis
10.7 Panduit
10.7.1 Company Overview
10.7.2 Financial
10.7.3 Products/ Services Offered
10.7.4 SWOT Analysis
10.8 Siemon
10.8.1 Company Overview
10.8.2 Financial
10.8.3 Products/ Services Offered
10.8.4 SWOT Analysis
10.9 Superior Essex
10.9.1 Company Overview
10.9.2 Financial
10.9.3 Products/ Services Offered
10.9.4 SWOT Analysis
10.10 TE Connectivity
10.10.1 Company Overview
10.10.2 Financial
10.10.3 Products/ Services Offered
10.10.4 SWOT Analysis
11. Use Cases and Best Practices
12. Conclusion
An accurate research report requires proper strategizing as well as implementation. There are multiple factors involved in the completion of good and accurate research report and selecting the best methodology to compete the research is the toughest part. Since the research reports we provide play a crucial role in any company’s decision-making process, therefore we at SNS Insider always believe that we should choose the best method which gives us results closer to reality. This allows us to reach at a stage wherein we can provide our clients best and accurate investment to output ratio.
Each report that we prepare takes a timeframe of 350-400 business hours for production. Starting from the selection of titles through a couple of in-depth brain storming session to the final QC process before uploading our titles on our website we dedicate around 350 working hours. The titles are selected based on their current market cap and the foreseen CAGR and growth.
The 5 steps process:
Step 1: Secondary Research:
Secondary Research or Desk Research is as the name suggests is a research process wherein, we collect data through the readily available information. In this process we use various paid and unpaid databases which our team has access to and gather data through the same. This includes examining of listed companies’ annual reports, Journals, SEC filling etc. Apart from this our team has access to various associations across the globe across different industries. Lastly, we have exchange relationships with various university as well as individual libraries.
Step 2: Primary Research
When we talk about primary research, it is a type of study in which the researchers collect relevant data samples directly, rather than relying on previously collected data. This type of research is focused on gaining content specific facts that can be sued to solve specific problems. Since the collected data is fresh and first hand therefore it makes the study more accurate and genuine.
We at SNS Insider have divided Primary Research into 2 parts.
Part 1 wherein we interview the KOLs of major players as well as the upcoming ones across various geographic regions. This allows us to have their view over the market scenario and acts as an important tool to come closer to the accurate market numbers. As many as 45 paid and unpaid primary interviews are taken from both the demand and supply side of the industry to make sure we land at an accurate judgement and analysis of the market.
This step involves the triangulation of data wherein our team analyses the interview transcripts, online survey responses and observation of on filed participants. The below mentioned chart should give a better understanding of the part 1 of the primary interview.
Part 2: In this part of primary research the data collected via secondary research and the part 1 of the primary research is validated with the interviews from individual consultants and subject matter experts.
Consultants are those set of people who have at least 12 years of experience and expertise within the industry whereas Subject Matter Experts are those with at least 15 years of experience behind their back within the same space. The data with the help of two main processes i.e., FGDs (Focused Group Discussions) and IDs (Individual Discussions). This gives us a 3rd party nonbiased primary view of the market scenario making it a more dependable one while collation of the data pointers.
Step 3: Data Bank Validation
Once all the information is collected via primary and secondary sources, we run that information for data validation. At our intelligence centre our research heads track a lot of information related to the market which includes the quarterly reports, the daily stock prices, and other relevant information. Our data bank server gets updated every fortnight and that is how the information which we collected using our primary and secondary information is revalidated in real time.
Step 4: QA/QC Process
After all the data collection and validation our team does a final level of quality check and quality assurance to get rid of any unwanted or undesired mistakes. This might include but not limited to getting rid of the any typos, duplication of numbers or missing of any important information. The people involved in this process include technical content writers, research heads and graphics people. Once this process is completed the title gets uploader on our platform for our clients to read it.
Step 5: Final QC/QA Process:
This is the last process and comes when the client has ordered the study. In this process a final QA/QC is done before the study is emailed to the client. Since we believe in giving our clients a good experience of our research studies, therefore, to make sure that we do not lack at our end in any way humanly possible we do a final round of quality check and then dispatch the study to the client.
By Cable Type
Cat 7 Cable
Cat 6 Cable
Cat 6 A Cable
Cat 5 Cable
Cat 5 E Cable
By Application
Commercial Use
Office Use
Industrial Use
Request for Segment Customization as per your Business Requirement: Segment Customization Request
Regional Coverage:
North America
US
Canada
Mexico
Europe
Eastern Europe
Poland
Romania
Hungary
Turkey
Rest of Eastern Europe
Western Europe
Germany
France
UK
Italy
Spain
Netherlands
Switzerland
Austria
Rest of Western Europe
Asia Pacific
China
India
Japan
South Korea
Vietnam
Singapore
Australia
Rest of Asia Pacific
Middle East & Africa
Middle East
UAE
Egypt
Saudi Arabia
Qatar
Rest of the Middle East
Africa
Nigeria
South Africa
Rest of Africa
Latin America
Brazil
Argentina
Colombia
Rest of Latin America
Request for Country Level Research Report: Country Level Customization Request
Available Customization
With the given market data, SNS Insider offers customization as per the company’s specific needs. The following customization options are available for the report:
Product Analysis
Criss-Cross segment analysis (e.g. Product X Application)
Product Matrix which gives a detailed comparison of product portfolio of each company
Geographic Analysis
Additional countries in any of the regions
Company Information
Detailed analysis and profiling of additional market players (Up to five)
The Biometric System Market Size was valued at USD 39.07 Billion in 2023 and is expected to grow at a CAGR of 15.33% to reach USD 140.58 Billion by 2032
The Digital KVMs Market size was valued at USD 10.30 Billion in 2023 and is expected to reach USD 31.56 Billion by 2032 and grow at a CAGR of 13.29% over the forecast period 2024-2032.
The DRAM Module and Component Market Size was valued at $96.91 Billion in 2023 and is expected to grow at a CAGR of 1.75% to reach $113.26 Billion by 2032
The Interactive Kiosk Market Size was valued at $32.18 Billion in 2023 and is expected to reach $64.51 Billion by 2032, at a CAGR of 8.05% During 2024-2032
The Semiconductor Chemicals Market Size was valued at USD 12.8 Billion in 2023 and is expected to reach USD 35.63 Billion by 2032, growing at a CAGR of 12.05% during 2024-2032.
The Industrial Gas Sensors Market size was valued at USD 1123.5 million in 2023 and is expected to grow to USD 1997.1 million by 2032 and grow at a CAGR of 6.6 % over the forecast period of 2024-2032.
Hi! Click one of our member below to chat on Phone