Proactive Services Market Report Scope & Overview:
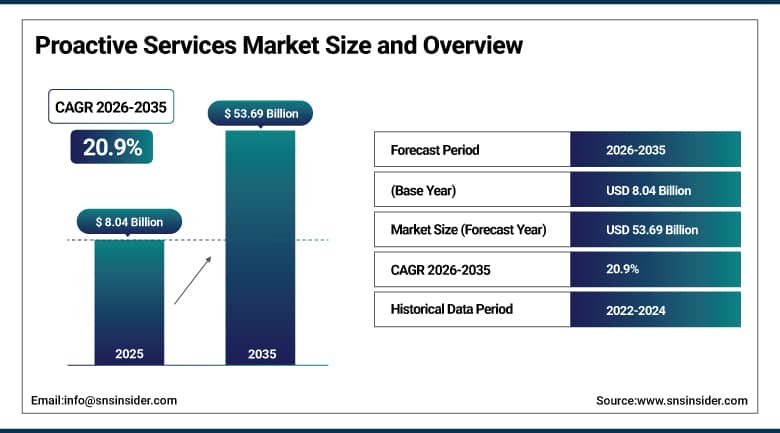
The Proactive Services Market was valued at USD 8.04 Billion in 2025 and is expected to reach USD 53.69 Billion by 2035, growing at a CAGR of 20.9% from 2026–2035.
Proactive services market around the world is undergoing a paradigm change where enterprises have begun focusing on a different model of operational and IT service delivery. Leading BFSI, healthcare, manufacturing, and technology companies are making a move from break-fix reactive services models to proactive and constantly monitored services that not only ensure problem-free services but help in solving problems before they affect their operation. The reason why this kind of transformation is becoming possible is due to the development of AI and machine learning services that are enabling real-time and continuous monitoring through IoT, making it possible to detect issues and solve them automatically without any manual intervention. Proactive services that have become important due to increasing dependency between digital assets and rising cost of business disruption will transform themselves from competitive advantage to operational necessity in order to maintain service availability, regulatory compliance, and customer satisfaction.
DXC Technology made a collaboration in May 2024 with Dell Technologies to enhance its services based on Enterprise Intelligence that leverages AI, ML, big data analytics, and intelligent automation to enable end-to-end insights into enterprise operations.
Market Size and Forecast
- Market Size in 2026E: USD 9.72 Billion
- Market Size by 2035: USD 53.69 Billion
- CAGR: 20.9% from 2026 to 2035
- Fastest Growing Region: Asia Pacific
- Largest Region: North America
To Get More Information On Proactive Services Market - Request Free Sample Report
Proactive Services Market Trends
- Growing adoption of AI and machine learning is improving predictive maintenance and automated issue resolution capabilities.
- Rising deployment of IoT sensors is enabling real-time monitoring and proactive operational intelligence across industries.
- Increasing cloud and hybrid IT adoption is driving demand for centralized proactive monitoring platforms.
- Enterprises are investing in proactive customer engagement solutions to improve customer experience and reduce churn.
- Expanding regulatory compliance requirements are accelerating adoption of automated compliance monitoring and reporting services.
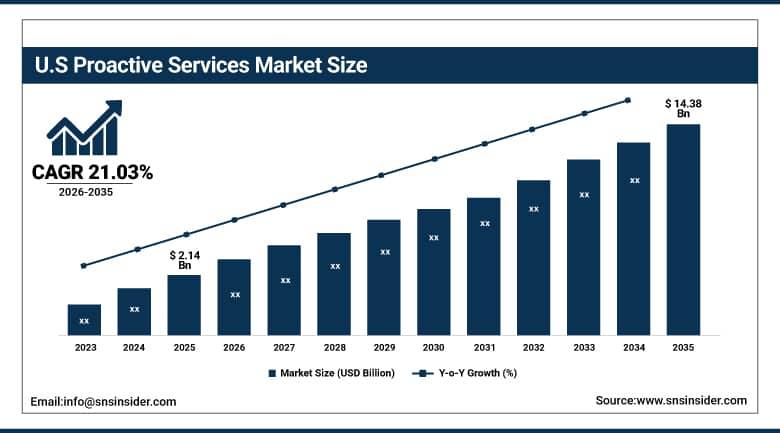
The U.S. Proactive Services Market Outlook
The U.S. Proactive Services Market was valued at approximately USD 2.14 Billion in 2025 and is expected to reach approximately USD 14.38 Billion by 2035, growing at a CAGR of approximately 21.03%.
Demand in the U.S. market is driven by the need for advanced proactive services that involve the use of AI-based monitoring, predictions, automations, and service management systems that can support complex IT infrastructures. In addition, there has been a greater interest in choosing proactive service providers that have the capacity to offer real-time analytics, efficient automation, integration of cybersecurity measures, and good performance. This is evident through the growth of the Cisco platform that involves the use of AI-based CX Cloud to identify weaknesses and risks before service disruptions.
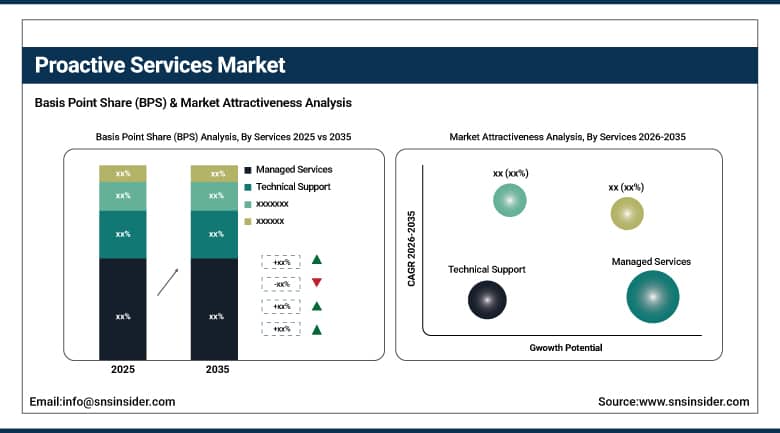
Proactive Services Market Segment Analysis
- By Services, managed services dominated with approximately 37.50% share in 2025. Technical Support is the fastest-growing segment at a CAGR of 25.02% through the forecast period.
- By Deployment, cloud dominated the proactive services market with an estimated share of around 64% in 2025. On-premises is projected to grow at a CAGR of approximately 18.40% through the forecast period.
- By Application, IT Infrastructure Management accounted for the largest market share of approximately 34% in 2025. Security & Compliance Management is expected to register the fastest CAGR of around 26.30%.
- By Industry Vertical, IT & Telecom dominated the market with an estimated share of about 29% in 2025. Manufacturing is projected to be the fastest-growing vertical with a CAGR of nearly 27.10%.
By Services, managed services dominate, technical support grows fastest
Managed services retained the dominant position with approximately 37.50% of the proactive services market in 2025. The segment’s leadership reflects the structural logic of outsourcing non-core IT functions to specialist providers who can deliver proactive monitoring, management, and optimisation at lower total cost than equivalent in-house capability. Enterprises outsourcing their network management, security operations, and cloud infrastructure monitoring to managed service providers gain access to 24/7 proactive surveillance capabilities, specialist expertise, and automation-driven efficiency that internal IT teams constrained by headcount, skills gaps, and capital budget limitations cannot match. The managed services model’s recurring contract structure provides revenue predictability that enables providers to invest continuously in the AI analytics platforms, monitoring tools, and security intelligence that sustain their service quality advantage over reactive alternatives.
Technical support is the fastest-growing segment at a CAGR of 25.02% through 2035. The growth is driven by the extraordinary pace at which the regulatory and cybersecurity threat landscape is evolving, creating continuous demand for proactive technical compliance support that identifies vulnerabilities, patches exposures, and validates regulatory adherence before organisations face enforcement action or security incidents. Organisations that previously managed technical support reactively, responding to issues as they arose, are adopting proactive technical support programmes that continuously monitor system health, software currency, and configuration compliance. This shift is commercially significant because proactive technical support contracts typically carry higher per-seat and per-device value than reactive break-fix equivalents, driving revenue per customer growth alongside the volume expansion that new market adoption creates.
By Application, IT infrastructure management dominates, security & compliance grows fastest
IT infrastructure management retained the dominant application position in the proactive services market in 2025. Every enterprise computing environment, from the smallest cloud deployment to the largest hybrid data centre complex, requires continuous monitoring of server performance, network connectivity, application response times, storage utilisation, and capacity trends to maintain the service availability that business operations depend on. IT infrastructure management is therefore the universal baseline proactive service requirement whose addressable market spans every industry, enterprise size, and geographic market. The application’s commercial scale reflects both the universality of its requirement and the growing complexity of hybrid and multi-cloud environments that have expanded the monitoring surface area beyond what legacy reactive monitoring tools were designed to cover.
Security and compliance management is the fastest-growing application segment, driven by the relentless escalation of cyber threat frequency, sophistication, and business impact combined with the progressive tightening of regulatory compliance obligations across virtually every major industry and jurisdiction. Proactive security monitoring services that continuously analyse network traffic, user behaviour, endpoint telemetry, and threat intelligence feeds to identify attack patterns before they complete provide demonstrably superior protection to reactive security operations that respond only after breaches are detected. The expanding regulatory compliance requirement, encompassing GDPR, NIS2, HIPAA, SOX, and industry-specific frameworks, is simultaneously creating demand for proactive compliance monitoring services that continuously verify adherence and generate audit evidence without the labour-intensive manual review processes that compliance teams previously relied upon.
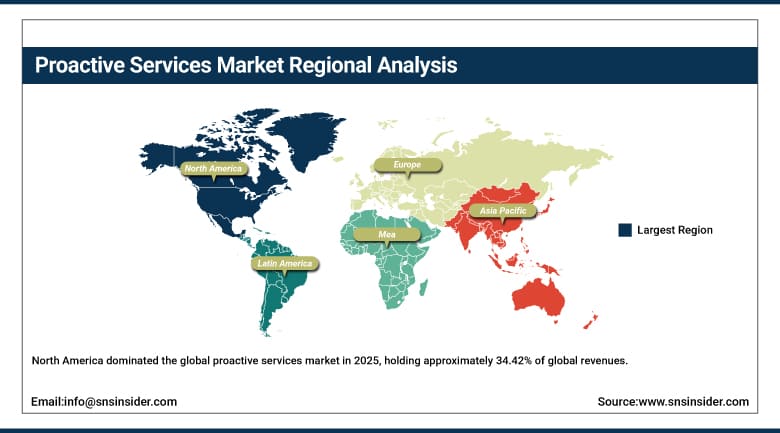
Regional Analysis
|
Region |
Major Country |
Share within Region, 2025 (%) |
|---|---|---|
|
North America |
United States |
87.4% |
|
Europe |
Germany |
24.3% |
|
Asia Pacific |
China |
45.2% |
|
Middle East & Africa |
Saudi Arabia |
38.4% |
|
Latin America |
Brazil |
44.2% |
North America Proactive Services Market Insights
North America dominated the global proactive services market in 2025, holding approximately 34.42% of global revenues, with the United States accounting for approximately 87.4% of North American revenues. The region’s leadership is anchored by its advanced IT infrastructure, high enterprise cloud adoption rate, and the concentration of the world’s leading proactive service technology providers and managed service organisations whose product and service development investment defines global market standards. The U.S. market’s maturity across AI analytics, cybersecurity monitoring, and cloud-native proactive service platforms provides North American enterprises with earlier access to the most sophisticated proactive service capabilities that are progressively adopted in other regions as technology and commercial models mature.
Canada contributes approximately 12.6% of North American revenues through a sophisticated enterprise technology adoption market, a growing managed services sector serving the country’s financial services, energy, and public sector organisations, and a regulatory environment across provincial healthcare systems and federally regulated industries that creates structured demand for proactive compliance monitoring and IT infrastructure management services aligned with Canadian data sovereignty and privacy requirements.
Get Customized Report as Per Your Business Requirement - Enquiry Now
Europe Proactive Services Market Insights
Europe is a growing proactive services market where the combination of GDPR’s data protection requirements, the NIS2 Directive’s cybersecurity obligations, and the progressive Industry 4.0 modernisation of the continent’s manufacturing base are creating multidimensional demand for proactive monitoring, security compliance, and predictive maintenance services. Germany accounts for approximately 24.3% of European revenues as the region’s largest national market, driven by its world-class manufacturing sector’s adoption of Industry 4.0 proactive equipment monitoring, its strong enterprise IT services ecosystem, and the regulatory compliance monitoring requirements of its financial services and healthcare industries whose stringent data protection and operational resilience standards create sustained proactive service procurement demand.
The United Kingdom and France are significant secondary European markets where financial services sector proactive monitoring, cloud migration support services, and growing managed security service provider adoption are driving market development. The EU’s Digital Operational Resilience Act’s requirements for financial sector IT resilience testing and continuous performance monitoring are creating new compliance-driven proactive service demand across European banking, insurance, and capital markets firms whose regulatory obligations are expanding the addressable market for specialist proactive services providers with financial sector regulatory expertise.
Asia Pacific Proactive Services Market Insights
Asia Pacific is the fastest-growing regional proactive services market at a CAGR of approximately 25.50%, driven by accelerating enterprise digitalisation, rapid expansion of the SME sector’s technology adoption, and substantial government and private sector investment in IT infrastructure across China, India, Japan, South Korea, and Southeast Asian economies. China accounts for approximately 45.2% of Asia Pacific revenues through its extraordinary enterprise digital transformation investment, the deployment of domestic proactive service platforms by technology providers including Huawei and Alibaba Cloud, and the growing sophistication of Chinese enterprises’ IT service requirements as their digital infrastructure complexity increases proportionally with the pace of their technology-dependent business growth.
India is the most commercially significant emerging market within Asia Pacific for proactive services, as the country’s rapidly growing technology services sector generates both internal demand for proactive IT management and export demand through Indian managed service providers who deliver proactive monitoring and management services to global enterprise clients from cost-competitive Indian delivery centres. Huawei’s September 2024 announcement of 17 new products and 7 solutions at HUAWEI CONNECT enhancing digital intelligence for SMEs in education, healthcare, and manufacturing specifically illustrates the commercial investment that major technology providers are directing toward the Asia Pacific SME proactive services market whose scale and growth rate make it one of the decade’s most commercially significant enterprise technology opportunity areas.
MEA & Latin America Proactive Services Market Insights
The Middle East and Africa and Latin America are growing proactive services markets where digital transformation investment, expanding cloud adoption, and the entry of global managed service providers are creating structured demand for predictive monitoring and proactive IT management services. Saudi Arabia leads MEA revenues at approximately 38.4% of the regional total, driven by Vision 2030’s extraordinary digital infrastructure investment programme whose deployment of smart city technology, cloud-first government services, and industrial automation across NEOM and other mega-projects creates proactive monitoring requirements at a scale and technological sophistication level that necessitates advanced service provider partnerships with global proactive service platform capability.
Brazil leads Latin American proactive services revenues at approximately 44.2% of the regional total through its large financial services sector’s proactive compliance monitoring requirements, its growing manufacturing industry’s predictive maintenance adoption, and the rapid expansion of cloud-based managed services across Brazilian enterprises whose digital transformation investment is creating IT environments of sufficient complexity to justify proactive monitoring investment. The broader Latin American market is growing as regional managed service providers adopt international proactive service platform technologies and as multinational enterprises extend their global proactive service contracts to cover their Latin American operations, progressively raising the regional baseline of proactive service adoption.
Market Dynamics
Growth Drivers: Growing adoption of AI-driven monitoring, predictive analytics, and cloud infrastructure driving proactive services market growth
The increasing enterprise reliance on cloud computing, hybrid IT environments, AI-powered analytics, and connected digital infrastructure is significantly driving demand for proactive services globally. Proactive services play a critical role in predictive maintenance, automated issue resolution, cybersecurity monitoring, and performance optimization across industries including BFSI, healthcare, manufacturing, telecom, and retail. Rising investments in cloud infrastructure, IoT deployments, enterprise automation, and digital transformation initiatives across North America, Europe, and Asia Pacific during 2025 and 2026 are expected to further accelerate proactive service adoption worldwide.
Restraints: High implementation costs and integration complexity limiting market expansion
The deployment of proactive service platforms often requires substantial investment in AI technologies, cloud integration, monitoring infrastructure, and cybersecurity systems. Integration challenges associated with legacy enterprise environments, multi-cloud architectures, and fragmented IT ecosystems can increase operational complexity and implementation timelines. In addition, concerns related to data privacy, interoperability, and shortage of skilled IT professionals continue to create adoption barriers for several organizations, particularly SMEs and cost-sensitive enterprises.
Opportunities: AI automation, IoT expansion, and predictive maintenance creating future growth opportunities
Rapid advancements in artificial intelligence, machine learning, IoT connectivity, and cloud-native automation platforms are creating strong growth opportunities for proactive service providers globally. Increasing enterprise demand for predictive maintenance, automated compliance management, cybersecurity intelligence, and real-time operational monitoring is expected to support future market expansion. Furthermore, the growing adoption of Industry 4.0 technologies, smart manufacturing systems, edge computing, and AI-powered customer support platforms is generating new opportunities for proactive services across industrial and enterprise environments.
Recent Developments:
- 2025: Cisco expanded its CX Cloud proactive services platform with enhanced AI-driven lifecycle management capabilities that identify software vulnerabilities, configuration risks, and capacity constraints across customer network and security infrastructure before they create service incidents, reinforcing Cisco’s position as the leading proactive services platform for enterprise network infrastructure monitoring globally.
- 2025: Microsoft extended its Azure Monitor and Defender proactive monitoring suite with new AI-powered anomaly detection and automated remediation workflows that enable enterprise customers to configure self-healing cloud infrastructure responses to common performance and security events without requiring manual operations team intervention at each incident.
- 2025: IBM expanded its Watson AIOps proactive IT operations platform with enhanced predictive analytics for hybrid cloud environments, enabling enterprise customers to correlate alerts across on-premises, private cloud, and public cloud infrastructure within a unified observability platform that reduces mean time to detect and mean time to resolve operational incidents significantly.
Proactive Services Market Key Players are:
- Amazon Web Services Inc. (AWS)
- Cisco Systems Inc.
- Microsoft Corporation
- IBM Corporation
- Huawei Technologies Co. Ltd.
- Fortinet Inc.
- Juniper Networks Inc.
- DXC Technology Company
- Dell Technologies Inc.
- Hewlett Packard Enterprise Co. (HPE)
- Accenture plc
- Infosys Ltd.
- Tata Consultancy Services Ltd.
- Wipro Ltd.
- Capgemini SE
- NTT Data Corporation
- ServiceNow Inc.
- Dynatrace Inc.
- Datadog Inc.
- PagerDuty Inc.
Proactive Services Market Report Scope:
| Report Attributes | Details |
|---|---|
| Market Size in 2025 | USD 8.04 Billion |
| Market Size by 2035 | USD 53.69 Billion |
| CAGR | CAGR of 20.9% From 2026 to 2035 |
| Base Year | 2025 |
| Forecast Period | 2026-2035 |
| Historical Data | 2022-2024 |
| Report Scope & Coverage | Market Size, Segments Analysis, Competitive Landscape, Regional Analysis, DROC & SWOT Analysis, Forecast Outlook |
| Key Segments | •By Services (Managed Services, Technical Support, Training & Education, Consulting Services) •By Deployment (Cloud, On-Premises) •By Application (IT Infrastructure Management, Equipment Monitoring, Business Process Optimization, Customer Service Support) •By Industry Vertical (BFSI, Healthcare, Manufacturing, IT & Telecom, Retail, Others) |
| Regional Analysis/Coverage | North America (US, Canada), Europe (Germany, UK, France, Italy, Spain, Russia, Poland, Rest of Europe), Asia Pacific (China, India, Japan, South Korea, Australia, ASEAN Countries, Rest of Asia Pacific), Middle East & Africa (UAE, Saudi Arabia, Qatar, South Africa, Rest of Middle East & Africa), Latin America (Brazil, Argentina, Mexico, Colombia, Rest of Latin America). |
| Company Profiles | Amazon Web Services Inc. (AWS), Cisco Systems Inc., Microsoft Corporation, IBM Corporation, Huawei Technologies Co. Ltd., Fortinet Inc., Juniper Networks Inc., DXC Technology Company, Dell Technologies Inc., Hewlett Packard Enterprise Co. (HPE), Accenture plc, Infosys Ltd., Tata Consultancy Services Ltd., Wipro Ltd., Capgemini SE, NTT Data Corporation, ServiceNow Inc., Dynatrace Inc., Datadog Inc., and PagerDuty Inc. |
Frequently Asked Questions
Get in Touch
