Tableau Services Market Report Scope & Overview:
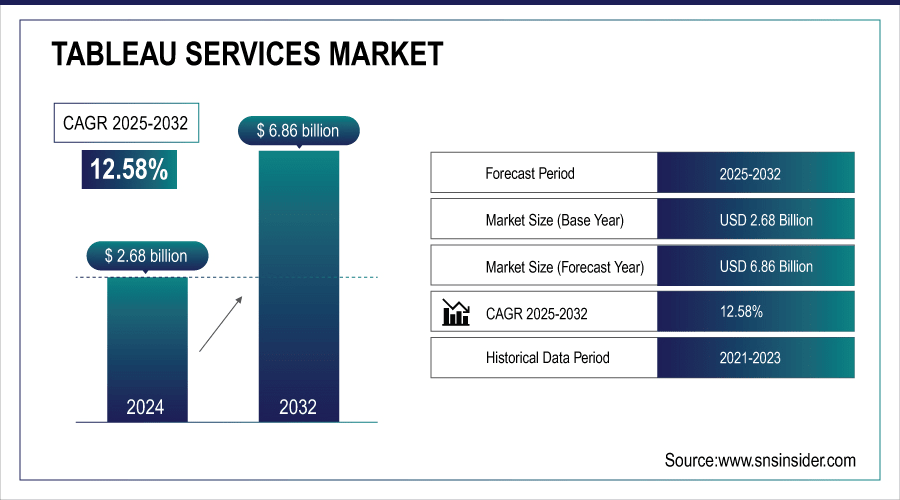
Tableau Services Market was valued at USD 2.68 billion in 2025E and is expected to reach USD 6.86 billion by 2033, growing at a CAGR of 12.58% from 2026-2033.
The Tableau Services Market growth is driven by increasing adoption of data-driven decision-making across industries and increasing demand for real-time analytics along with adoption of AI and machine learning for advanced insights. Tableau has been empowering organizations by adopting the latest and interactive visualizations, automating data preparation, and dashboard development to boost operational efficiency. On the other hand, the worldwide boosting of cloud deployment, digital transformation projects, and increasing demand for actionable business intelligence drive market growth even faster.
Tableau Services Market Size and Forecast:
-
Market Size in 2025E: USD 2.68 Billion
-
Market Size by 2033: USD 6.86 Billion
-
CAGR: 12.58% from 2026 to 2033
-
Base Year: 2025
-
Forecast Period: 2026–2033
-
Historical Data: 2022–2024
To Get More Information On Tableau Services Market - Request Free Sample Report
Tableau Services Market Trends
-
Rising demand for data visualization and analytics to support data-driven decision-making.
-
Cloud-based deployment of Tableau solutions is enhancing scalability and accessibility.
-
Integration with AI and machine learning is enabling predictive insights and advanced analytics.
-
Increasing adoption across industries like BFSI, healthcare, retail, and IT for real-time reporting.
-
Growing focus on self-service analytics is empowering business users to generate insights independently.
-
Expansion of enterprise dashboards and KPI tracking is improving operational efficiency.
-
Training, consulting, and managed services are driving the growth of Tableau service offerings globally.
U.S. Tableau Services Market was valued at USD 0.82 billion in 2025 and is expected to reach USD 1.85 billion by 2033, growing at a CAGR of 12.34% from 2026-2033.
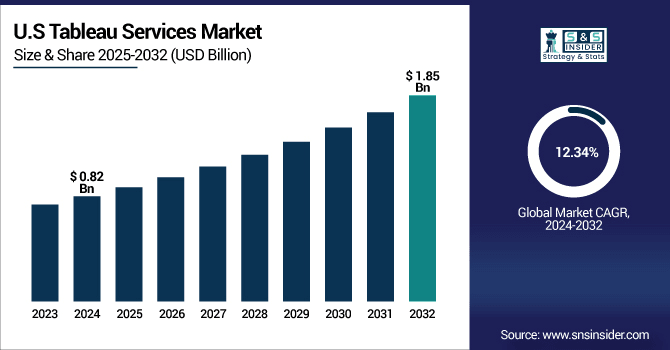
The growth of the U.S. Tableau Services Market is driven by the deployment of data analytics for aided decision-making, demand for dashboards for interactive visualization, and integration with AI-enabled insights. The continuous market expansion is further fueled by the adoption of cloud, digital, and real-time business intelligence.
Tableau Services Market Growth Drivers:
-
Rising enterprise demand for advanced data visualization solutions to transform raw business data into actionable intelligence for competitive growth
Rising enterprise demand for advanced data visualization tools to convert raw business data in the actionable intelligence to gain a competitive advantage is driving the Tableau Services Market. The need to use data for well-informed business decisions for increased operational efficiency and competitive advantage is driving this initiative of organizations across different sectors. By connecting to disparate data sources and delivering clean visualizations, Tableau empowers you to make quick decisions and be more agile in your business. As data ecosystems grow more complicated and demand for real-time analytics continues to rise, businesses are making a significant investment in Tableau consulting services in order to better plan resources, increase forecasting accuracy, and create evidence-based strategies that drive profitability and long-term market success.
-
Organizations using Tableau have reported a 33% improvement in insights-driven decision-making, as per the 2024 Salesforce Success Metrics Tableau Highlights, based on data from 706 customers across nine countries
Tableau Services Market Restraints:
-
Shortage of skilled Tableau professionals and integration challenges with legacy systems creating obstacles in achieving full value from services
Lack of trained and skilled Tableau resources and the complexity in integrating the previous systems with Tableau to derive more from the Tableau services make the population of Tableau adoption less. A common issue organizations face is the scarcity of skilled professionals who can create, maintain, and optimize Tableau dashboards effectively. At the same time, deploying Tableau in legacy or incompatible IT environments is technically complex and can delay implementation. These types of obstacles increase dependence on outside advisors, once again increasing costs and complicates factors. The complexity of system integration and lack of training might decrease usage of Tableau, in which low return combined with decelerating market growth will result though an increasing willingness of organizations to use data for decision making, causes for not being enough.
Tableau Services Market Opportunities:
-
Growing demand for AI-driven analytics and predictive modeling creating new opportunities for Tableau services in advanced decision-making applications
Rising adoption of AI-based analytics and predictive modeling innovations opening new opportunities for Tableau services in advanced decision-making solutions is transforming the market. Businesses are looking more and more for such tools that can combine machine learning with visualization in order to gain insights at a deeper level. Tableau’s flexibility allows it to be leveraged as a potent venue to embed predictions, what-ifs, and automation in business flows. With businesses focus moving towards smart analytics, demand for service providers having AI based enhanced Tableau capabilities will increase. This provides extensive growth opportunities for consultants, developers and providers of managed services that assist organisations in implementing predictive insights for innovation and competitive differentiation.
-
According to Tableau, organizations using AI-powered Tableau analytics report a 27% faster insights generation and a 22% improvement in forecast accuracy, enhancing overall decision-making efficiency across enterprise operations
Tableau Services Market Segment Highlights:
-
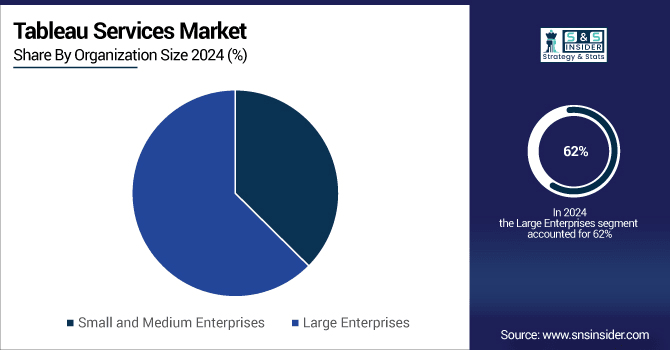
By Organization Size, Large Enterprises dominated with 62% share in 2025; Small and Medium Enterprises fastest growing (CAGR 13.96%).
-
By Vertical, BFSI dominated with 24% share in 2025; Healthcare fastest growing (CAGR 14.31%).
-
By Service Type, Consulting dominated with 32% share in 2025; Data Preparation fastest growing (CAGR 15.01%).
-
By Deployment, Cloud dominated with 43% share in 2025; Cloud fastest growing (CAGR 13.20%).
Tableau Services Market Segment Analysis
By Organization Size, Large Enterprises led while Small and Medium Enterprises are expected to grow fastest
Large enterprises accounted for the largest share in 2025 due to the high investment capacity of large enterprises and their advanced infrastructure and increasing demand for customized analytics solutions. These have proven to be the most critical functioning wings for decision-logic, operational efficiency and establishing market competitive advantage by supporting large scale data integration, interactive dashboards and enterprise-level reporting for these organizations and are the major contributors to the domination of these in Tableau Services Market.
Small and medium enterprises are expected to grow fastest from 2026–2033, fueled by growing use of cloud-based Tableau services for cost-effective analytics. Transition toward digital transformation, demand for cost-effective visualization tools, and focus on consumer behavior insights propel the SMEs to adopt Tableau, thereby accelerating the adoption and expanding the market.
By End-User Industry, BFSI dominated while Healthcare is projected to grow fastest
The BFSI sector dominated in 2025 as Tableau is widely utilized in BFSI for risk management, compliance reporting, fraud detection, and financial planning. Bankers are focused on safe, real-time analytics to ensure decisions and compliance are in line. The sector thrives on big-data and predictive analytics, Tableau services are essential to its long-term demand and revenue share.
Healthcare is projected to grow fastest from 2026–2033 due to its increasing use of Tableau in analyzing patient data, monitoring hospital performance, and supporting population health. Strong demand is being driven by the increase in digital health records, telemedicine adoption and predictive analytics for clinical decision making which makes healthcare a rapidly growing Tableau services market.
By Service Type, Consulting led while Data Preparation is expected to expand fastest
Consulting dominated in 2025 driven by the requirement from businesses for insights in the installation, integration, and optimization of Tableau solutions. To attain better ROI, data visualization adoption and decision-making capabilities, several service providers offer strategic consulting. Consulting secures the top position in this market due to demand for custom solutions in the focus areas together with expertise.
Data preparation is expected to grow fastest from 2026–2033 as more organizations place greater emphasis on preparing raw data by structuring it to a higher quality to obtain advanced visualization. Due to the complexity of data sources, prioritizing preparation services is leveraged for accuracy, quality and actionable insights. This need is enhanced by a growing demand for dedicated Tableau data prep services.
By Deployment Mode, Cloud dominated and is projected to grow fastest
Cloud contributed the highest revenue share in the Tableau Services Market in owing to its on-demand scalability and cost effectiveness along with its necessary flexibility that helps manage huge volume of data types across various industry verticals easily and strategically. And this segment is also forecasted to grow the fastest during 2026–2033, as enterprises adopt the cloud-first journey with hybrid deployments and real-time analytics. Rising digital transformation initiatives and growing need for secure, collaborative, and readily accessible data visualization solutions is propelling cloud to lead and gain fast traction globally.
Tableau Services Market Regional Analysis:
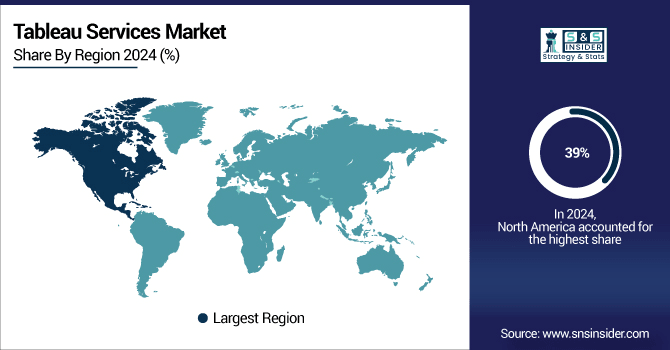
North America Tableau Services Market Insights
North America dominated the Tableau Services Market with a 39% share in 2025 owing to extensive adoption of Tableau technology, established well-developed digital infrastructure, and investments made by the enterprises on analytics. The presence of large service providers and demand for making data-driven decisions in the region, alongside the high adoption of Tableau, especially from verticals such as BFSI, healthcare, and retail strengthened its position; making it the largest revenue contributor and a mature market of advanced business intelligence software.
Get Customized Report as Per Your Business Requirement - Enquiry Now
Asia Pacific Tableau Services Market Insights
Asia Pacific is expected to grow fastest from 2026–2033 with a CAGR of 14.80% due to rapid digital transformation, expanding adoption of the cloud, and surge in investment on advanced analytics among emerging economies. Increasing SME inclination, growing visualization tools demand, and government-led digital initiatives are driving market expansion. The Asia Pacific Tableau Services market is being led by manufacturing, e-commerce, and healthcare industry verticals and is expected to be one of the key contributors to the growth of Tableau Services Market in the coming years.
Europe Tableau Services Market Insights
Europe in the Tableau Services Market is witnessing steady growth driven by increasing adoption of advanced analytics, stringent needs for regulatory compliance, and digital transformation projects. BFSI, healthcare, manufacturing etc and depends upon Tableau for real time insights and data visualization. Increasing preference for cloud based solutions and AI are also contributing to the Europe’s rising share.
Middle East & Africa and Latin America Tableau Services Market Insights
Middle East & Africa and Latin America in the Tableau Services Market are experiencing increasing adoption due to the platforms of digital transformation, cloud migration, and SMEs looking out for low-cost analytics. Both of these locations see significant adoption from BFSI, retail and healthcare industries using Tableau for data-driven decision making. Increasing internet usage and government support add momentum Market growth and take-up of services are also driven by the availability of internet connection and promotions by government.
Tableau Services Market Competitive Landscape:
Wipro has established a strategic alliance with Tableau to strengthen its data analytics and visualization features. The alliance targets financial services, retail, consumer packaged goods and pharmaceuticals as key vertical markets for 'next generation' BI solutions. By using Tableau's self-service analytics, Wipro can rapidly get to the future of insights faster through modernization of legacy systems, shorten clients' time to value, and allow clients to make decision in the fastest way. With programs such as Insights Modernization framework and SNIPE toolkit, Wipro helps enterprises on cloud-first journey and realize 3x improvement in BI adoption and return on investment.
-
Wipro Limited Migrated a global pharmaceutical client’s BI system from Cognos to Tableau using its SNIPE toolkit automating migration, boosting BI productivity by 35%, improving workflows, and increasing business productivity by 25%, while achieving 100% automation of legacy reports and saving approximately 30% time in reporting processes.
Tableau Services Market Key Players
-
Perceptive Analytics
-
Deloitte
-
Silicus Technologies, LLC
-
Bilytica
-
Interworks
-
Nabler
-
SA Technologies, Inc.
-
Salesforce
-
Capgemini
-
Infosys
-
Tata Consultancy Services (TCS)
-
Cognizant
-
Wipro
-
IBM
-
PwC
-
KPMG
-
EY (Ernst & Young)
-
DXC Technology
-
NTT Data
-
HCL Technologies
| Report Attributes | Details |
|---|---|
| Market Size in 2025E | USD 2.68 Billion |
| Market Size by 2033 | USD 6.86 Billion |
| CAGR | CAGR of 12.58% From 2026 to 2033 |
| Base Year | 2025 |
| Forecast Period | 2026-2033 |
| Historical Data | 2022-2024 |
| Report Scope & Coverage | Market Size, Segments Analysis, Competitive Landscape, Regional Analysis, DROC & SWOT Analysis, Forecast Outlook |
| Key Segments | • By Service Type (Consulting, Data Preparation, Dashboard Development, Training and Support, Others) • By Deployment Mode (On-Premises, Cloud) • By Organization Size (Small and Medium Enterprises, Large Enterprises) • By End-User Industry (BFSI, Healthcare, Retail, IT and Telecommunications, Manufacturing, Others) |
| Regional Analysis/Coverage | North America (US, Canada), Europe (Germany, UK, France, Italy, Spain, Russia, Poland, Rest of Europe), Asia Pacific (China, India, Japan, South Korea, Australia, ASEAN Countries, Rest of Asia Pacific), Middle East & Africa (UAE, Saudi Arabia, Qatar, South Africa, Rest of Middle East & Africa), Latin America (Brazil, Argentina, Mexico, Colombia, Rest of Latin America). |
| Company Profiles | Perceptive Analytics, Accenture, Deloitte, Silicus Technologies, LLC, Bilytica, Interworks, Nabler, Vizual Intelligence Inc., SA Technologies, Inc., Salesforce, Capgemini, Infosys, Tata Consultancy Services (TCS), Cognizant, Wipro, IBM, PwC, KPMG, EY (Ernst & Young), DXC Technology |
Frequently Asked Questions
North America led with 39% share in 2025, supported by advanced digital infrastructure, strong enterprise adoption, and widespread demand for real-time analytics.
Large enterprises dominated with ~62% share in 2025, owing to higher investments, advanced infrastructure, and reliance on Tableau for enterprise-scale analytics solutions.
The market growth is primarily driven by rising demand for data-driven decision-making, real-time analytics, and AI integration, boosting efficiency across global industries.
The Tableau Services Market was valued at USD 2.68 billion in 2025, highlighting strong enterprise adoption of visualization, analytics, and cloud-driven business intelligence services.
The Tableau Services Market is expected to grow at a CAGR of 12.58% from 2026 to 2033, reflecting rising adoption of analytics-driven decision-making globally.
Get in Touch
