Progressive Cavity Pump Market Report Scope & Overview:
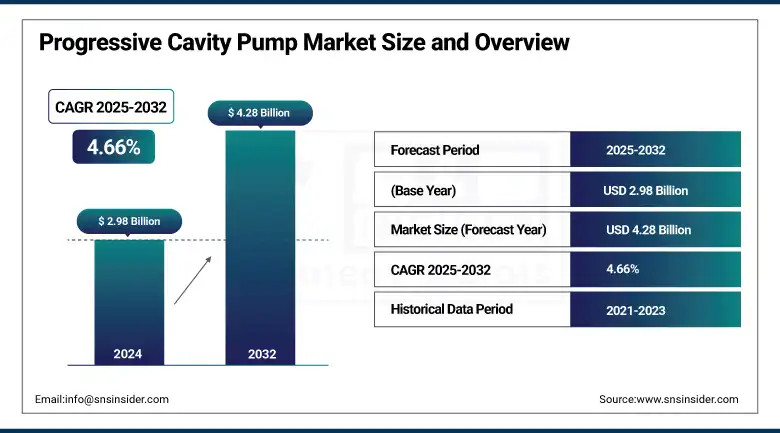
The Progressive Cavity Pump Market size was valued at USD 2.98 billion in 2024 and is expected to reach USD 4.28 billion by 2032, growing at a CAGR of 4.66% over the forecast period of 2025-2032.
Increasing demand from industries such as oil and gas, wastewater treatment, etc., drives the progressive cavity pump market growth. These are the kind of pumps chosen for their capability to handle viscous, abrasive, and shear-sensitive fluids, emulsifying precision and efficiency. Pumps in the industrial, progressive cavity category benefited from revolutionary developments, parameters such as spiral stator technology, improving hydraulic efficiency and reducing wear, thus making one of the most reliable mechanisms in demanding applications.
To Get more information On Progressive Cavity Pump Market - Request Free Sample Report
“NETZSCH produces over 75,000 pumps annually, offering customized solutions across diverse industries such as environment and energy, chemicals, pulp and paper, food and pharmaceuticals, and oil and gas. The company places strong emphasis on research and development.”
In addition, industrial progressive cavity pumps are capable of handling viscous, abrasive, and shear-sensitive fluids. Besides these pumps have been used with very little pulsation, thus finding more application in continuous processing operations. In contrast, the progressing cavity pump market is driven by the pump's efficiency, durability, and adaptability toward a wide range of applications.
In October 2024, NETZSCH launched a hermetically sealed enhancement for its NEMO progressing cavity pumps, aimed at improving safety by eliminating the risk of toxic liquid and gas leakage. This innovation also lowers operational costs by minimizing the need for frequent maintenance of sealing components.
Progressive Cavity Pump Market Dynamics
Drivers
-
Rising Demand for Progressive Cavity Pumps in Water and Wastewater Treatment Solutions
The growing demand for efficient water and wastewater treatment processes drives the progressive cavity pump market. Increasing urbanization and stricter environmental regulations force technologies to treat complex fluids such as sludge and slurry. PCPs are best suited for the treatment of viscous, abrasive, and high-solid content fluids with accuracy and reliability. Their non-pulsating flow allows for steady chemical dosing and efficient sludge transfer, wherein they have become almost indispensable for treatment plants. Regarding sustaining water resources, the global inclination towards sustainable water management increases the acceptance of PCPs as implementations that offer energy-efficient and cost-effective solutions in water infrastructure. The same trend is witnessed in regions where an enormous amount of funds is channeled into wastewater treatment as a means to tackle water scarcity and environmental issues.
In November 2024, Singapore introduced NEWBrew, a craft beer made from recycled wastewater, at the COP29 summit in Baku. Developed with PUB, this initiative highlighted water sustainability and aimed to normalize the use of recycled water in everyday life.
Restraint
-
High Initial Costs and Maintenance Challenges to Hinder Progressive Cavity Pump Market Growth
Progressive cavity pumps are valued for handling tough fluids, yet their adoption is often inhibited by the large upfront investments and expensive servicing. The complicated design of PCPs, composed of intricate components like the rotor and stator, results in high setup costs. Furthermore, the operating conditions demand an equally sophisticated maintenance regime for these pumps, as improper operation can damage them.
For example, a dry run could wear the PCP quickly and result in expensive repairs. Maintenance costs often surpass the upfront one during the seven years of operating time, especially when the pump is smaller-sized or higher in RPM.
This could prove to be a deterrent for smaller and middle-level enterprises with respect to the choice of PCPs despite its performance benefits. But the upgrades like Vogelsang HiCone system based on an adjustable rotor-stator configuration to prolong service life are addressing these issues.
Progressive Cavity Pump Market Segmentation outlook
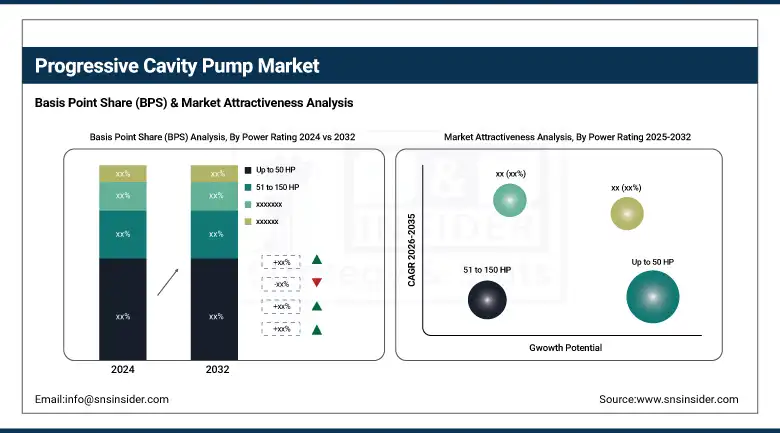
By Power Rating
The Up to 50 HP segment dominated with a market share of over 44.02% in 2024 due to its versatility and cost-effectiveness across various industries. They go into applications such as water treatment, food processing, and the chemical industry, where pumping power requirements are moderate for regular operations. These types of pumps are also used in applications with changing viscosities, thus proving versatile for so many tasks-interfering with wastewater, slurry, and chemical mixing. With such a level of power required for any task, these are low-power machines due to their high efficiency; it is this very thing, along with other factors, that makes these pumps very common and top earning in the market.
The Above 150 HP power rating segment in the progressive cavity pump market is considered the fastest growing segment with increased demand for a strong and high-capacity pumping solution in industries like oil and gas, mining, and large-scale wastewater treatment. These industries require pumps that can operate in demanding tasks such as transferring thick viscous fluids or high-pressure systems. With the expansion and modernization of these industries, the demand for powerful pumps that can assure efficiency, reliability, and performance under harsh conditions increases.
By Pumping Capacity
The Up to 500 GPM segment dominated the market with more than 35% progressive cavity pump market share in 2024. The widespread usage of progressive cavity pumps in wastewater treatment, food and beverages, and chemical industries where moderate flow rates suffice drives the building up of this segment. Being versatile and reliable as well as cost-effective, the pump in this capacity range serves perfectly in smaller applications. They also have a good market share, thanks to their application area to handle viscous fluids, more specifically sludge and slurry.
The 501 to 1000 GPM segment of the progressive cavity pump market is expected to grow rapidly due to rising demand in industries like oil and gas, wastewater treatment, and chemicals. These industries require pumps that efficiently handle moderate-to-high flow rates. With industrial processes growing in intricacy and production being ramped up, the demand for pumping solutions that are reliable yet capable of handling high capacity grows. Being versatile and sturdy allows pumps in this category to handle various fluids efficiently, even under problems; hence, this segment is expected to see the highest growth in the coming years.
By End-Use
The oil & gas segment dominated with a market share of over 64% in 2024 due to the pumps' ability to efficiently handle demanding applications. Progressive cavity pumps are used to transfer viscous fluids, such as crude oil and heavy oils, as well as abrasive materials under varying pressure and flow conditions common in processes related to oil extraction and processing. Their adaptability when working with complex fluid types that include sludges and other difficult materials makes them ideal for offshore oil operations and onshore oil activities.
The water & wastewater segment is the fastest-growing in the progressive cavity pump market, owing to increased demand for efficient handling of fluids in sewage treatment, water supply, and waste management. For such applications, progressive cavity pumps are good for the treatment of sludges, viscous liquids, and solids. They offer a steady and uninterrupted flow with minimal pulsation, especially needed in cases where consistent performance is critical.
Progressive Cavity Pump Market Regional Analysis
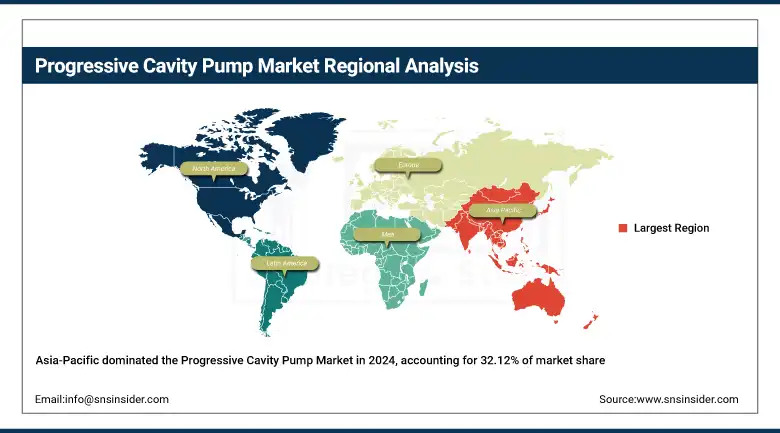
The Asia-Pacific region dominated with a market share of over 32.12% in 2024, primarily owing to the rapid industrialization and infrastructural development taking place in countries such as China, India, and Japan. Demand for PCPs is fueled in the region by the oil & gas, wastewater treatment, and chemical processing industries, which are heavily dependent on fluid-handling solutions. Further propping it up are investments in energy and water management projects and government industrial expansion initiatives. The presence of low-cost manufacturing and increasing urbanization only cement the Asia-Pacific region's top position in the global PCP market.
Get Customized Report as per Your Business Requirement - Enquiry Now
China's progressive cavity pump market keeps growing steadily, propelled by urbanization and improving standards of living. The demand for adequate sanitation and high-tech wastewater treatment solutions follows this trend. Progressive cavity pumps form the backbone of these systems and involve pumping viscous fluids and solids-containing liquids with little shear. Their nature to work in difficult pumping conditions makes them best suited for complicated applications in water and wastewater treatment.
North America being one of the fastest-growing regions in the progressive cavity pump market, has witnessed burgeoning demand from industries such as oil & gas, food processing, and water treatment. The region's emphasis on the usage of energy-efficient and environmentally friendly technologies is driving the gradual makeover of traditional pumping systems toward advanced technologies. Innovation in pump design and automation ensures better performance and, hence, growth in this industry.
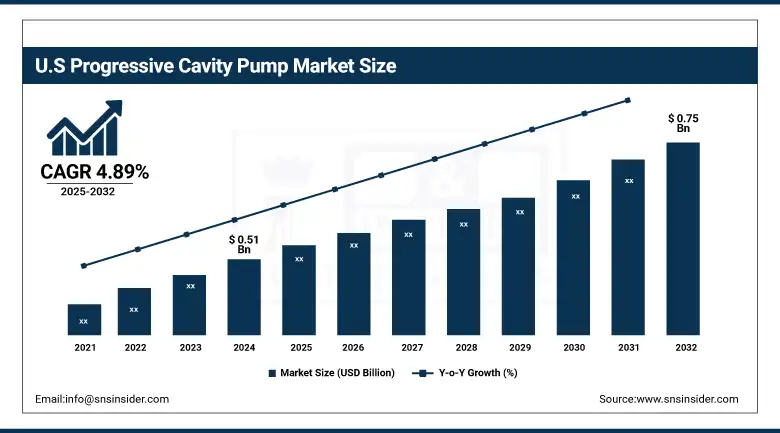
In 2024, the U.S. progressive cavity pump market was valued at USD 0.51 billion, and it is projected to reach USD 0.75 billion by 2032, growing at a CAGR of 4.89%. The growth is augmented by factors like growing demand for wastewater treatment and in the oil & gas and food processing sectors. Also, raising the adoption rate is the focus on energy-efficient pumping systems and easy maintenance across industries.
Europe holds a significant share in the progressive cavity pump market on account of its established manufacturing base, more so in countries like Germany, the UK, and France. These countries come with advanced industrial infrastructure and high standards of engineering. Furthermore, stringent environmental regulations across the region are responsible for the promotion of energy-efficient and low-emission technologies, such as progressive cavity pumps. The increasing demand for wastewater treatment, innovations in pump designs, and performance provide another compelling reason for market growth.
Progressive Cavity Pump Market Key players are:
The key players in progressive cavity pump market include Synopumps, NETZSCH, Moyno Inc., Pumpsquare Systems LLP, Risansi Industries Ltd., Sulzer Ltd, HYDRO PROKAV PUMPS INDIA PRIVATE LIMITED (Ingersoll Rand), INOXPA, Atlas Copco, Roto Pumps Limited, and DOPAG INDIA PVT LTD (HILGER & KERN GROUP).
Progressive Cavity Pump Companies Insights
Moyno comprises a full range of pumps that complement a wide range of applications with their durability and very low maintenance needs. These moyno pump treat different fluid mediums, from clear liquid to very thick slurries, thus presenting a range of applications such as drilling mud, chemical injection, and multiphase fluid transfer. Moyno Magnetic Drive Pumps with sealless technology guarantee a leak-free design, thereby protecting safety and the environment in hazardous applications
Recent Development
-
In June 2024: NETZSCH introduced the NEMO MY magnetically coupled progressing cavity pump at ACHEMA 2024. This pump features a hermetically sealed magnetic coupling, eliminating the need for mechanical seals and enhancing safety and efficiency in handling high-viscosity media like slurries.
-
In February 2025: Atlas Copco's new factory in Pune began manufacturing air and gas compressor systems for both local and export markets. This includes the production of the Gv3 oil-injected air compressor and the ZH+ centrifugal air compressor, both designed for reliability and efficiency.
| Report Attributes | Details |
|---|---|
| Market Size in 2024 | USD 2.98 Billion |
| Market Size by 2032 | USD 4.28 Billion |
| CAGR | CAGR of 4.67% From 2025 to 2032 |
| Base Year | 2024 |
| Forecast Period | 2025-2032 |
| Historical Data | 2021-2023 |
| Report Scope & Coverage | Market Size, Segments Analysis, Competitive Landscape, Regional Analysis, DROC & SWOT Analysis, Forecast Outlook |
| Key Segments | • By Power Rating (Up to 50 HP, 51 to 150 HP, Above 150 HP) • By Pumping Capacity (Up to 500 GPM, 501 to 1000 GPM, Above 1000 GPM) By End Use (Oil & Gas, Water & Wastewater) |
| Regional Analysis/Coverage | North America (US, Canada, Mexico), Europe (Germany, France, UK, Italy, Spain, Poland, Turkey, Rest of Europe), Asia Pacific (China, India, Japan, South Korea, Singapore, Australia, Rest of Asia Pacific), Middle East & Africa (UAE, Saudi Arabia, Qatar, South Africa, Rest of Middle East & Africa), Latin America (Brazil, Argentina, Rest of Latin America) |
| Company Profiles | Synopumps, NETZSCH, Pumpsquare Systems LLP, Risansi Industries Ltd., Sulzer Ltd, HYDRO PROKAV PUMPS INDIA PRIVATE LIMITED (Ingersoll Rand), INOXPA, Atlas Copco, Roto Pumps Limited, DOPAG INDIA PVT LTD. (HILGER & KERN GROUP) |
Get in Touch
