Quantum Dots Market Report Scope & Overview:
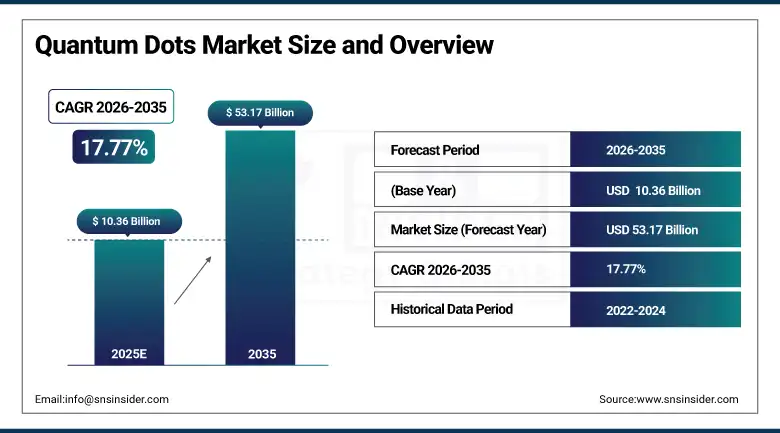
The Quantum Dots Market size was valued at USD 10.36 Billion in 2025E and It is estimated to reach USD 53.17 Billion by 2035, growing at a CAGR of 17.77% between 2026-2035.
Growth in the Quantum Dots Market is driven by the increasing demand for high-resolution displays in televisions, monitors, smartphones, and the quality of advanced displays and energy-efficient lighting has influenced the acceptance of quantum dots (QD) in such devices as LCD, LED, and OLED. The growing use in healthcare imaging, biosensing, and security also drives uptake. Environmental legislations are expected to expedite the trend towards cadmium-free replacements, as nano technologies and production processes are developed to make quantum dots more scalable, more affordable and market ready for the wide range of industry applications.
In 2024–2025, displays accounted for over 60% of the Quantum Dots Market, while solar and healthcare applications together contributed nearly 25%. Asia-Pacific held more than 40% of the share, with cadmium-free technologies driving the fastest growth worldwide.
Quantum Dots Market Size and Growth Forecast:
-
Market Size in 2025: USD 10.36 Billion
-
Market Size by 2035: USD 53.17 Billion
-
CAGR: 17.77% from 2026 to 2035
-
Base Year: 2025
-
Forecast Period: 2026–2035
-
Historical Data: 2022–2024
To Get more information On Quantum Dots Market - Request Free Sample Report
Quantum Dots Market Trends:
-
Asia Pacific dominated in terms of Quantum Dots Market size in 2025 on account of strong electronic and display manufacturing centers in China, South Korea and Japan.
-
Demand for cadmium QDs dominated in terms of type and account for significant consumption in displays and lighting, notwithstanding controls on usage.
-
Pure QD films ruled the device structure, which has been massively installed into TVs and monitors for better brightness and color performance.
-
Displays was still the biggest application in 2025, heavily driven by premium TVs, smartphones and laptops.
-
Consumer electronics was the leading industry segment; it was the primary source of demand, with brands adopting QDs for their next-generation devices.
-
Materials & technologies had strong growth: cadmium-free and perovskite QD investments to comply with a harsher environmental regulation.
U.S. Quantum Dots Market Size Outlook
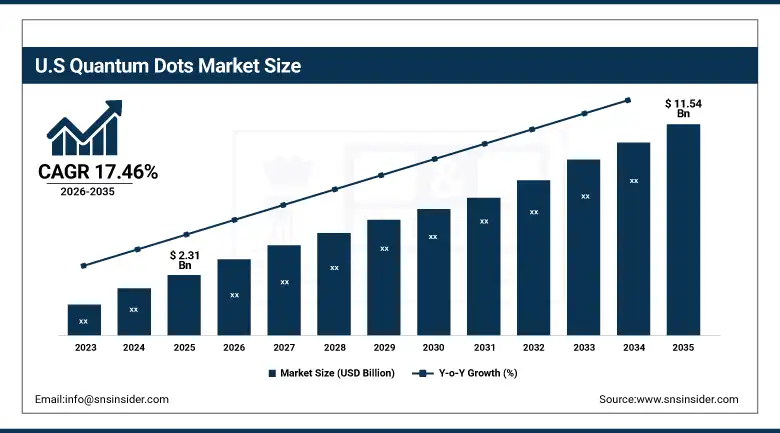
The U.S. Quantum Dots Market was valued at USD 2.31 billion in 2025E and is projected to reach USD 11.54 billion by 2035, growing at a CAGR of 17.46%. Growth is fueled by rising adoption in displays, lighting, solar energy, and bio-imaging, with strong demand from consumer electronics, healthcare, and energy sectors. Major players like Samsung, LG, Nanosys, and Quantum Materials Corp are driving innovation, particularly in cadmium-free and perovskite QDs, accelerating market expansion.
Quantum Dots Market Growth Drivers:
-
Rising Demand for High-Resolution Displays, Growing Consumer Preference for Superior Visual Quality, and Expanding Adoption in TVs, Monitors, and Smartphones Drive Market Growth
Increasing demand for the high-resolution, energy-efficient of displays is driving Quantum Dots Market. Quantum dots have a much greater brightness, broader color gamut, higher power efficiency than other display tech. In particular, QLED TVs, monitors, laptops and smartphones can differentiate their visual performance to cater to more users looking for high resolution picture quality. As manufacturers race to bring the latest viewing technology to market, Quantum Dot adoption is growing at an explosive rate across the globe.
-
In February 2025, TCL reported that its Quantum Dot TV shipments grew by nearly 70% YoY in 2024, with Mini LED models surging by almost 2× year-over-year.
Quantum Dots Market Restraint:
-
Toxicity and Environmental Concerns, Stringent Regulations on Cadmium-Based Quantum Dots, and the Push Toward Costlier Cadmium-Free Alternatives Limit Market Expansion
Toxicity and environmental issues continue to be the key barriers for the Quantum Dots Market. Conventional cadmium-contained quantum dots exhibit highly-efficient luminescent properties, but their biomedical and ecological safety is a matter of concern. This is why tight regulations in places like Europe and North America limit them from being used in consumer electronics and solar. That has in turn made manufacturers speed up the development of cadmium-free solutions, which, while safer, are more expensive and currently less efficient.
Quantum Dots Market Opportunity:
-
Expansion of Cadmium-Free Quantum Dots, Rising Demand for Eco-Friendly Materials, and Growing Adoption in Displays, Solar Energy, and Healthcare Applications Create New Growth Pathways
The most favorable growth opportunity is offered by the cadmium free quantum dots in the market. Because of global laws limiting cadmium compounds, the industries are increasingly turning towards safer alternatives including indium phosphide, carbon, and also perovskite quantum dots. These environmentally-friendly alternatives have superior optical performance and are all compliant: With all of our own product ranges, as well as having the added benefit of consistent natural appearance for increased planting densities. They are now finding growing markets in displays, solar cells, and even medicine, paving the way for innovation and creating new commercial opportunities for sustainable growth within the Quantum Dots Market.
-
In July 2025, a report estimated the cadmium-free Quantum Dots Market to be valued at about USD 4.426 billion, driven largely by rising demand across displays, lighting, and biomedical imaging.
Quantum Dots Market Segmentation Analysis
-
By Component, Materials & Components led the market with 65.23% share and Services & Integration is expected to be the fastest-growing segment at a CAGR of 19.20% from 2026 to 2035.
-
By Type, Cadmium QDs had the highest market share with 48.30% in 2025, but the cadmium-free QDs (the Indium Phosphide and Perovskite, Carbon) are projected to grow with 21.4%CAGR.
-
By Technology, Colloidal QDs was the largest type with a market size of 70.3% in 2025, and Perovskite QDs is expected to be the fastest-growing type, with a CAGR of 22.8% during the period of 2026–2035.
-
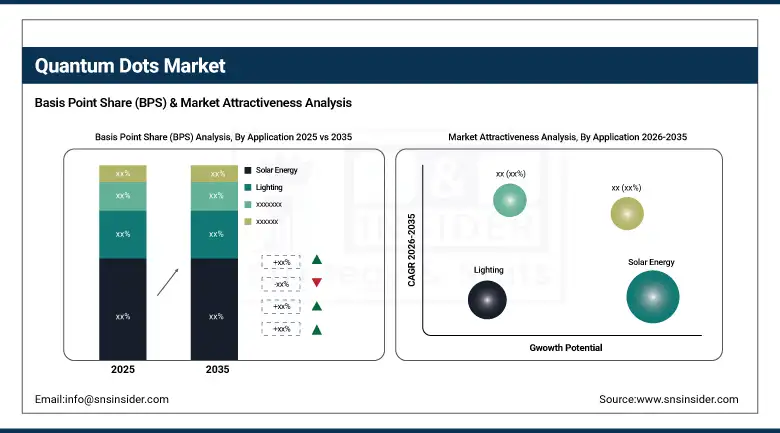
By Application, Consumer Electronics held the largest share in 2025 at 51.10%, whereas Solar Energy & Healthcare & Bio-imaging will witness the highest growth at comparatively higher CAGR of 20.5%.
-
By Industry, Electronics commanded the market with 60.2% share in 2025 and Healthcare & Life Sciences and Renewable Energy are expected to register a 19.7% CAGR.
By Component, Materials & Components dominate market share, while Services & Integration grow fastest
Materials & Components held the largest Quantum Dots Market share in 2025, considering that QD are the building blocks for QD-enabled products, especially for displays and lighting which ensures that the need for quantum dots is high across electronics manufacturing. Nonetheless, Services & Integration is expected to experience the fastest growth, owing to the demand for tailored solutions, integration of the device, and the constant support for quantum dot performance enhancement in every vertical of the industry adoption.
By Type, Cadmium-based QDs lead adoption, while Cadmium-free QDs expand fastest
Cadmium QDs continue to dominate in brighter, higher efficiency and more color accurate applications, including premium displays as well as lighting. On the other hand, Cadmium-free QDs, including InP, perovskite, and carbon, are growing rapidly, in order to meet the increase of clean and environmental regulation enforcement, and the demand for green, sustainable and eco-friendly replacement.
By Technology, Colloidal QDs hold majority share, while Perovskite QDs grow fastest
They are dominated by colloidal QDs because they are prevalently employed in display, lighting, and bio-imaging, accompanied with maturity of manufacturing and reliable performance. In the meantime, Perovskite QDs, owing to their tunable properties, cost-benefit and the expanding use in solar energy and advanced optoelectrical applications, become the fastest-growing sector.
By Application, Consumer Electronics drive demand, while Solar Energy & Healthcare rise fastest
Solar energy held the largest application share in 2025, accounting for 51.10% of the market, driven by the growing deployment of photovoltaic systems and increasing demand for power semiconductor packaging technologies. Meanwhile, healthcare and bio-imaging applications are expected to witness the fastest growth, registering a higher CAGR of 20.5% due to rising adoption of advanced medical electronics and diagnostic imaging systems.
By Industry, Electronics industry leads adoption, while Healthcare & Renewable Energy grow fastest
Consumer electronics accounted for the largest industry share at 60.2% in 2025, supported by high production volumes of smartphones, computing devices, and other compact electronic products that require advanced semiconductor packaging technologies. The continuous need for smaller, faster, and more energy-efficient electronic components further strengthens demand for die attach equipment in this industry. Meanwhile, healthcare & life sciences and renewable energy sectors are expected to record the fastest expansion, registering a CAGR of 19.7%, driven by rising adoption of medical electronics, diagnostic systems, and increasing investments in clean energy technologies and power semiconductor applications.
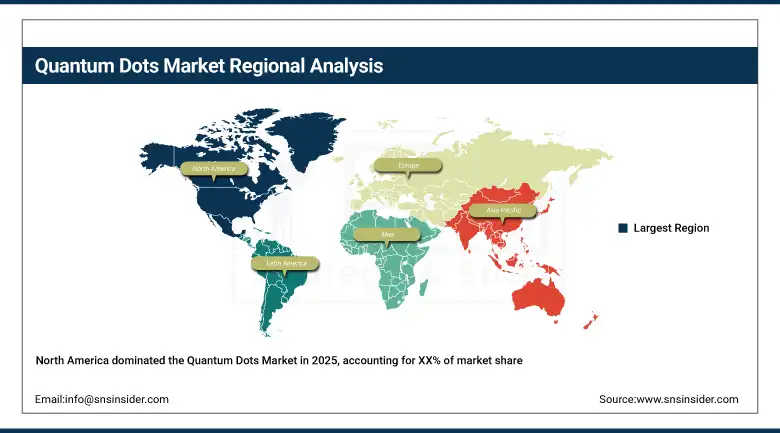
North America Quantum Dots Market Insights:
Quantum Dot was the largest market in North America in 2025, and the market in the region is projected to be driven by robust demand for next-generation display technologies in consumer electronics, early adoption of QLED televisions, and the presence of leading players including Samsung, LG, and Nanosys. The market in the region is supported by the presence of heavy R&D, strong semiconductor ecosystem, and stringent environmental regulation pertaining to the usage of cadmium-free QD innovations. growing use in healthcare imaging, renewables and defense also continue to support North America’s dominant position in the global market.
Get Customized Report as per Your Business Requirement - Enquiry Now
US Quantum Dots Market Insights:
The US is the largest market for Quantum Dot with the presence of significant QLED televisions, monitors, and high-end consumer electronics. Strong R&D presence, patents and investments of major players like Nanosys and leading display manufacturers are driving the growth. Rigid environmental regulations spur the transition towards cadmium free QDs, and broader deployment in healthcare imaging, solar and defense technologies back the US as the largest center for QD innovation and commercialization.
Asia-Pacific Quantum Dots Market Insights:
Asia-Pacific QD market was the leading with 41.00% and fastest-growing region which accounted 18.08% CAGRand in 2025 owing to the presence of major electronics manufacturer in China, South Korea and Japan including Samsung, LG and BOE. Growing consumer preference toward QLED TVs, smartphones and advanced displays drive mass adoption. Government sponsored efforts in renewable energy and in medical advancements also broaden the utilizations of QD. Proximity, cost advantage, and high level of technology adoption make Asia-Pacific a hot bed for production, development and commercialization.
China Quantum Dots Market Insights:
China is the leading market for quantum dot in the Asia-pacific region on account of the large electronics manufacturing industry in the country and leadership in display manufacturing. Quantum dots gain traction in various applications as governments provide backing for semiconductor innovation and renewable energy. Massive investments in AI, advanced materials, and nanotechnology further reinforce its tech advantage. With the growing demand within consumer electronics, solar energy, and healthcare imaging, China leads this region and the world on quantum dot commercialization and innovation.
Europe Quantum Dots Market Insights:
European Quantum Dots Market is looking forward for growth opportunities, with investments in R&D activities related to nanotechnology, renewable energy, and healthcare application. Germany, UK and France among countries leading usage, specifically displays and solar energy. Stringent environmental rule and regulations is pushing the switch to cadmium-free QDs while working with global electronics and materials firms is promoting innovation. Increasing penetration in medical imaging and optoelectronics also reinforces Europe as a lucrative region for the global Quantum Dots Market.
Germany Quantum Dots Market Insights:
An unfathomably naïve dare It is for Germany that not only bases its dominance in the European Quantum Dots Market on its position in advanced manufacturing, automotive displays, and semiconductor research. Government-led penetration of renewable energy and sustainability initiatives is further among the factors driving the cadmium-free QDs adoption.
Middle East & Africa (MEA) and Latin America Quantum Dots Market Insights:
MEA Quantum Dot industry is expected to grow gradually, investment in electronics, healthcare and renewable energy is rising among others together with industrialization offer impetus for a growing market. In MEA, countries such as the UAE and Saudi Arabia are at the forefront of adoption supported by government-led innovation programs along with the requirement for state-of-the-art displays and energy solutions.
Competitive Landscape Quantum Dots Market Insights:
Samsung Display Co., Ltd
Samsung Display is the world’s leading producer of quantum dots, leading the QLED TV and advanced display market. The consumer electronics application is still dominated by cadmium-free QDs, in which Samsung has made big investments, supplying to the Stuckist’s. Its advances in ultra-high-definition panels, color accuracy and energy efficiency give it the momentum to lead the quantum-dot adoption around the world.
-
In May 2025, Samsung’s Neo QLED & QLED TV lineups earned TÜV Rheinland “Real Quantum Dot Display” certification, confirming 100% color volume and compliance with international QD display standards.
Nanosys, Inc.
Nanosys is a foremost provider of quantum dot materials, which offers cadmium free quantum dots for displays, lighting, and solar panels. Nanosys has a patent portfolio and relationships with leading display makers which have positioned it for QD technology commercialization. The company’s emphasis on environmentally friendly technologies such as indium phosphide QDs elevates it to the vanguard of sustainable innovation.
-
In May 2025, it brought onboard LMS as a second major supplier for QDEF films, increasing supply chain capacity to meet global demand for high-brightness, energy-efficient QD displays.
LG Display Co., Ltd.
LG Display uses quantum dots to enhance the color range and accuracy of its OLED and LCD TVs, among other products. The firm incorporates QDs into top-tier TVs, monitors and mobile devices to enable premium consumer electronics to extend the capabilities. With its R&D power and established partnerships in Asia, LG is one of the leading rivals to drive global quantum dot display sales.
-
In April 2025, LG introduced its 2025 QNED evo lineup, certified by Intertek for achieving 100% color volume and integrating its “Dynamic QNED Color Solution,” combining quantum dot elements with AI, Mini LED, and gaming-focused features.
Quantum Dots Companies are:
-
Samsung Display Co., Ltd
-
LG Display Co., Ltd.
-
BOE Technology Group Co., Ltd.
-
Merck Group
-
Dow, Inc.
-
Avantama GmbH
-
Ocean NanoTech, LLC
-
Quantum Materials Corp.
-
Qlight Nanotech
-
QustomDot BV
-
UbiQD Inc.
-
TCL Corporation
-
Crystalplex Corporation
-
NN-Labs LLC
-
Crystal US Corporation
-
Merck (for materials & cadmium-free quantum dots)
-
OSRAM Licht
| Report Attributes | Details |
|---|---|
| Market Size in 2025 | USD 10.36 Billion |
| Market Size by 2035 | USD 53.17 Billion |
| CAGR | CAGR of 17.77 % From 2026 to 2035 |
| Base Year | 2025E |
| Forecast Period | 2026-2035 |
| Historical Data | 2022-2024 |
| Report Scope & Coverage | Market Size, Segments Analysis, Competitive Landscape, Regional Analysis, DROC & SWOT Analysis, Forecast Outlook |
| Key Segments | •By Component (Materials & Synthesis, QD Devices & Components and Services) •Type (Cadmium-based and Cadmium-free) •Technology (Colloidal QDs, Epitaxial QDs and Perovskite QDs) •Application (Displays, Lighting, Solar Energy, Healthcare & Bio-imaging, Sensing & Detection, Security & Anti-counterfeiting and Others) •Industry (Consumer Electronics, Automotive, Healthcare & Life Science, Energy & Utilities, Industrial, Aerospace & Defense and Others) |
| Regional Analysis/Coverage | North America (US, Canada), Europe (Germany, UK, France, Italy, Spain, Russia, Poland, Rest of Europe), Asia Pacific (China, India, Japan, South Korea, Australia, ASEAN Countries, Rest of Asia Pacific), Middle East & Africa (UAE, Saudi Arabia, Qatar, South Africa, Rest of Middle East & Africa), Latin America (Brazil, Argentina, Mexico, Colombia, Rest of Latin America). |
| Company Profiles | Samsung Display Co. Ltd, Nanosys, Inc., LG Display Co. Ltd., BOE Technology Group Co. Ltd., Nanoco Group plc, Merck KGaA, Dow, Inc., Avantama GmbH, Ocean NanoTech, LLC, QD Laser, Inc., Quantum Materials Corp., Qlight Nanotech, QustomDot BV, UbiQD Inc., TCL Corporation, Crystalplex Corporation, NN-Labs LLC, and Crystal US Corporation. |
Frequently Asked Questions
Ans: Manufacturers, Consultants, Association, Research Institutes, private and university libraries, suppliers, and distributors of the product.
Ans: Top-down research, bottom-up research, qualitative research, quantitative research, and Fundamental research.
Ans: The market has been segmented with respect to Component, Type, Technology, Application, Industry.
Ans: The market value is expected to reach USD 53.17 Billion by 2035.
Ans: The Quantum Dots Market size was valued at USD 10.36 Billion in 2025E at a CAGR of 17.77%.
Get in Touch
