Reactive Diluents Market Report Scope & Overview:
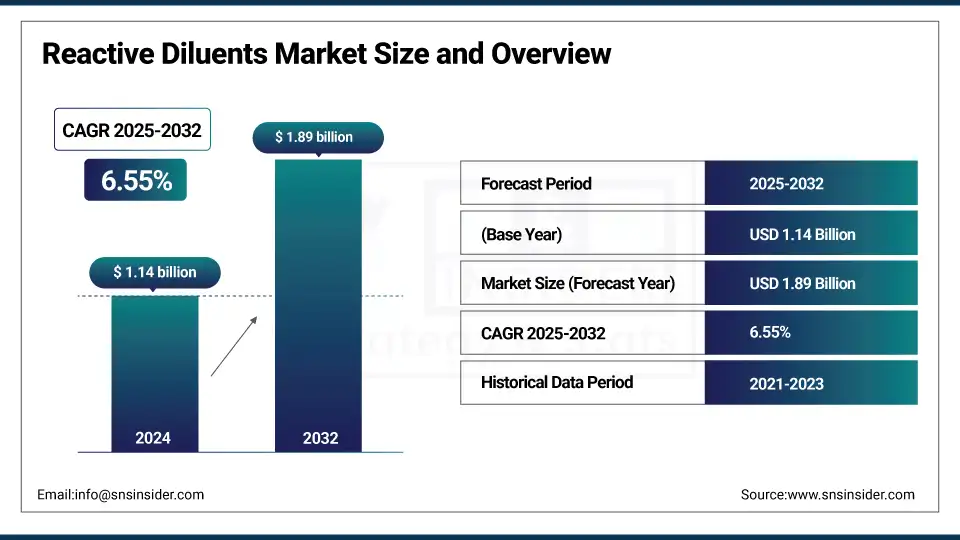
The Reactive Diluents Market Size was valued at USD 1.14 billion in 2024 and is expected to reach USD 1.89 billion by 2032, growing at a CAGR of 6.55% over the forecast period of 2025-2032.
Reactive Diluents Market analysis highlights increasing adoption in composite materials and automotive applications. Increasing use of reactive diluents in the production of composites is majorly propelled by the burgeoning requirements for lightweight & high-performance materials in the automotive industry. They increase the mechanical properties, adherence, and durability of composites as well as reduce emissions of volatile organic compounds (VOCs) to comply with more severe environmental regulations. Reactive diluents can improve material properties where weight gain is a concern while giving automotive production engineers the ability to process structural parts, under-the-hood components, and interior assemblies faster. Moreover, increasing electric vehicles and improving fuel efficiency are some of the trends that propel the consumption of composite materials, ultimately requiring reactive diluents, which drives the reactive diluents market growth.
To Get more information On Reactive Diluents Market - Request Free Sample Report
According to the U.S. Department of Energy Vehicle Technologies Office (VTO), adoption of lightweight components, which include polymer composites made possible using reactive diluents, could save more than 5 billion gallons of gasoline per year by 2030.
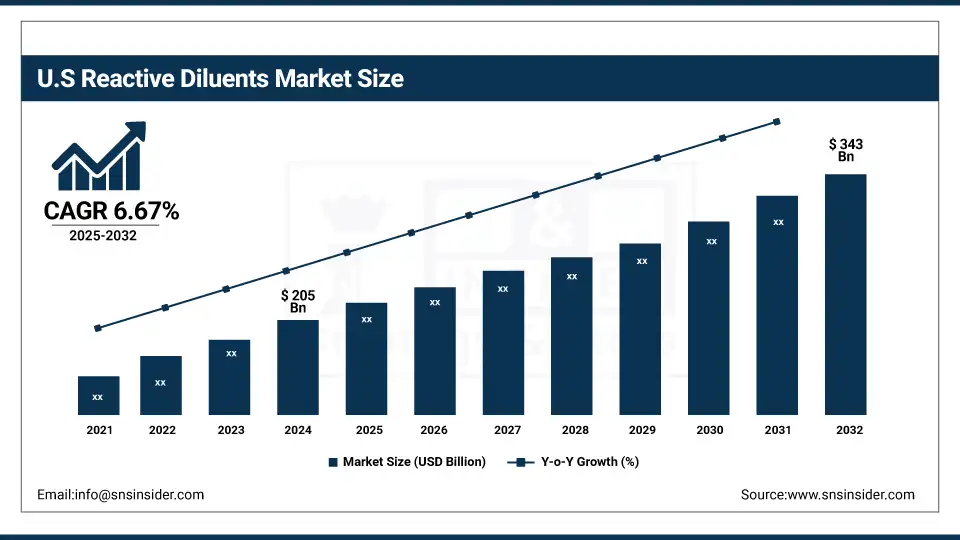
The U.S. Reactive Diluents market size was USD 205 million in 2024 and is expected to reach USD 343 million by 2032 and grow at a CAGR of 6.67% over the forecast period of 2025-2032. It is driven by technological advancements and rising demand for durable coatings and adhesives in automotive, defence, and civil infrastructure projects. The presence of top-tier resin and additive manufacturers also supports consistent innovation and supply chain reliability.
Market Dynamics
Key Drivers:
-
Expansion of Construction and Infrastructure Activities Drive the Market Growth
The increasing urbanization and growing investments in infrastructure development are driving the demand for high-performance materials in the construction business, which involves the bagging of reactive diluents. Such diluents are necessary for the formulation of building and infrastructure coatings, adhesives, and sealants, which have improved viscosity, workability, and durability. The U.S. Census Bureau reported that U.S. construction spending reached USD 2.1trillion in 2024, an increase of nearly 7.6% over the year prior. Commercial and public infrastructure projects are being fast-tracked due to federal programs like the Infrastructure Investment and Jobs Act, in addition. Furthermore, increasing demand for low-VOC sustainable building materials has driven the use of reactive diluents in environmentally friendly formulations.
Restrain
-
Volatility in Raw Material Prices, which may hamper the Market Growth
Reactive diluents are mostly based on petrochemical feedstocks like epoxies, glycidyl ethers, and other derivatives, thereby exposing their costs to direct volatility from crude prices. The downstream prices of these raw materials often fluctuate as crude oil markets continue to be volatile amidst geopolitical tension, OPEC production decisions, and the changing global demand-supply dynamics. Such volatility in turn can squeeze profit margins for manufacturers, especially in regions where prices tend to be low and costs high, like Southeast Asia, Latin America, or much of Africa.
Opportunities:
-
Government Support for Organic and Biopesticide Initiatives Creates an Opportunity for the Market
3D printing is already well-established in industries such as aerospace, healthcare, automotive, and consumer goods, so the demand for high-performance resin systems that reflect these sectors is only going to continue growing. Reactive diluents are key constituents of these formulations as they improve the level of ability, flexibility, and curing characteristics of UV-curable and photopolymer resins that are critical in producing thin layers quickly during manufacturing processing. Diluents are used to adjust viscosity and decrease shrinkage during the creation of detailed, strong parts. The increasingly urgent need for rapid prototyping and customized manufacturing on a global scale corresponds to incorporating reactive diluents into the next generation of advanced material solutions which drive the reactive diluents market trends.
This adjustment is exemplified in Henkel's planned USD 35 million expansion of its U.S. additive manufacturing plant in 2024, creating production capacity for resins for 3D printing applications.
Segment Analysis:
By Type
Aliphatic reactive diluents dominated the market in 2024, holding around 42% share due to their excellent compatibility with epoxy resins and low volatility, making them ideal for coatings and adhesives used in construction and automotive sectors.
Cycloaliphatic types are the fastest-growing, driven by rising demand in electronics and high-performance composites where superior weatherability, thermal resistance, and non-yellowing properties are critical. These are increasingly preferred in UV-curable systems for industrial and optical applications, particularly in developed economies.
By Function
Monofunctional reactive diluents led the segment in 2024 with a 45% market share because of their ability to reduce viscosity and improve flexibility in formulations, especially for coatings and sealants. They are widely used in large-volume, cost-sensitive applications.
Trifunctional & higher diluents are witnessing the fastest growth due to their ability to enhance cross-linking density, thereby improving chemical resistance and mechanical strength. This is particularly valuable in aerospace and automotive composite materials, where performance durability is non-negotiable.
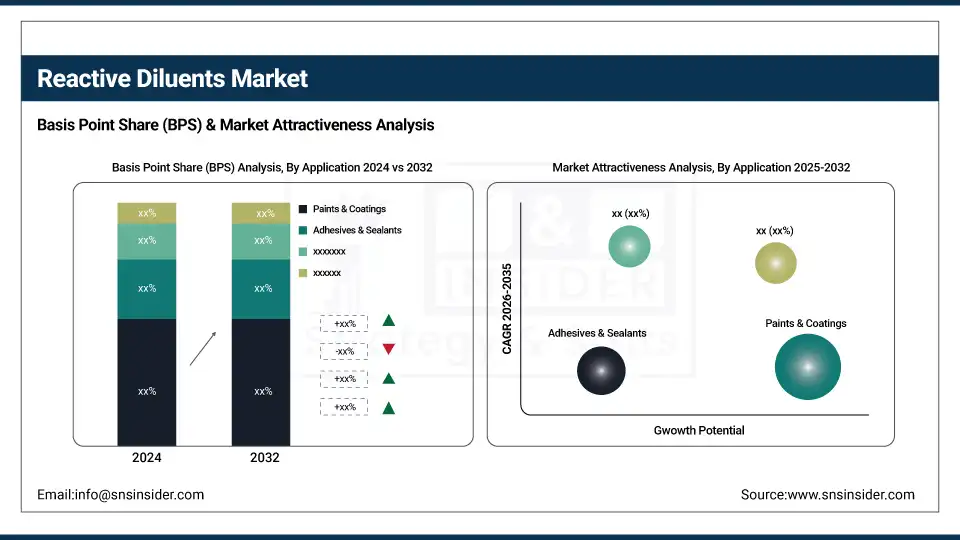
By Application
Paints & Coatings was the leading application segment, accounting for nearly 34% of the total market in 2024, fueled by the rising global demand for protective and decorative coatings in construction and infrastructure projects.
Composites are emerging as the fastest-growing application, driven by their lightweight properties and growing use in electric vehicles (EVs), wind energy, and structural applications. Their compatibility with high-performance resin systems makes reactive diluents critical in improving composite part performance.
By End-Use Industry
Building & Construction held the largest market share at around 38% in 2024, as reactive diluents are heavily used in epoxy-based floor coatings, sealants, and waterproofing applications that are in constant demand across both commercial and residential sectors.
Electrical & Electronics is the fastest-growing end-use segment, propelled by the miniaturization trend and rising use of UV-curable resins in PCB coatings and encapsulations. The push toward more compact, efficient electronics has led to higher consumption of reactive diluent-modified formulations in advanced insulating materials.
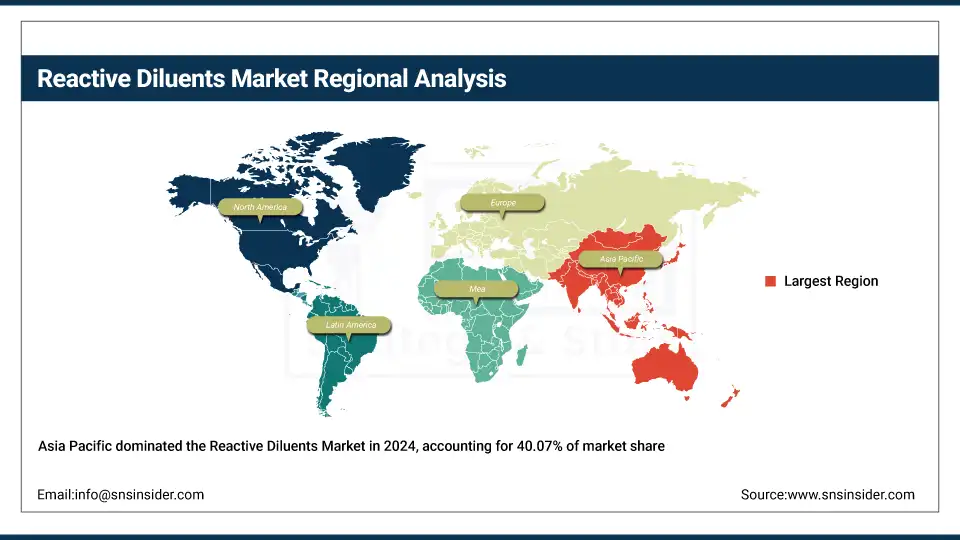
Regional Analysis:
Asia Pacific held the largest Reactive Diluents market share in 2024, around 40.07% 2024. It is due to the region’s strong industrial manufacturing base, rising infrastructure development, and growing demand from the automotive, electronics, and construction sectors. Countries like China, India, and South Korea continue to expand industrial coatings and composite material usage. Lower labor costs, growing foreign investments, and rising domestic consumption are further pushing growth.
Get Customized Report as per Your Business Requirement - Enquiry Now
In 2024, LG Chem expanded its epoxy resin operations in South Korea to support the rising demand for high-performance coatings and composite resins, which significantly increases the use of reactive diluents across electronics and automotive manufacturing lines.
The North America region is the fastest-growing market. It is due to its strong presence of specialty chemical manufacturers, increasing investment in sustainable building solutions, and the growth of advanced manufacturing. Demand from aerospace, construction, and 3D printing applications is rising steadily. Stricter environmental standards are also driving innovation in low-VOC reactive diluent formulations.
In 2024, Hexion Inc. announced an upgrade to its Ohio-based production facility to increase the output of specialty reactive diluents for composite and adhesives applications, targeting industries such as wind energy and automotive.
In 2024, Henkel USA invested $35 million in expanding its additive manufacturing center in North Carolina to increase resin output for 3D printing, which uses UV-curable systems with reactive diluents as key components.
Europe maintains a significant share of the Reactive Diluents market. It is due to its well-established coatings, automotive, and aerospace sectors. Environmental regulations are stricter, encouraging the shift to bio-based and low-VOC diluent formulations. Germany, France, and Italy are key markets where demand is driven by energy-efficient infrastructure development.
In 2024, Allnex, a leading European coatings resin company, introduced a new line of reactive diluents optimized for low-emission flooring systems and composite materials, reinforcing the region’s focus on sustainability and performance.
Key Players:
Major Reactive Diluents companies are Huntsman Corporation, Aditya Birla Chemicals, Olin Corporation, Hexion Inc., Kukdo Chemical Co., Ltd., Evonik Industries AG, Arkema Group, EMS-Grivory, Sachem Inc., Adeka Corporation, Sakamoto Yakuhin Kogyo Co., Ltd., Atul Ltd., Nippon Shokubai Co., Ltd., Mitsubishi Chemical Corporation, Toagosei Co., Ltd., Zhejiang Wynca Chemical Group Co., Ltd., Shanghai Resin Co., Ltd., Cardolite Corporation, Anshan Beida Industry Co., Ltd., and Bluestar Harbin Petrochemical Co., Ltd.
Recent Development:
-
In 2024, LG Chem expanded its epoxy resin manufacturing line in South Korea to meet the surging demand from the automotive and electronics industries. This expansion is designed to strengthen the company's supply capabilities for both reactive diluents and composite-grade resins used in high-performance applications.
-
In 2024, Hexion Inc. upgraded its production facility in Ohio to boost the output of specialty reactive diluents. The facility now supports increased demand from sectors like wind energy, marine coatings, and automotive adhesives, where high-performance materials are critical.
| Report Attributes | Details |
| Market Size in 2024 | USD 1.14 Billion |
| Market Size by 2032 | USD 1.89 Billion |
| CAGR | CAGR of6.55% From 2025 to 2032 |
| Base Year | 2024 |
| Forecast Period | 2025-2032 |
| Historical Data | 2021-2023 |
| Report Scope & Coverage | Market Size, Segments Analysis, Competitive Landscape, Regional Analysis, DROC & SWOT Analysis, Forecast Outlook |
| Key Segments | • By Type: Aliphatic, Aromatic, Cycloaliphatic • By Function: Monofunctional, Difunctional, Trifunctional & Higher • By Application: Paints & Coatings, Adhesives & Sealants, Composites, Construction, Electronics, Automotive, Others (Marine, Aerospace, etc.) • By End-Use Industry: Building & Construction, Automotive, Electrical & Electronics, Aerospace, Marine, Others |
| Regional Analysis/Coverage | North America (US, Canada), Europe (Germany, France, UK, Italy, Spain, Poland, Russsia, Rest of Europe), Asia Pacific (China, India, Japan, South Korea, Australia,ASEAN Countries, Rest of Asia Pacific), Middle East & Africa (UAE, Saudi Arabia, Qatar, Egypt, South Africa, Rest of Middle East & Africa), Latin America (Brazil, Argentina, Mexico, Colombia Rest of Latin America) |
| Company Profiles | Huntsman Corporation, Aditya Birla Chemicals, Olin Corporation, Hexion Inc., Kukdo Chemical Co. Ltd., Evonik Industries AG, Arkema Group, EMS-Grivory, Sachem Inc., Adeka Corporation, Sakamoto Yakuhin Kogyo Co., Ltd., Atul Ltd., Nippon Shokubai Co., Ltd., Mitsubishi Chemical Corporation, Toagosei Co., Ltd., Zhejiang Wynca Chemical Group Co., Ltd., Shanghai Resin Co., Ltd., Cardolite Corporation, Anshan Beida Industry Co., Ltd., Bluestar Harbin Petrochemical Co., Ltd. |
Frequently Asked Questions
Ans: Trends include rising use in 3D printing, bio-based diluents, and advancements in high-performance resin systems.
Ans: Asia Pacific is expected to dominate due to robust industrial growth, urbanization, and infrastructure development.
Ans: Key applications include paints & coatings, adhesives & sealants, composites, electronics, and construction materials.
Ans: Growth is driven by rising demand from automotive, construction, electronics, and composite sectors due to enhanced performance and cost efficiency.
Ans: The Reactive Diluents Market includes low-viscosity compounds used to modify resin properties and is segmented by Type, Function, Application, and End-Use Industry.
Get in Touch
