Activated Carbon Market Report Scope & Overview:
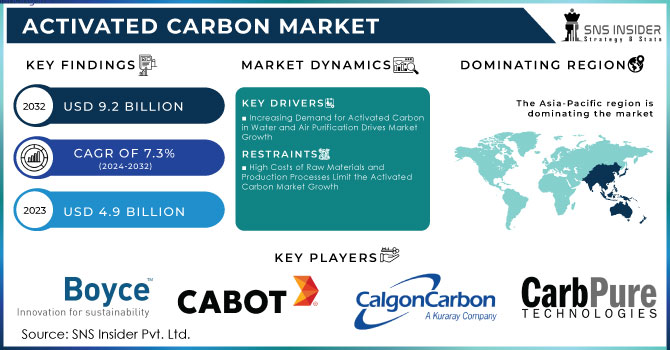
The Activated Carbon Market Size was valued at USD 4.9 billion in 2023 and is expected to reach USD 9.2 billion by 2032 and grow at a CAGR of 7.3% over the forecast period 2024-2032.
Get More Information on Activated Carbon Market - Request Sample Report
The rising applications of the activated carbon market are giving it significant momentum across various industries. Activated carbon is being used as a recognized product for its high adsorption value, in water purification, air filtration, food and beverage processing, and lately even more modern technologies such as supercapacitors and medical solutions. Growth in the market is further driven by the increased awareness of it being a greener solution for that reason. In July 2024, IISc partners with a start-up to use activated carbon made from coconut husks in a supercapacitor-showcasing how sustainable raw materials are being put into use for advanced energy storage solutions. The move not only cuts waste but also improves the efficiency of energy systems-another leap in innovation by the industry.
Activated carbon is also increasingly visible in health care and personal care products. According to Charcoal Essentials by July 2024, activated charcoal is said to help solve skin problems. Activated charcoal detoxifies and therefore offers a natural alternative to cosmetic products. Its adsorption qualities prove to be effective for purification and detoxification of the skin, which has made it a substance sought after by the skincare world. In September 2022, scientists at the University of Gothenburg showed how the smell of diapers could be removed by activated carbon, which indicated the potential that a simple product can have in improving everyday life. The development demonstrates the versatility of activated carbon, not only in dealing with the environmental and health dimensions but also in upgrading the hygiene and comfort of consumers.
A research study in Chinese universities developed advanced adsorption PAN-based carbon fibers in December 2022. Such fibers have been incorporated into a host of industries including environmental remediation and industrial filtration. For example, the improvement in adsorption efficiency that such PAN-based fibers offer makes them useful in other applied areas such as purifying water and air. The development of selectively activated carbon forms, specifically those based on PAN fibers, underlines this concept that the market is shifting towards more customized solutions to meet the different needs of various industries and sectors.
Regionally, the production side of activated carbon has also shifted miles. In April 2022, Zaacoal, in partnership with the University of Mines and Technology in Ghana, began exploring the possibility of attaining the global market of activated carbon. The firm is going to produce activated carbon from local resources as demand goes high in other sectors. This market will continue to grow further, as there will be an ongoing effort to drive global supply chains while supporting the local economy. All these efforts, along with technological innovations in different areas, point to further growth of activated carbon, which is always driven by economies of sustainability and efficiency across various industries.
Activated Carbon Market Dynamics
KEY DRIVERS:
-
Increasing Demand for Activated Carbon in Water and Air Purification Drives Market Growth
The continuous global concerns of pollution with the environment as well as water scarcity have increased the demand for activated carbon in water as well as air purification applications. Governments and agencies around the world are forming rigorous regulations about water treatment and emissions control, which has further accelerated the use of activated carbon in industries ranging from municipal water treatment to manufacturing and chemical processing. Activated carbon does possess superior adsorption properties compared to other materials, which makes it an excellent medium through which the removal of contaminants in water and air takes place. This material can remove harmful chemicals, odors, and volatile organic compounds from both sources. The fact that companies are using environmentally friendly filtration systems owing to the growing demand for sustainability is also a factor driving market growth. Increased penetration of air purification systems in homes, workplaces, and industries also fuels the growth in the activated carbon market since they contribute to cleaning polluted air.
-
Rising Use of Activated Carbon in Medical and Pharmaceutical Applications Supports Market Expansion
Activated carbon is becoming increasingly applied in medical and pharmaceutical fields due to its superior adsorption properties. In such applications, it commonly is used in preparations for medication to remove toxins and as a treatment for poisoning by trapping harmful chemicals and impurities. In the health care area, activated carbon is used in wound care products because it helps to lower infections due to bacterial and toxic absorption. Activated carbon in the pharmaceutical industry is used to purify raw materials and intermediates in drug manufacturing. As health concerns rise with a growing demand for proper detoxification methods, especially in weak health infrastructures, the application of activated carbon in medicine is expected to rise even more and contribute to intensified market growth. This wide range of applications in life sciences is setting up the activated carbon market for long-term growth.
RESTRAIN:
-
High Costs of Raw Materials and Production Processes Limit the Activated Carbon Market Growth
High production cost is the other major drawback that badly hinders the growth of the activated carbon market. The primary raw materials for producing this activated carbon come from coal, wood, and coconut shells. These factors usually cause their prices to experience volatility due to supply chain disruptions and other factors such as environmental laws and geopolitical controversy. Its production process is power-intensive and requires huge capital spending, making the whole manufacturing cost of activated carbon high. Most of these costs are then passed to consumers, limiting many low-cost industries from embracing activated carbon mainly in developing regions. Another pressure in the market comes from alternative materials such as bio-based adsorbents that make those industries compete for more low-cost solutions. These cost challenges become one of the major hurdles in the popularization of activated carbon.
OPPORTUNITY:
-
Emerging Opportunities for Activated Carbon in Renewable Energy Storage Solutions
Advances in renewable energy technology, specifically energy storage, however, open up new areas in the activated carbon market. With increasing high surface areas along with electric conductivity, activated carbons are gaining more interest in energy storage-related applications in supercapacitor and battery technologies to make them of improved quality in terms of increasing the efficiency of energy storage and transfer. The demand for renewable sources such as solar and wind power tends to increase due to the increased efficiency and sustainability of energy storage. Companies are coming up with innovative ways to include activated carbon in energy storage devices that facilitate energy storage by renewable resources. Therefore, the increasing interest in curbing carbon emissions along with increasing efficiency in the use of energy provides a new and favorable scope for activated carbon manufacturers to capitalize on emerging opportunities within the renewable energy sector.
CHALLENGES:
-
Environmental Regulations and Sustainability Requirements Challenge Activated Carbon Producers
The activated carbon industry is facing tighter environmental controls and sustainability issues. The governments of most countries are introducing strict regulations regarding the disposal of wastes and carbon emissions and sustainable production practices, which influence the manufacturing process of activated carbon. Activated carbon producers are being compelled to use cleaner technologies to reduce the environmental impact of their operations. The situation has become difficult, especially because of the increased demand for sustainable raw material sources like renewable biomass in the production of activated carbon. This makes sourcing of these materials costly and scarce. Thus, the biggest challenge is balancing production with lower costs but remaining within environmental control. In addition, the green certification issue and corporate social responsibility add pressure on companies to be innovative while remaining profitable.
Activated Carbon Market Segments
By Type
The powdered activated carbon segment dominated and accounted for a revenue share of more than 50% of the activated carbon market in 2023. Its extensive usage in water and air purification is due to its large surface area and excellent adsorption properties. It is significantly applied in municipal water treatment plants to remove organic compounds, chlorine, and other impurities. For example, powdered activated carbon is applied for purification in industries that work on treating wastewater because it easily disperses into water and enables easy treatment. Its wider application to food/beverage processing, pharmaceuticals, and chemicals puts it into a market driving force or leader position. Further, the ease with which it can be handled within industries, especially during air purification, where its use for emission control boosts, makes more individuals demand the product.
By Raw Material
The coal-based activated carbon segment dominated and secured the highest share of revenue in 2023 of the activated carbon market, accounting for more than 40% market share. The dominance is because the adsorption capacities are high and it is cost-effective as well as widely available. Hence, it continues to remain one of the most preferred sources of water treatment, air purification, as well as industrial processes. For example, it can filter out organic compounds, chlorine, and heavy metals present in water and air, which allows industries using coal-based activated carbon to utilize this filter efficiently. Coal-based activated carbon is significantly applied in power plants and industrial gas purification processes with the removal of mercury, enhancing demand in various geographies. Its wide acceptance in the market is due to its affordability and ready availability, as compared to other raw materials including wood or coconut.
By Application
The water and wastewater treatment segment dominated and constituted the largest market share for activated carbon, at approximately over 45% in 2023. This is because the world has now shifted focus to clean water accessibility while simultaneously enacting strict regulations on water quality. Activated carbon is relatively effective for removing a range of contaminants from water, from organic compounds to chlorine, pesticides, and heavy metals. It has therefore become the preferred material for municipal and industrial water treatment plants. For instance, it is extensively used in municipal water treatment plants to treat drinking water and by industries to subject wastewater to proper treatment before being discharged into the environment to meet environmental standards. In addition, the steadily rising need for clean water in developing countries, as well as the need for high-grade water treatment in industrial processes, has further boosted demand for activated carbon within this end-use market.
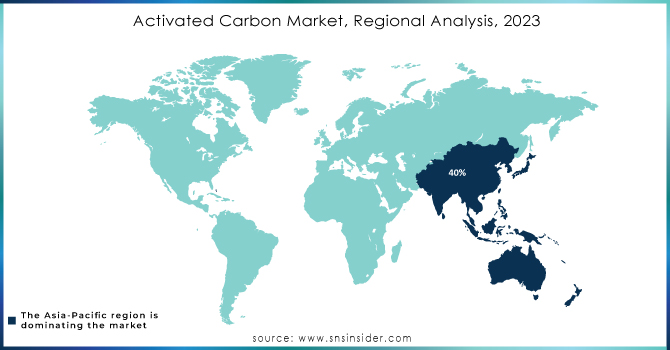
Activated Carbon Market Regional Analysis
The Asia-Pacific dominated the activated carbon market with a market share of around 40%. This is mainly because of fast industrialization and growth coupled with urbanization and rising awareness about environmental concerns in the Asia-Pacific region, especially among giant countries such as China, India, and Japan. These countries have imposed rigorous environmental regulations on water and air purifications, thereby boosting the demand for activated carbon in water treatment, pharmaceutical, and food & beverage processing industries. For instance, activated carbon is one of the most gigantic consumer markets in China as it is used on a vast scale in wastewater treatment and air purification systems regarding industrial pollution as well as the issues with the quality of municipal water. In addition, knowledge about environmental sustainability throughout the region fosters stable activation of carbon demand.
Moreover, in 2023 North American region emerged as the fastest growing region with an estimated CAGR of over 10%. The impetus for this growth lies in several environmental regulations, particularly within the U.S. aimed at the reduction of mercury emissions from industrial sources to ensure access to clean water. Air quality and wastewater treatment regulations from the U.S. government have fueled broader utilization of activated carbon solutions amongst industries-unequivocally so in coal-fired power plants and industrial air purification. The region also hosts maturing renewable energy storage industries in which activated carbon is used in supercapacitors and batteries, and therefore the market, in general, is expected to continue growing. In North America, the ongoing medical and food & beverage sectors are contributing to the rapidly expanding demands in that region for activated carbon.
Get Customized Report as per your Business Requirement - Request For Customized Report
Key Players
-
Boyce Carbon (Granular Activated Carbon, Powdered Activated Carbon)
-
Cabot Corporation (Cabot Norit Activated Carbon, Calgon Activated Carbon)
-
Calgon Carbon Corporation (Filtrasorb, Acticarb)
-
CarbPure Technologies (Coconut Shell Activated Carbon, Coal-Based Activated Carbon)
-
Carbo Tech AC GmbH (CarboTech Granular Activated Carbon, CarboTech Powdered Activated Carbon)
-
Carbon Resources LLC (Granular Activated Carbon, Coconut Shell Activated Carbon)
-
Evoqua Water Technologies LLC (Evoqua Activated Carbon, Vantage Activated Carbon)
-
Jacobi Carbons AB (Jacobi Carbons Granular Activated Carbon, Jacobi Carbons Powdered Activated Carbon)
-
Kuraray Co. Ltd (Kuraray Activated Carbon, Granular Activated Carbon)
-
Oxbow Activated Carbon LLC (Oxbow Granular Activated Carbon, Oxbow Powdered Activated Carbon)
-
Osaka Gas Chemical Co. Ltd. (OSAKAREN activated carbon, Granular Activated Carbon)
-
Silcarbon Aktivkohle GmbH (Silcarbon Granular Activated Carbon, Silcarbon Powdered Activated Carbon)
-
Siemens Water Technologies Corp. (Siemens Activated Carbon, Siemens Water Filtration Solutions)
-
Activated Carbon Technologies, Inc. (ACT Granular Activated Carbon, ACT Powdered Activated Carbon)
-
ADVENT Technologies, Inc. (ADVENT Carbon Electrode Materials, ADVENT Carbon Composites)
-
BASF SE (BASF activated carbon for air treatment, BASF activated carbon for water treatment)
-
Haycarb PLC (Haycarb Granular Activated Carbon, Haycarb Powdered Activated Carbon)
-
Ingevity Corporation (Ingevity Activated Carbon, Ingevity Specialty Carbon Products)
-
Norit Nederland B.V. (Norit Granular Activated Carbon, Norit Powdered Activated Carbon)
-
Woodbrook Group (Woodbrook Granular Activated Carbon, Woodbrook Powdered Activated Carbon)
Suppliers and Distributors of Activated Carbon Market
-
Evoqua Water Technologies LLC
-
Calgon Carbon Corporation
-
Jacobi Carbons AB
-
Cabot Corporation
-
Kuraray Co. Ltd
-
Haycarb PLC
-
Norit Nederland B.V.
-
CarbPure Technologies
-
Oxbow Activated Carbon LLC
-
Activated Carbon Technologies, Inc.
Associations
-
Activated Carbon Manufacturers Association (ACMA)
-
International Activated Carbon Association (IACA)
-
American Water Works Association (AWWA)
-
Water Environment Federation (WEF)
-
Environmental Protection Agency (EPA)
-
Coalition for Sustainable Rail (CSR)
-
European Activated Carbon Group (EACG)
RECENT DEVELOPMENTS
August 2023: NRL signed a Memorandum of Agreement with IIT Guwahati for developing green activated carbon from bamboo dust. This collaboration will help produce economically viable and sustainably active carbon from the vast available bamboo.
| Report Attributes | Details |
|---|---|
|
Market Size in 2023 |
US$ 4.9 Billion |
|
Market Size by 2032 |
US$ 9.2 Billion |
|
CAGR |
CAGR of 7.3% From 2024 to 2032 |
|
Base Year |
2023 |
|
Forecast Period |
2024-2032 |
|
Historical Data |
2020-2022 |
|
Report Scope & Coverage |
Market Size, Segments Analysis, Competitive Landscape, Regional Analysis, DROC & SWOT Analysis, Forecast Outlook |
|
Key Segments |
•By Type (Powdered, Granulated, Others) |
|
Regional Analysis/Coverage |
North America (US, Canada, Mexico), Europe (Eastern Europe [Poland, Romania, Hungary, Turkey, Rest of Eastern Europe] Western Europe] Germany, France, UK, Italy, Spain, Netherlands, Switzerland, Austria, Rest of Western Europe]), Asia Pacific (China, India, Japan, South Korea, Vietnam, Singapore, Australia, Rest of Asia Pacific), Middle East & Africa (Middle East [UAE, Egypt, Saudi Arabia, Qatar, Rest of Middle East], Africa [Nigeria, South Africa, Rest of Africa], Latin America (Brazil, Argentina, Colombia, Rest of Latin America) |
|
Company Profiles |
Oxbow Activated Carbon LLC., Boyce Carbon, CarbPure Technologies, Cabot Corporation, Osaka Gas Chemical Co. Ltd., Calgon Carbon Corporation, Evoqua Water Technologies LLC, Siemens Water Technologies Corp., Carbon Resources LLC, Kuraray Co. Ltd, Carbo Tech AC GmbH, Silcarbon Aktivkohle GmbH, Jacobi Carbons AB and other key players |
|
Drivers |
•Increasing Demand for Activated Carbon in Water and Air Purification Drives Market Growth |
|
Restraints |
•High Costs of Raw Materials and Production Processes Limit the Activated Carbon Market Growth |
Frequently Asked Questions
Ans: China led the Activated Carbon Market in the Asia Pacific region with the highest revenue share in 2023.
Ans: The factors that restrict the growth of the activated carbon market are high production costs, availability of cheaper alternatives, and fluctuating raw material prices.
Ans: Increasing demand for clean water and air, stringent environmental regulations, and growing awareness about the benefits of activated carbon in various industries drive the growth of the activated carbon market.
Ans: The expected CAGR of the global Activated Carbon Market during the forecast period is 7.3%.
Ans: The Activated Carbon Market was valued at USD 4.9 billion in 2023.
Get in Touch
