Reciprocating Pumps Market Report Scope & Overview:
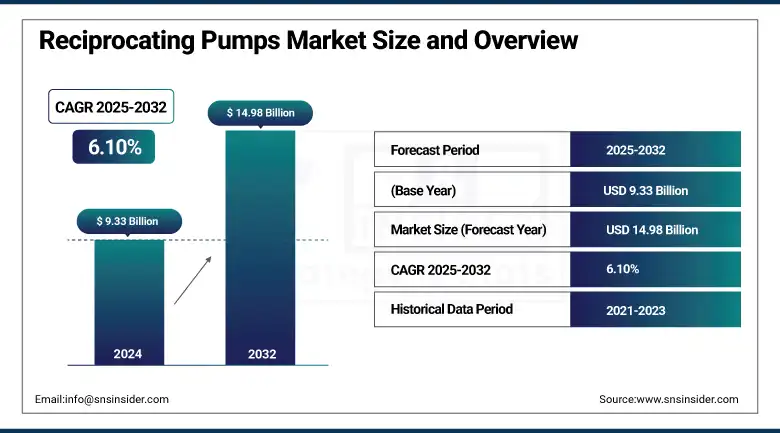
The Reciprocating Pumps Market size was valued at USD 9.33 billion in 2024 and is expected to reach USD 14.98 billion by 2032, growing at a CAGR of 6.10% over the forecast period of 2025-2032.
Reciprocating Pumps Market growth will be driven by the growing need for reliable, high-pressure pumping solutions in a wide range of industrial applications. Positive-displacement reciprocating pumps function by trapping a fixed volume of fluid, then displacing it mechanically. They are used for viscous, abrasive, or high-pressure fluids. Industrial reciprocating pumps are suited for providing precise flow rates in applications including oil & gas, chemical processing, power generation, and water treatment, which can be arduous at times. Some of the key trends include smart monitoring system technological advancements, wear-resistant material development, and modular designs in pumps for easy maintenance and longevity.
To Get more information On Reciprocating Pumps Market - Request Free Sample Report
According to industry data, reciprocating pumps are able to generate pressures that exceed 30,000 psi, which further makes them indispensable in processes, such as hydraulic fracturing and boiler feed applications. Furthermore, these pumps can also handle several different types of fluids, from slurries to very hot liquids to corrosive chemicals, raising their usefulness in vital industrial processes. Even with competitive centrifugal and rotary pumps in many applications, where precision of delivery or high pressure is material to the process being served, the reciprocating pump is seldom dislodged from its favored position. The continuous demand for energy efficiency and reliability of operation of fluid handling systems continues to drive innovations and adoptions, and therefore, the pumps market.
In March 2025, Lufkin Industries sold its North American Downhole business to Q2 Artificial Lift Services. The move allows Lufkin to focus on surface equipment and automation, while Q2 strengthens its position in downhole reciprocating pumps. The deal includes assets, staff, and customer ties, expanding Q2’s artificial lift capabilities.
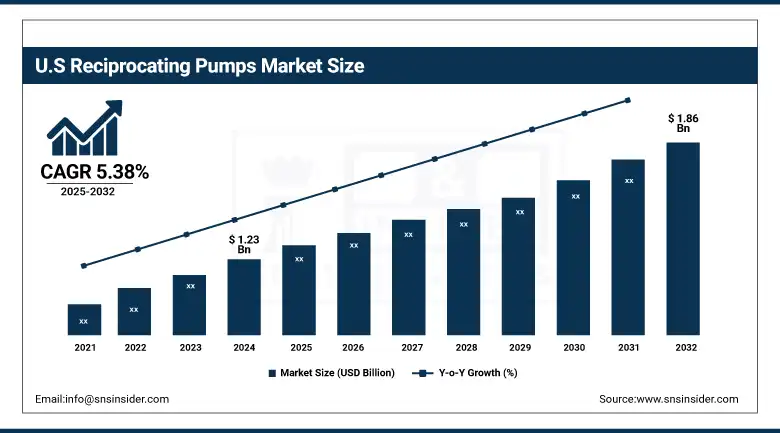
The U.S. reciprocating pumps market is projected to grow from USD 1.23 billion in 2024 to USD 1.86 billion by 2032, registering a CAGR of 5.38%. Growth is driven by strong demand from industries, such as oil & gas, water treatment, and manufacturing. Technological advancements and infrastructure investments are further supporting market expansion. The U.S. remains the leading market in North America for reciprocating pumps.
Reciprocating Pumps Market Dynamics:
Drivers:
-
Rising Oil and Gas Industry Fuels Strong Growth in Reciprocating Pumps Market
Increasing adoption of recirculation pumps in the oil & gas industry is one of the major factors responsible for fueling the growth of the market in the near future. These pumps are used in their upstream exploration and production processes, including drilling, well completion, and hydraulic fracturing, where they inject high-pressure fluids to facilitate hydrocarbon recovery. Reciprocating pumps are utilized for the transportation of crude oil & natural gas and are also utilized in some enhanced oil recovery (EOR) methods, water flooding, and gas injection. For instance, the growing adoption of smart technologies, sensors that IMU can use for predictive maintenance, adds to their efficiency and reliability in these heavy-duty applications. The reciprocating pumps market has immense growth potential due to the expansion of the oil and gas sector globally, particularly in developing countries.
In May 2025, ProPetro Holding's ProPWR division secured its first power contract in the Permian Basin to provide 80 megawatts of power using natural gas reciprocating engines and gas turbines. This project targets areas with limited utility infrastructure, emphasizing the increasing use of reciprocating technology to ensure reliable power in oilfield operations.
Restraints
-
Critical Role of Regular Maintenance in Enhancing Reciprocating Pump Efficiency and Reducing Operational Costs
Reciprocating pumps are used in a wide variety of applications and industries, but this type of pump does have complexities that require more routine maintenance. If inspections are not being conducted regularly, it can lead to major failures, such as valve wear, seal degradation, and debris accumulation. If these maintenance practices are neglected, energy consumption may increase, as poorly working pumps consume more energy and thus, drive up operational costs. Moreover, unexpected pump failures can lead to unplanned downtime, disrupting production schedules and causing delays and costs.
For instance, a case study in the oil and gas sector highlighted that the timely identification of pump issued through condition monitoring prevented a potential failure, saving approximately USD 300,000 in repair and downtime costs. Therefore, investing in regular maintenance not only extends the lifespan of reciprocating pumps but also enhances operational efficiency and reduces long-term expenses
Reciprocating Pumps Market Segmentation Outlook:
By Type
The diaphragm pumps segment dominated the market and accounted for 58.02% of the Reciprocating Pumps market share. This is the reason that they are very popular because of their versatility to be used with different fluids, such as corrosive, abrasive, and viscous fluids. They have never been out of fashion, as they are widely used in chemical processing, water treatment, pharmaceuticals, and food and beverage industries due to their high reliability, being designed to be leak-proof, and easy to maintain. Durable design that is safe to handle hazardous materials and is ideal for the most demanding industrial settings. Combined with this, these features also reinforce their strong position and continued market adoption among end users.
Piston pumps are recognized as the fastest-growing segment in the reciprocating pumps market due to their superior efficiency, high pressure capabilities, and versatility across various industries. The unique combination of their ability to handle high-viscosity fluids with high-precision flow rates makes them suitable for demanding applications in oil & gas, chemical processing, and water treatment. Moreover, the durability and lower operational and maintenance costs of piston pump technology have been developed over the years, which are also one of the main supporting factors for its increased adoption. Piston pumps are rapidly expanding in the market, as they are being driven by growing industrialization, a rise in demand for reliable fluid transfer solutions, and the necessity of energy-efficient pumping systems.
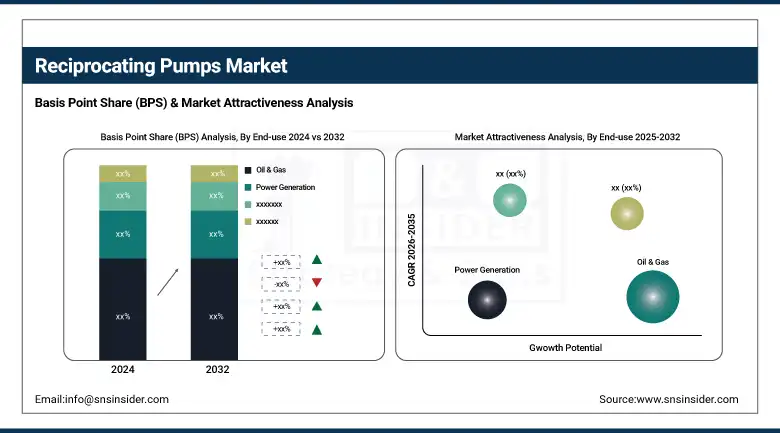
By End-use
The Oil & Gas segment dominates the Reciprocating Pumps Market, accounting for a significant 26.12% share in 2024. The essentiality of reciprocating pumps in managing high-pressure applications, fluid transfer, and accurate flow regulation in the industry contributes to this majority share. Ongoing exploration and production activities continue to drive needs, coupled with a growing demand for pumping systems that can deliver oil through refineries and help transport it to and from refineries, fueling the segment's growth. Moreover, a strict regulatory framework and the requirement of dependable equipment in harsh conditions will also drive the reciprocating pumps in the oil & gas segment, maintaining the sector's domination in the market.
The Chemical segment is the fastest-growing end-use sector in the reciprocating pumps market, fueled by rising demand for reliable, precise, and high-pressure pumping solutions essential in chemical processing industries. The essentiality of reciprocating pumps in managing high-pressure applications, fluid transfer, and accurate flow regulation in the industry contributes to this majority share. Ongoing exploration and production activities continue to drive needs, coupled with a growing demand for pumping systems that can deliver oil through refineries as well as help transport it to and from refineries, fueling the segment's growth. Moreover, a strict regulatory framework and the requirement of dependable equipment in harsh conditions will also drive the reciprocating pumps in the oil & gas segment, maintaining the sector's domination in the market.
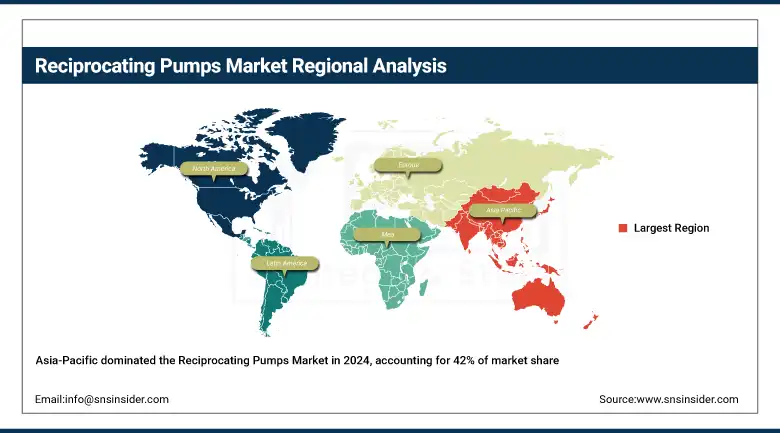
Reciprocating Pumps Market Regional Analysis:
The Asia-Pacific region dominates the reciprocating pumps market with a commanding 42% share in 2024, making it the fastest-growing region globally. The fastest pace of progress is due to accelerated industrialization, growing infrastructural projects, and swift urbanization across multiple countries, such as China, India, and Southeast Asia. The growing demand for efficient pumping solutions from key industries, including oil & gas, water treatment, and chemical manufacturing, shall further propel the growth of the market. Furthermore, the burgeoning reciprocating pumps market in this region is primarily driven by government programs aimed at improving water supply and power generation facilities.
Get Customized Report as per Your Business Requirement - Enquiry Now
China dominates the reciprocating pumps market due to its large industrial base, rapid urbanization, and major infrastructure projects. Growth is supported by healthy demand in sectors such as oil & gas, chemical processing, and water treatment. The market is also receiving additional support from government projects aimed at enhancing water management and energy production. India and Japan do their share China is in a league of its own.
Europe holds the position as the second-largest market for reciprocating pumps, supported by its strong industrial base and continuous technological advancements. In addition, the strict regulatory standards associated with energy efficiency and environmental protection in the region drive the adoption of reliable and advanced technologies for pumps in the region. Countries with developed economies, such as Germany, France, and the U.K. focus on the chemical processing, pharmaceutical, and water management sectors, contributing to stable demand. The continual development of pump designs, materials, and energy-saving features reinforces Europe as the top reciprocating pumps market over the forecast period.
Germany leads the Reciprocating Pumps Market due to its strong industrial base and advanced manufacturing capabilities. A rise in demand for effective pumps due to stringent environmental regulations. Growth is driven by major growth industries, such as those in chemical processing, automotive, and pharmaceuticals. Germany is the regional centre for advanced reciprocating pump technologies due to its focus on innovation and energy efficiency.
North America maintains a significant share of the reciprocating pumps market, and it is expected to continue supporting its position due to a stable industrial base and ongoing investments in energy, manufacturing, and infrastructure. This growth is driven by strong demand from oil & gas, power generation, and wastewater treatment industries, mostly in the U.S. and Canada. Market competition is made fierce by strong technological expertise and well-established major pump manufacturers. Moreover, the North American market is driven by increased emphasis on upgrading with aging infrastructure and higher energy efficiency, making it a key region for the adoption and innovation of reciprocating pumps.
Key players in Reciprocating Pumps Market are:
Reciprocating pump companies are Fluimac pump solution, SPX Flow, Gardner, Ruhrpumpen Group, Flowserve Corporation, Ningbo Hilead Hydraulic Co., Ltd., Parker, Eaton, Denver Inc., and Alfa Laval.
Recent Developments:
-
In May 2024: Fluimac took part in Drupa 2024, the premier global trade fair for printing technologies in Düsseldorf, Germany. The company showcased its innovative double diaphragm pneumatic and centrifugal pumps aimed at boosting production efficiency across industries. Fluimac highlighted how their pumps integrate seamlessly into industrial processes to enhance performance and support environmental sustainability.
-
In March 2025: Eaton launched two new Bezares hydraulic pumps at Work Truck Week a lighter, high-pressure bushing-style dump pump with dual rotation support, and a variable flow pump with load-sensing technology for efficient, versatile use in agriculture, forestry, and more. These pumps improve performance and ease of installation.
| Report Attributes | Details |
|---|---|
| Market Size in 2024 | USD 9.33 Billion |
| Market Size by 2032 | USD 14.98 Billion |
| CAGR | CAGR of 6.10% From 2025 to 2032 |
| Base Year | 2024 |
| Forecast Period | 2025-2032 |
| Historical Data | 2021-2023 |
| Report Scope & Coverage | Market Size, Segments Analysis, Competitive Landscape, Regional Analysis, DROC & SWOT Analysis, Forecast Outlook |
| Key Segments | • By Type (Piston Pumps, Diaphragm Pumps, Plunger Pumps) • By End-use (Agriculture, Construction & Building Services, Water & Wastewater, Power Generation, Oil & Gas, Chemical, Others) |
| Regional Analysis/Coverage | North America (US, Canada, Mexico), Europe (Germany, France, UK, Italy, Spain, Poland, Turkey, Rest of Europe), Asia Pacific (China, India, Japan, South Korea, Singapore, Australia, Rest of Asia Pacific), Middle East & Africa (UAE, Saudi Arabia, Qatar, South Africa, Rest of Middle East & Africa), Latin America (Brazil, Argentina, Rest of Latin America) |
| Company Profiles | Fluimac pump solution, SPX Flow, Gardner, Ruhrpumpen Group, Flowserve Corporation, Ningbo Hilead Hydraulic Co., Ltd., Parker, Eaton, Denver Inc., Alfa Laval |
Get in Touch
