Water Recycle and Reuse Market Report Scope & Overview:
The Water Recycle and Reuse Market Size was esteemed at USD 17.77 billion in 2025E and is expected to reach USD 38.77 billion by 2033 with a growing CAGR of 10.24% over the forecast period 2026-2033.
The Water Recycle and Reuse Market report offers a distinctive focus on technological advancements, highlighting the integration of IoT and smart water management systems that enhance real-time monitoring and efficiency. It also emphasizes the growing adoption of membrane filtration technologies, such as reverse osmosis and ultrafiltration, which are pivotal in producing high-quality recycled water. Additionally, the report sheds light on the increasing implementation of circular economy principles, promoting closed-loop water systems to minimize waste and environmental impact. These insights underscore the market's response to escalating water scarcity and the need for sustainable water management solutions.
Water Recycle and Reuse Market Size and Forecast:
-
Market Size in 2025E: USD 17.77 Billion
-
Market Size by 2033: USD 38.77 Billion
-
CAGR: 10.24% from 2025 to 2033
-
Base Year: 2025
-
Forecast Period: 2026–2033
-
Historical Data: 2022–2024

To Get more information on Water Recycle and Reuse Market - Request Free Sample Report
Key Water Recycle and Reuse Market Trends:
-
Integration of advanced membrane technologies and AI-driven monitoring enhances water purification, treatment efficiency, and real-time quality control.
-
Adoption of decentralized water recycling systems improves wastewater management, reduces environmental impact, and supports sustainable urban infrastructure.
-
Rising investments in industrial water reuse and zero-liquid discharge (ZLD) solutions optimize resource utilization and minimize operational costs.
-
Growth of smart water management platforms and IoT-enabled sensors enables predictive maintenance, leak detection, and efficient distribution of recycled water.
-
Increasing focus on regulatory compliance and sustainability mandates drives adoption of advanced recycling technologies and environmentally responsible practices.
-
Partnerships between municipalities and private firms promote large-scale water reuse projects, supporting industrial, agricultural, and residential applications.
-
Development of energy-efficient treatment processes reduces operational costs while ensuring safe and high-quality recycled water for multiple sectors.
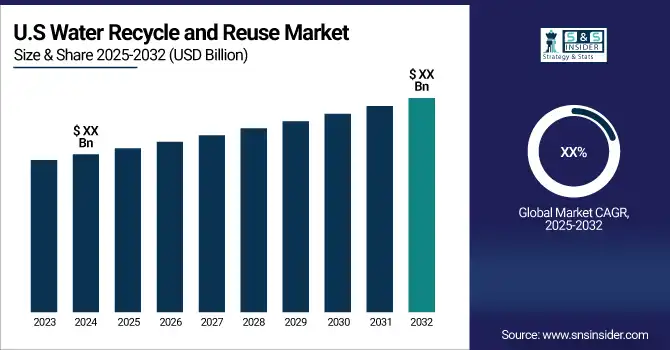
The U.S. Water Recycle and Reuse market size was valued at an estimated USD 7.85 billion in 2025 and is projected to reach USD 17.30 billion by 2033, growing at a CAGR of 9.21% over the forecast period 2026–2033. Market growth is driven by increasing water scarcity concerns, rising demand for sustainable water management solutions, and stringent regulations promoting wastewater treatment and reuse. Expanding applications across municipal, industrial, and agricultural sectors, along with growing investments in advanced treatment technologies such as membrane filtration, reverse osmosis, and UV disinfection, are accelerating market expansion. Additionally, increasing government funding for water infrastructure modernization and heightened awareness of water conservation further strengthen the growth outlook of the U.S. water recycle and reuse market during the forecast period.
Water Recycle and Reuse Market Drivers:
-
Escalating water scarcity, driven by population growth, urbanization, and climate change, is fueling the adoption of water recycling and reuse to conserve dwindling freshwater resources.
Escalating water scarcity is a critical global challenge driven by rapid population growth, urbanization, and climate change. With cities growing larger and larger, urbanization has only added to the problem of growing demand for water and the creation of wastewater. Climate change compounds the crisis by changing patterns of precipitation, spurring extended periods of drought, and reducing supplies of freshwater. As a result, it has established the need for sustainable water management solutions, for example, water recycling and reuse. Advanced treatment technologies allow for the reclamation and reuse of wastewater by industries, municipalities, and agriculture, reducing downstream dependency on conventional sources. Countries that experience chronic water shortages countries in the Middle East, California, and parts of Asia are investing in large-scale recycling systems to help alleviate water stress.
Water Recycle and Reuse Market Restraints:
-
The high initial investment in water recycling infrastructure, including advanced treatment technologies and operational costs, poses a major barrier, especially for SMEs with limited financial resources.
The high initial investment required for water recycling and reuse systems remains a major challenge, particularly for small and medium-sized enterprises (SMEs). Building treatment facilities, pipelines, and new filtration technologies like reverse osmosis and ultrafiltration require significant capital expenditure. Moreover, the financial burden is exacerbated by operational costs such as energy consumption and maintenance. The reluctance to adopt these systems in many industries is due to long payback periods and uncertainty over return on investment. Large organizations can write off these costs, whereas SMEs often live hand to mouth, with limited access to funding. Government incentives and subsidies can step in to ease this burden, but regulations and the absence of a standardized policy framework across regions can delay the initiation of solutions. The upfront financial commitment required to deploy water recycling infrastructure, though, continues to inhibit widespread adoption, particularly in cost-sensitive markets, despite the long-term water conservation benefits and regulatory compliance incentives.
Water Recycle and Reuse Market Opportunities:
-
Industries like manufacturing, power generation, and agriculture are adopting water recycling to reduce costs, meet regulations, and enhance sustainability.
Industries such as manufacturing, power generation, and agriculture are among the largest consumers of water, making efficient water management critical for sustainability and cost reduction. Water recycling and reuse solutions present a pathway to reduce reliance on freshwater sources and mitigate wastewater disposal. In the manufacturing sector, advanced filtration and treatment technologies facilitate process water reuse which reduces operational costs and enables adherence to strict environmental regulations. Thermal energy plants use recycled water to help cool the plants, easing the pressure on municipal water systems. Likewise, treated wastewater is increasingly repurposed for irrigation, conserving freshwater resources and improving crop resilience in arid regions, particularly in agriculture. Regulatory pressures and corporate sustainability initiatives are driving industries to develop closed-loop water systems through innovative treatment solutions like membrane filtration, reverse osmosis, and advanced oxidation. Not only does this improve environmental stewardship but it also develops long-term operational efficiency.
Water Recycle and Reuse Market Challenges:
-
Regulatory variability creates compliance challenges for companies, requiring adaptable solutions to meet differing water recycling standards across regions.
Regulatory variability in the Water Recycle and Reuse Market presents a significant challenge for companies navigating multiple jurisdictions. There are various water quality standards, treatment requirements, and compliance protocols in different countries and even regions within a country. It also makes it much more challenging to adopt standardized recycling technologies and operating procedures, unnecessarily driving up costs and administration for businesses. For instance, in some countries, strict water treatment before reuse is required, while in others, guidelines are more lenient, making it difficult for companies to develop systems that can be used across the board. Additionally, changes in regulation and environmental policies are constantly evolving, and businesses must adapt accordingly to stay compliant. These discrepancies can delay adoption rates for corporations, and businesses need flexible water treatment solutions backed by legal expertise to navigate this issue. All possible, but they would require some degree of collaboration between governments and industry stakeholders to ensure that regulations are harmonized and that best practices are shared, to pave the way for cross-border initiatives to use treated wastewater sustainably.
Water Recycle and Reuse Market Segmentation Analysis:
By Equipment, Filtration Segment Leads Water Recycle and Reuse Market in 2025
The Filtration segment dominated with a market share of over 38% in 2025, owing to its instrumental role in removing impurities and maintaining water quality before reuse. Common filtration technologies such as reverse osmosis (RO), ultrafiltration (UF), and activated carbon filtration punctuate the industrial, municipal, and commercial landscapes. These systems include physical, chemical, and biological processes that reduce dissolved solids, microorganisms, chemicals, or any other industrial contaminant to allow the reuse of water for manufacturing, irrigation, and portable applications. The increasing focus on sustainable water management, strict environment legislation, and seamless filtration replacement with advanced membrane techniques are some of the key factors driving filtration demand. The need is clear: with industries and municipalities prioritizing water conservation, high-efficiency filtration systems will continue to be the best solution for effective and low-energy cost treatment of water.
By Capacity, Large-Scale Systems (>100,001 L) Dominate Market Share in 2025
The >100,001 L segment dominated with a market share of over 34% in 2025, due to its widespread adoption in large-scale industrial facilities, municipal water treatment plants, and commercial establishments. These systems play a vital role in handling large quantities of waste water, making sure that you can efficiently reuse the water from these systems without crossing the line that is defined by stringent environmental regulations. Large-scale water recycling is essential in industries including, but not limited to, power generation, pharmaceuticals, and chemicals to maximize resource utilization and minimize freshwater dependency. Increasing urbanization and growing population have further increased the demand for municipal wastewater treatment, which is boosting this segment as well. As governments tighten up water conservation rules globally, investments are being made in large-capacity treatment plants.
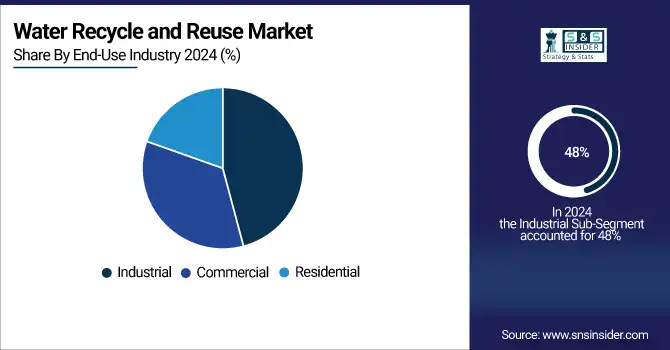
By End-Use Industry, Industrial Sector Drives Water Recycle and Reuse Market Growth in 2025
The Industrial segment dominated with a market share of over 48% in 2025, due to its extensive water usage and stringent regulatory requirements. Sectors like manufacturing, power generation, oil & gas, and chemicals need substantial amounts of water for their operations, cooling, and processing as the threat of water scarcity increases and the costs of wastewater disposal rise, industries are increasingly adding advanced water recycling technologies such as membrane filtration, reverse osmosis and UV disinfection to their infrastructures. Various government regulations and sustainability measures are also forcing industries to provide efficient water management solutions. The movement toward lowering freshwater consumption, lessening environmental impact, and lowering expenditure also helps explain why the industrial sector holds a leading proportion of the market size and is one of the biggest players augmenting demand for water recycling solutions.
Water Recycle and Reuse Market Regional Analysis:
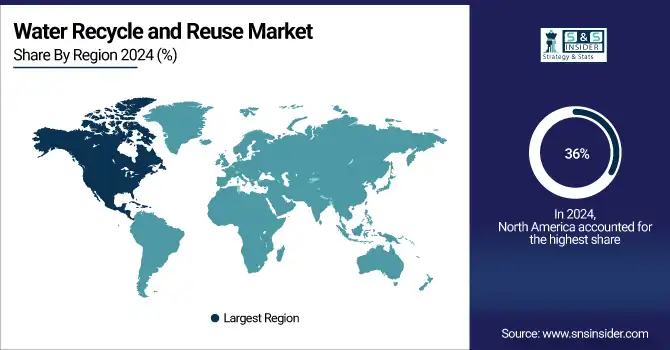
North America Dominates the Water Recycle and Reuse Market in 2025
North America holds an estimated 36% market share in 2025, driven by stringent environmental regulations, industrial water scarcity, and increasing adoption of advanced water recycling systems. This causes industries and municipalities to invest heavily in water reuse infrastructure to reduce freshwater dependency and comply with sustainability mandates.
Get Customized Report as per Your Business Requirement - Enquiry Now
-
United States Leads North America’s Water Recycle and Reuse Market
The U.S. dominates due to a combination of strict federal and state-level water regulations, advanced wastewater treatment infrastructure, and high industrial water consumption. Growing concerns about water scarcity, especially in arid regions like California and Texas, have prompted significant investment in recycling technologies such as membrane filtration, reverse osmosis, and UV disinfection. Corporations and municipalities are increasingly adopting sustainable water management practices to minimize environmental impact, reduce operational costs, and ensure regulatory compliance. With technological innovation and government incentives, the U.S. continues to lead North America’s water recycle and reuse initiatives.
Asia Pacific is the Fastest-Growing Region in Water Recycle and Reuse Market in 2025
The region is expected to grow at a CAGR of 10.8% from 2026–2033, driven by rapid urbanization, industrial expansion, and government-backed water sustainability projects. This causes industries and municipalities to implement large-scale water recycling systems to meet rising water demand and minimize environmental stress.
-
China Leads Asia Pacific’s Water Recycle and Reuse Market
China dominates due to rapid industrialization, population growth, and increasing water scarcity in urban centers. National initiatives like the “Water Pollution Prevention and Control Action Plan” encourage adoption of advanced water recycling technologies across manufacturing, power, and chemical sectors. Municipalities are upgrading wastewater treatment facilities to reuse water for irrigation, industrial cooling, and non-potable applications. With government funding, strong regulatory enforcement, and technological advancements, China is setting benchmarks for large-scale water recycling projects, supporting sustainable water management and long-term economic growth in the Asia Pacific region.
Europe Water Recycle and Reuse Market Insights, 2025
Europe is experiencing steady growth in water recycling due to strict environmental regulations, rising sustainability awareness, and industrial demand for water-efficient solutions. Germany’s enforcement of stringent wastewater and industrial water regulations increases investment in advanced recycling systems, driving market growth across Europe.
Germany dominates Europe’s market owing to its strong focus on sustainable industrial practices and water conservation. Industrial sectors in Germany adopt innovative treatment technologies such as membrane filtration and reverse osmosis. Government policies, regulatory frameworks, and incentives for reducing freshwater consumption further reinforce the country’s leadership in the European water recycle and reuse market. Germany serves as a model for efficient water management in the region.
Middle East & Africa and Latin America Water Recycle and Reuse Market Insights, 2025
The market in these regions is steadily expanding due to increasing water scarcity, urbanization, and infrastructure development. Countries such as Saudi Arabia, UAE, Brazil, and Mexico are investing in large-scale water recycling projects to meet industrial and municipal demands. Governments are promoting sustainable water use through policy initiatives, while private-sector adoption of filtration, membrane, and treatment technologies accelerates. Collaborative projects and technological adoption enhance efficiency, enabling water reuse in agriculture, industrial processes, and urban infrastructure. This growth is driven by water conservation imperatives and rising demand for sustainable water solutions.
Competitive Landscape for Water Recycle and Reuse Market:
Veolia Water Technologies
Veolia Water Technologies is a global leader in water and wastewater treatment solutions, providing advanced systems for municipal, industrial, and commercial applications. The company designs, engineers, and implements water recycling and reuse technologies, including membrane filtration, reverse osmosis, and advanced biological treatment systems. Veolia operates worldwide, offering turnkey solutions and long-term service contracts to optimize water efficiency and sustainability. Its role in the water recycle and reuse market is pivotal, as it enables clients to reduce freshwater consumption, comply with environmental regulations, and enhance operational efficiency.
-
In 2024, Veolia expanded its recycled water portfolio by launching integrated membrane-based systems for industrial and municipal clients, focusing on energy-efficient and low-maintenance operations.
Evoqua Water Technologies
Evoqua Water Technologies is a U.S.-based provider of water treatment and recycling solutions, serving industrial, commercial, and municipal sectors. The company specializes in designing and delivering filtration systems, membrane technologies, and customized water reuse infrastructure. By combining engineering expertise with innovative technologies, Evoqua enhances water efficiency and sustainability across large-scale operations. Its role in the market is significant, providing solutions that reduce wastewater discharge, minimize environmental impact, and support regulatory compliance.
-
In early 2024, Evoqua introduced an advanced reverse osmosis-based water recycling system tailored for chemical and pharmaceutical industries, improving operational efficiency and water savings.
Kubota Corporation
Kubota Corporation, headquartered in Japan, is a leading manufacturer of industrial water treatment equipment and wastewater recycling systems. The company offers high-performance filtration, ultrafiltration, and membrane-based solutions for municipal, industrial, and agricultural applications. Kubota combines cutting-edge technology with engineering expertise to optimize water reuse, reduce operational costs, and ensure environmental compliance. Its role in the water recycle and reuse market is central, providing reliable, scalable, and energy-efficient solutions for sustainable water management.
-
In 2024, Kubota launched a new modular ultrafiltration system for industrial wastewater treatment, enabling flexible deployment and enhanced recycling efficiency.
SUEZ Water Technologies & Solutions
SUEZ Water Technologies & Solutions is a global provider of water and wastewater treatment systems, offering technologies for filtration, membrane treatment, and chemical management. The company focuses on helping municipalities and industries improve water reuse, reduce freshwater consumption, and meet stringent environmental regulations. SUEZ’s solutions include integrated water recycling plants and ongoing operational support, ensuring optimal performance and sustainability. Its role in the market is vital, as it enables clients to achieve cost-effective water management while reducing environmental impact.
-
In 2024, SUEZ deployed advanced water recycling solutions for municipal and industrial clients, emphasizing energy-efficient membrane technologies and digital monitoring capabilities.
Water Recycle and Reuse Market Key Players:
-
Veolia Water Technologies
-
Evoqua Water Technologies
-
Kubota Corporation
-
SUEZ Water Technologies & Solutions
-
Hitachi Ltd.
-
Fluence Corporation Limited
-
Siemens Energy
-
Dow Chemical Company
-
Alfa Laval
-
Melbourne Water
-
Pentair
-
Xylem Inc.
-
Aquatech International
-
Toray Industries
-
Mitsubishi Chemical Aqua Solutions
-
BASF
-
OriginClear
-
Ovivo Inc.
-
IDE Technologies
-
Ecolab
| Report Attributes | Details |
|---|---|
| Market Size in 2025E | USD 17.77 Billion |
| Market Size by 2033 | USD 38.77 Billion |
| CAGR | CAGR of 10.24% From 2026 to 2033 |
| Base Year | 2025 |
| Forecast Period | 2026-2033 |
| Historical Data | 2022-2024 |
| Report Scope & Coverage | Market Size, Segments Analysis, Competitive Landscape, Regional Analysis, DROC & SWOT Analysis, Forecast Outlook |
| Key Segments | • By Equipment (Filtration, Machinery, Tanks, Pipes & Drains, Others) • By Capacity (<25,000L, 25,001 TO 50,000L, 50,001L TO 100,000L, 100,001L) • By End-use Industry (Industrial, Commercial, Residential) |
| Regional Analysis/Coverage | North America (US, Canada, Mexico), Europe (Eastern Europe [Poland, Romania, Hungary, Turkey, Rest of Eastern Europe] Western Europe] Germany, France, UK, Italy, Spain, Netherlands, Switzerland, Austria, Rest of Western Europe]), Asia Pacific (China, India, Japan, South Korea, Vietnam, Singapore, Australia, Rest of Asia Pacific), Middle East & Africa (Middle East [UAE, Egypt, Saudi Arabia, Qatar, Rest of Middle East], Africa [Nigeria, South Africa, Rest of Africa], Latin America (Brazil, Argentina, Colombia, Rest of Latin America) |
| Company Profiles | Veolia Water Technologies, Evoqua Water Technologies, Kubota Corporation, SUEZ Water Technologies & Solutions, Hitachi Ltd., Fluence Corporation Limited, Siemens Energy, Dow Chemical Company, Alfa Laval, Melbourne Water, Pentair, Xylem Inc., Aquatech International, Toray Industries, Mitsubishi Chemical Aqua Solutions, BASF, OriginClear, Ovivo Inc., IDE Technologies, Ecolab. |
Frequently Asked Questions
Ans: North America dominated the Water Recycle and Reuse Market in 2025.
Ans: The “Filtration” segment dominated the Water Recycle and Reuse Market.
Ans: Escalating water scarcity, driven by population growth, urbanization, and climate change, is fueling the adoption of water recycling and reuse to conserve dwindling freshwater resources.
Ans: The Water Recycle and Reuse Market was USD 17.77 billion in 2025 and is expected to reach USD 38.77 billion by 2033.
Ans: The Water Recycle and Reuse Market is expected to grow at a CAGR of 10.24% during 2026-2033.
Get in Touch
