image

Pressure Pumping Market Key Insights:

Pressure Pumping Market Revenue Analysis

To Get More Information on Pressure Pumping Market - Request Sample Report

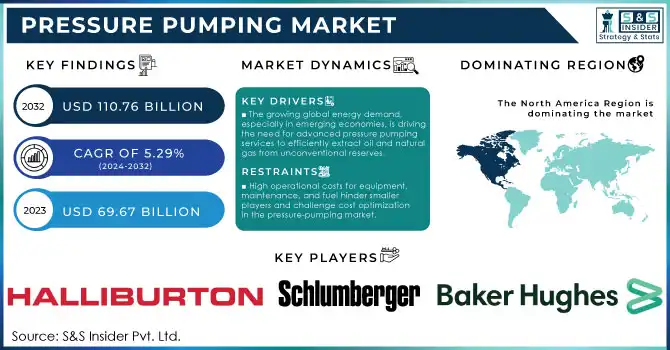
The Pressure Pumping Market Size was valued at USD 69.67 billion in 2023 and is projected to reach USD 110.76 billion by 2032 and develop at a CAGR of 5.29% over the forecast period 2024-2032.

The pressure pumping market plays a crucial role in the oil and gas industry, providing essential services for the extraction of hydrocarbons from wells. Pressure pumping refers to the use of high-pressure equipment to inject fluids into oil or gas wells to stimulate production. The primary techniques involved in pressure pumping include hydraulic fracturing (fracking) and cementing, both of which are pivotal for enhancing well productivity. Hydraulic fracturing is the most common method, wherein high-pressure fluid is pumped into underground rock formations to create fractures, allowing the oil or gas to flow more freely to the surface. This process has become particularly important with the rise of unconventional oil and gas production from shale deposits. The market has experienced significant growth, driven by the increasing demand for oil and gas, particularly from emerging economies. As exploration and production activities continue to expand, the need for efficient and cost-effective pressure pumping services has grown.

Pressure pumping is not limited to conventional oil and gas wells; it is also vital for the production of shale gas and tight oil, both of which require advanced fracking techniques. The rise of hydraulic fracturing in the past decade has transformed the energy landscape, particularly in North America, where the boom in shale oil production has significantly increased the demand for pressure-pumping services. The U.S. alone saw more than 1,000 rigs active in shale oil production during peak years. Additionally, the market is impacted by regulatory changes and environmental concerns, with a growing emphasis on sustainability and minimizing the environmental footprint of pressure-pumping activities. The development of greener technologies, such as waterless fracking, is expected to influence the future trajectory of the market.

Feature Description Commercial Products
Security Ensures data security with immutable transaction records and encryption methods. IBM Blockchain for Aerospace, VeChain Aerospace Blockchain
Traceability Provides detailed tracking of materials, components, and parts throughout the supply chain. Blockchain in Aerospace Traceability System, Aeron Blockchain
Smart Contracts Automates agreements and processes without intermediaries, ensuring efficiency and compliance. Accenture Aerospace Smart Contracts, AEROSPACECHAIN
Cost Efficiency Reduces costs by eliminating middlemen and automating processes such as payments and record-keeping. LedgerX Blockchain Solutions, FULCRUM Blockchain
Supply Chain Optimization Enhances transparency and efficiency in tracking and verifying components in the aerospace supply chain. Boeing’s Blockchain Pilot, Honeywell Blockchain System
Data Integrity Provides consistent and verified data in a decentralized ledger that prevents fraud or tampering. AWS Blockchain for Aerospace, Lockheed Martin Blockchain
Operational Efficiency Streamlines operational processes with blockchain-enabled systems to reduce downtime and improve response time. T-Systems Aerospace Blockchain, Airbus Blockchain Integration
Regulatory Compliance Facilitates adherence to industry regulations by recording every transaction and change in real-time. Arianespace Blockchain System, Siemens Aerospace Blockchain
Interoperability Ensures smooth integration between various platforms and technologies used in aerospace operations. SAP Blockchain Integration, IBM Aerospace Blockchain
Transparency Provides a transparent system for all stakeholders to view records and transactions in real time. ConsenSys Blockchain for Aerospace, CloudSigma Aerospace Blockchain

MARKET DYNAMICS

DRIVERS

  • The growing global energy demand, especially in emerging economies, is driving the need for advanced pressure pumping services to efficiently extract oil and natural gas from unconventional reserves.

The rising demand for oil and gas, driven by increasing global energy consumption, is a key factor fueling the growth of the Pressure Pumping Market. As emerging economies like China, India, and others continue to industrialize, their energy needs are expanding rapidly, creating a significant demand for oil and gas. This demand is pushing exploration activities deeper into more complex and unconventional reserves, such as shale oil, tight oil, and deepwater fields. To extract these resources efficiently, advanced pressure pumping techniques, including hydraulic fracturing, are required. Pressure pumping services are essential in enhancing well productivity by injecting fluids at high pressure to fracture rock formations and stimulate production. This need for efficient extraction methods is more pronounced as conventional oil reserves deplete, pushing operators to seek innovative solutions for tapping into harder-to-reach resources. The International Energy Agency (IEA) has projected that global oil and gas consumption will continue to rise, especially in non-OECD countries, reinforcing the need for pressure pumping services. This ongoing shift towards more challenging extraction sites, coupled with the growing energy demand, directly correlates with the increasing use of pressure pumping technologies to maximize resource recovery and meet global energy needs.

  • Technological advancements in hydraulic fracturing and horizontal drilling have boosted the demand for pressure pumping services by enabling efficient extraction from previously inaccessible oil and gas reserves.

Technological advancements in hydraulic fracturing (fracking) and horizontal drilling have played a pivotal role in the growth of the pressure pumping market. The development of these technologies has revolutionized the oil and gas industry by unlocking previously inaccessible reserves, especially in shale formations and deepwater fields. Hydraulic fracturing, combined with horizontal drilling, allows for more efficient extraction of oil and gas from unconventional resources, which requires high-pressure pumping systems to inject fluids into wells. This has significantly increased the demand for pressure pumping services, as they are essential for optimizing well productivity and ensuring efficient resource recovery. Fracking technology enables the extraction of natural gas and oil from tight rock formations, which was once considered economically unfeasible. In the U.S. the production of shale oil has surged, leading to an increase in pressure pumping activities. With improvements in fracking techniques such as multi-stage hydraulic fracturing, the efficiency of resource extraction has dramatically improved, thereby propelling the demand for specialized pressure pumping equipment. Furthermore, these advancements have allowed for the extension of well life and higher recovery rates, ensuring sustained production from mature fields, thus strengthening the need for ongoing pressure pumping services. The trend is expected to continue as exploration in unconventional fields expands.

RESTRAIN

  • High operational costs, including significant investments in equipment, maintenance, and fuel, pose a barrier for smaller players and challenge operators in optimizing their cost structure in the pressure-pumping market.

High operational costs are a major factor influencing the growth of the pressure pumping market. Pressure pumping operations require substantial investments in specialized equipment, such as high-pressure pumps, blenders, and fluid mixing systems, along with ongoing maintenance to ensure reliability and efficiency. This initial capital expenditure, along with the ongoing costs of fuel, labor, and transportation, can be particularly challenging for smaller companies with limited financial resources. In fact, maintaining a fleet of pressure-pumping equipment can account for a significant portion of an operator’s budget, with costs for maintenance, repairs, and parts often reaching millions of dollars annually. These high costs can limit market entry for smaller players and create a competitive advantage for larger companies that can better absorb these financial burdens. Moreover, operational costs related to the handling and disposal of fracturing fluids and water management further add to the overall expense, particularly in environmentally sensitive areas where regulations are strict. As pressure pumping is critical for unconventional oil and gas extraction, managing these costs becomes crucial for profitability. Operators are thus under constant pressure to innovate and find more cost-effective solutions to improve efficiency, reduce downtime, and lower the total cost per well to remain competitive in the market.

KEY SEGMENTATION

By Service Type

The Hydraulic Fracturing segment dominated with the market share over 48% in 2023, driven by its critical role in oil and gas extraction from unconventional sources, particularly shale formations. Hydraulic fracturing, or fracking, involves injecting pressurized fluid into deep rock formations to create fractures, allowing oil and natural gas to flow more freely from the reservoir to the wellbore. This technique has revolutionized the energy industry, particularly in regions like North America, where shale gas and oil production has surged. As a result, hydraulic fracturing requires specialized pressure pumping equipment and services to manage the high-pressure fluid injection necessary for effective extraction. The growth of hydraulic fracturing is supported by increasing global energy demand and technological advancements that have improved the efficiency and safety of fracking operations.

By Well Type

Horizontal wells segment dominated with the market share of over 52% in 2023, particularly in shale gas and oil exploration. These wells are designed to access larger portions of the reservoir compared to vertical wells, significantly enhancing production rates. The ability to drill horizontally allows operators to tap into reservoirs that are otherwise difficult to reach with traditional methods. Horizontal wells offer a more efficient recovery method, maximizing output from a single wellbore. Although the initial drilling costs for horizontal wells can be higher, they are often more cost-effective over time due to their higher production capabilities. This combination of enhanced recovery and cost efficiency makes horizontal wells the preferred choice in modern exploration and production activities.

KEY REGIONAL ANALYSIS

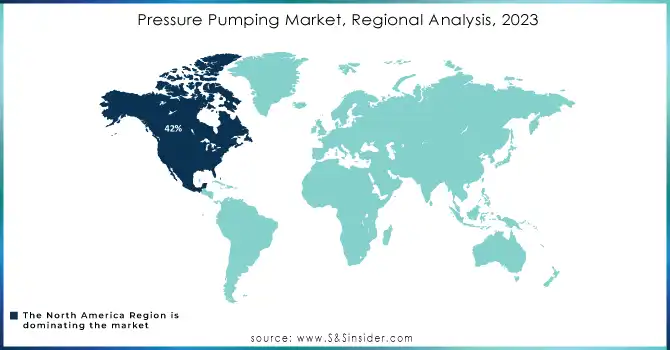
In 2023, North America region dominated with the market share over 42% in 2023, primarily driven by abundant shale formations and significant reserves of oil and natural gas, especially in the United States. Hydraulic fracturing (fracking) has become a crucial method for extracting resources from major shale basins, fueling ongoing demand for pressure pumping services to improve extraction efficiency. Furthermore, partnerships and collaborations within the industry have played a key role in improving operational effectiveness, facilitating the sharing of resources, and driving technological advancements. These factors have contributed to North America's strong market presence and sustained growth in the pressure pumping sector.

Asia-Pacific has become the fastest-growing region in the pressure pumping market, driven by rapid industrialization and urbanization, particularly in China, India, and Southeast Asia. As energy consumption in these countries increases, there has been a surge in investments aimed at expanding oil and gas infrastructure. These investments often come with technology transfers, improving local capabilities and increasing the demand for pressure pumping services. The growing energy sector, coupled with continued infrastructure development, is creating a robust market for pressure pumping services in the region. As Asia-Pacific transitions to greater energy security and seeks to explore unconventional oil and gas reserves, demand for advanced extraction technologies, including pressure pumping, is expected to rise significantly in the forecast period.

Pressure-Pumping-Market-Regional-Analysis-2023

Do You Need any Customization Research on Pressure Pumping Market - Inquire Now

Key Players

  • Baker Hughes (Hydraulic fracturing pumps, cementing pumps, coiled tubing pumps)

  • Schlumberger Limited (Frac pump units, Well stimulation equipment)

  • Halliburton (Frac pumps, cementing systems, acidizing equipment)

  • C&J Energy Services, Inc. (Pressure pumping services, hydraulic fracturing, cementing solutions)

  • Calfrac Energy Services Ltd. (Hydraulic fracturing, acidizing pumps)

  • Trican Well Service Ltd. (Pressure pumping, cementing equipment, acidizing systems)

  • Superior Energy Services, Inc. (Frac equipment, cementing services)

  • Liberty Oilfield Services (Hydraulic fracturing fleets, pressure pumping)

  • Nabors Industries Ltd. (Well services, pressure pumping)

  • ProPetro Holding Corp. (Frac services, cementing services)

  • Weatherford International (Cementing and stimulation services)

  • Nextier Oilfield Solutions (Hydraulic fracturing, wireline services)

  • National Oilwell Varco (NOV) (Frac pumps, pressure pumping units)

  • FTSI (Frac Tech Services International) (Hydraulic fracturing services)

  • Step Energy Services (Pressure pumping, coil tubing solutions)

  • RPC, Inc. (Acidizing, cementing, and hydraulic fracturing)

  • Weir Group (High-pressure frac pumps, flow control equipment)

  • BJ Energy Solutions (Frac fleets, natural gas-powered frac equipment)

  • GOES GmbH (Cementing and frac equipment)

  • Keane Group (Hydraulic fracturing, cementing services)

Suppliers for Renowned for high-pressure pumps and fluid management systems of Pressure Pumping Market

  • Gardner Denver Holdings, Inc.

  • Weir Group PLC

  • National Oilwell Varco (NOV)

  • GE Oil & Gas

  • Caterpillar Inc.

  • Flowserve Corporation

  • Aker Solutions

  • TechnipFMC

  • Forum Energy Technologies

  • SPX FLOW, Inc.

RECENT DEVELOPMENTS

  • In November 2024: Roto Pumps Ltd. unveiled its latest innovation, the Roto Cake Pumps, at IFAT 2024, held from October 16-18 at the Bombay Exhibition Centre, Mumbai. This launch highlights the company's commitment to high-efficiency solutions for the wastewater industry.

  • In April 2024: Xylem launched the Jabsco PureFlo 21 single-use pump, a revolutionary solution for the biotechnology and pharmaceutical industries. This pump introduces an adjustable, integrated pressure release valve—marking a first in single-use pumping technology enhancing operator safety and minimizing the risk of fluid contamination.

  • In October 2023: Watson-Marlow Fluid Technology Solutions (WMFTS) unveiled the versatile Bredel NR Transfer hose, expanding its range of hoses for Bredel hose pumps. Designed for general fluid transfer applications at pressures up to 12 bar (174 psi), the hose efficiently handles food and beverage waste, abrasive slurries, and high-solid-content sludge. This addition complements the existing Bredel NR Metering hose, which is engineered for more demanding tasks with a pressure capacity of up to 16 bar (232 psi).

Pressure Pumping Market Report Scope:

Report Attributes Details
Market Size in 2023 USD 69.67 billion 
Market Size by 2032 USD 110.76 billion 
CAGR CAGR of 5.29%  From 2024 to 2032
Base Year 2023
Forecast Period 2024-2032
Historical Data 2020-2022
Report Scope & Coverage Market Size, Segments Analysis, Competitive  Landscape, Regional Analysis, DROC & SWOT Analysis, Forecast Outlook
Key Segments • By Service Type (Hydraulic Fracturing, Cementing, Others)
• By Resource Type (Conventional, Unconventional)
• By Well Type (Horizontal, Vertical, Directional)
Regional Analysis/Coverage North America (US, Canada, Mexico), Europe (Eastern Europe [Poland, Romania, Hungary, Turkey, Rest of Eastern Europe] Western Europe] Germany, France, UK, Italy, Spain, Netherlands, Switzerland, Austria, Rest of Western Europe]), Asia Pacific (China, India, Japan, South Korea, Vietnam, Singapore, Australia, Rest of Asia Pacific), Middle East & Africa (Middle East [UAE, Egypt, Saudi Arabia, Qatar, Rest of Middle East], Africa [Nigeria, South Africa, Rest of Africa], Latin America (Brazil, Argentina, Colombia, Rest of Latin America)
Company Profiles Baker Hughes, Schlumberger Limited, Halliburton, C&J Energy Services, Inc., Calfrac Energy Services Ltd., Trican Well Service Ltd., Superior Energy Services, Inc., Liberty Oilfield Services, Nabors Industries Ltd., ProPetro Holding Corp., Weatherford International, Nextier Oilfield Solutions, National Oilwell Varco (NOV), FTSI (Frac Tech Services International), Step Energy Services, RPC, Inc., Weir Group, BJ Energy Solutions, GOES GmbH, Keane Group.
Key Drivers • The growing global energy demand, especially in emerging economies, is driving the need for advanced pressure pumping services to efficiently extract oil and natural gas from unconventional reserves.
• Technological advancements in hydraulic fracturing and horizontal drilling have boosted the demand for pressure pumping services by enabling efficient extraction from previously inaccessible oil and gas reserves.
RESTRAINTS • High operational costs, including significant investments in equipment, maintenance, and fuel, pose a barrier for smaller players and challenge operators in optimizing their cost structure in the pressure pumping market.

Frequently Asked Questions

Ans:  The Pressure Pumping Market is expected to grow at a CAGR of 5.29% during 2024-2032.

Ans: The Pressure Pumping Market size is expected to Reach USD 110.76 billion by 2032.

Ans: The growing global energy demand, especially in emerging economies, is driving the need for advanced pressure pumping services to efficiently extract oil and natural gas from unconventional reserves.

Ans: The “Hydraulic Fracturing” segment dominated the Pressure Pumping Market.

Ans: North America dominated the Pressure Pumping Market in 2023.

TABLE OF CONTENTS

1. Introduction

1.1 Market Definition

1.2 Scope (Inclusion and Exclusions)

1.3 Research Assumptions

2. Executive Summary

2.1 Market Overview

2.2 Regional Synopsis

2.3 Competitive Summary

3. Research Methodology

3.1 Top-Down Approach

3.2 Bottom-up Approach

3.3. Data Validation

3.4 Primary Interviews

4. Market Dynamics

4.1 Market Analysis

4.1.1 Drivers

4.1.2 Restraints

4.1.3 Opportunities

4.1.4 Challenges

4.2 PESTLE Analysis

4.3 Porter’s Five Forces Model

5. Statistical Insights and Trends Reporting

5.1 Manufacturing Output, by Region, (2020-2023)

5.2 Utilization Rates, by Region, (2020-2023)

5.3 Maintenance and Downtime Metrix

5.4 Technological Adoption Rates, by Region

5.5 Export/Import Data, by Region (2023)

6. Competitive Landscape

6.1 List of Major Companies, By Region

6.2 Market Share Analysis, By Region

6.3 Product Benchmarking

6.3.1 Product specifications and features

6.3.2 Pricing

6.4 Strategic Initiatives

6.4.1 Marketing and promotional activities

6.4.2 Distribution and Supply Chain Strategies

6.4.3 Expansion plans and new product launches

6.4.4 Strategic partnerships and collaborations

6.5 Technological Advancements

6.6 Market Positioning and Branding

7. Pressure Pumping Market Segmentation, By Service Type

7.1 Chapter Overview

7.2 Hydraulic Fracturing

7.1 Hydraulic Fracturing Market Trends Analysis (2020-2032)

7.2 Hydraulic Fracturing Market Size Estimates and Forecasts to 2032 (USD Billion)

7.3 Cementing

7.3.1 Cementing Market Trends Analysis (2020-2032)

7.3.2 Cementing Market Size Estimates and Forecasts to 2032 (USD Billion)

7.4 Others

7.3.3.1 Others Market Trends Analysis (2020-2032)

7.3.3.2 Others Market Size Estimates and Forecasts to 2032 (USD Billion)

8. Pressure Pumping Market Segmentation, By Resource Type

8.1 Chapter Overview

8.2 Conventional

8.2.1 Conventional Market Trends Analysis (2020-2032)

8.2.2 Conventional Market Size Estimates and Forecasts to 2032 (USD Billion)

8.3 Unconventional

             8.3.1 Unconventional Market Trends Analysis (2020-2032)

8.3.2 Unconventional Market Size Estimates and Forecasts to 2032 (USD Billion)

9. Pressure Pumping Market Segmentation, By Well Type

9.1 Chapter Overview

9.2 Horizontal

9.2.1 Horizontal Market Trends Analysis (2020-2032)

9.2.2 Horizontal Market Size Estimates and Forecasts to 2032 (USD Billion)

9.3 Vertical

9.3.1 Vertical Market Trends Analysis (2020-2032)

9.3.2 Vertical Market Size Estimates and Forecasts to 2032 (USD Billion)

9.4 Directional

             9.4.1 Directional Market Trends Analysis (2020-2032)

9.4.2 Directional Market Size Estimates and Forecasts to 2032 (USD Billion)

10. Regional Analysis

10.1 Chapter Overview

10.2 North America

10.2.1 Trends Analysis

10.2.2 North America Pressure Pumping Market Estimates and Forecasts, by Country (2020-2032) (USD Billion)

10.2.3 North America Pressure Pumping Market Estimates and Forecasts, By Service Type (2020-2032) (USD Billion) 

10.2.4 North America Pressure Pumping Market Estimates and Forecasts, By Resource Type (2020-2032) (USD Billion)

10.2.5 North America Pressure Pumping Market Estimates and Forecasts, By Well Type (2020-2032) (USD Billion)

10.2.6 USA

10.2.6.1 USA Pressure Pumping Market Estimates and Forecasts, By Service Type (2020-2032) (USD Billion)

10.2.6.2 USA Pressure Pumping Market Estimates and Forecasts, By Resource Type (2020-2032) (USD Billion)

10.2.6.3 USA Pressure Pumping Market Estimates and Forecasts, By Well Type (2020-2032) (USD Billion)

10.2.7 Canada

10.2.7.1 Canada Pressure Pumping Market Estimates and Forecasts, By Service Type (2020-2032) (USD Billion)

10.2.7.2 Canada Pressure Pumping Market Estimates and Forecasts, By Resource Type (2020-2032) (USD Billion)

10.2.7.3 Canada Pressure Pumping Market Estimates and Forecasts, By Well Type (2020-2032) (USD Billion)

10.2.8 Mexico

10.2.8.1 Mexico Pressure Pumping Market Estimates and Forecasts, By Service Type (2020-2032) (USD Billion)

10.2.8.2 Mexico Pressure Pumping Market Estimates and Forecasts, By Resource Type (2020-2032) (USD Billion)

10.2.8.3 Mexico Pressure Pumping Market Estimates and Forecasts, By Well Type (2020-2032) (USD Billion)

10.3 Europe

10.3.1 Eastern Europe

10.3.1.1 Trends Analysis

10.3.1.2 Eastern Europe Pressure Pumping Market Estimates and Forecasts, by Country (2020-2032) (USD Billion)

10.3.1.3 Eastern Europe Pressure Pumping Market Estimates and Forecasts, By Service Type (2020-2032) (USD Billion) 

10.3.1.4 Eastern Europe Pressure Pumping Market Estimates and Forecasts, By Resource Type (2020-2032) (USD Billion)

10.3.1.5 Eastern Europe Pressure Pumping Market Estimates and Forecasts, By Well Type (2020-2032) (USD Billion)

10.3.1.6 Poland

10.3.1.6.1 Poland Pressure Pumping Market Estimates and Forecasts, By Service Type (2020-2032) (USD Billion)

10.3.1.6.2 Poland Pressure Pumping Market Estimates and Forecasts, By Resource Type (2020-2032) (USD Billion)

10.3.1.6.3 Poland Pressure Pumping Market Estimates and Forecasts, By Well Type (2020-2032) (USD Billion)

10.3.1.7 Romania

10.3.1.7.1 Romania Pressure Pumping Market Estimates and Forecasts, By Service Type (2020-2032) (USD Billion)

10.3.1.7.2 Romania Pressure Pumping Market Estimates and Forecasts, By Resource Type (2020-2032) (USD Billion)

10.3.1.7.3 Romania Pressure Pumping Market Estimates and Forecasts, By Well Type (2020-2032) (USD Billion)

10.3.1.8 Hungary

10.3.1.8.1 Hungary Pressure Pumping Market Estimates and Forecasts, By Service Type (2020-2032) (USD Billion)

10.3.1.8.2 Hungary Pressure Pumping Market Estimates and Forecasts, By Resource Type (2020-2032) (USD Billion)

10.3.1.8.3 Hungary Pressure Pumping Market Estimates and Forecasts, By Well Type (2020-2032) (USD Billion)

10.3.1.9 Turkey

10.3.1.9.1 Turkey Pressure Pumping Market Estimates and Forecasts, By Service Type (2020-2032) (USD Billion)

10.3.1.9.2 Turkey Pressure Pumping Market Estimates and Forecasts, By Resource Type (2020-2032) (USD Billion)

10.3.1.9.3 Turkey Pressure Pumping Market Estimates and Forecasts, By Well Type (2020-2032) (USD Billion)

10.3.1.10 Rest of Eastern Europe

10.3.1.10.1 Rest of Eastern Europe Pressure Pumping Market Estimates and Forecasts, By Service Type (2020-2032) (USD Billion)

10.3.1.10.2 Rest of Eastern Europe Pressure Pumping Market Estimates and Forecasts, By Resource Type (2020-2032) (USD Billion)

10.3.1.10.3 Rest of Eastern Europe Pressure Pumping Market Estimates and Forecasts, By Well Type (2020-2032) (USD Billion)

10.3.2 Western Europe

10.3.2.1 Trends Analysis

10.3.2.2 Western Europe Pressure Pumping Market Estimates and Forecasts, by Country (2020-2032) (USD Billion)

10.3.2.3 Western Europe Pressure Pumping Market Estimates and Forecasts, By Service Type (2020-2032) (USD Billion) 

10.3.2.4 Western Europe Pressure Pumping Market Estimates and Forecasts, By Resource Type (2020-2032) (USD Billion)

10.3.2.5 Western Europe Pressure Pumping Market Estimates and Forecasts, By Well Type (2020-2032) (USD Billion)

10.3.2.6 Germany

10.3.2.6.1 Germany Pressure Pumping Market Estimates and Forecasts, By Service Type (2020-2032) (USD Billion)

10.3.2.6.2 Germany Pressure Pumping Market Estimates and Forecasts, By Resource Type (2020-2032) (USD Billion)

10.3.2.6.3 Germany Pressure Pumping Market Estimates and Forecasts, By Well Type (2020-2032) (USD Billion)

10.3.2.7 France

10.3.2.7.1 France Pressure Pumping Market Estimates and Forecasts, By Service Type (2020-2032) (USD Billion)

10.3.2.7.2 France Pressure Pumping Market Estimates and Forecasts, By Resource Type (2020-2032) (USD Billion)

10.3.2.7.3 France Pressure Pumping Market Estimates and Forecasts, By Well Type (2020-2032) (USD Billion)

10.3.2.8 UK

10.3.2.8.1 UK Pressure Pumping Market Estimates and Forecasts, By Service Type (2020-2032) (USD Billion)

10.3.2.8.2 UK Pressure Pumping Market Estimates and Forecasts, By Resource Type (2020-2032) (USD Billion)

10.3.2.8.3 UK Pressure Pumping Market Estimates and Forecasts, By Well Type (2020-2032) (USD Billion)

10.3.2.9 Italy

10.3.2.9.1 Italy Pressure Pumping Market Estimates and Forecasts, By Service Type (2020-2032) (USD Billion)

10.3.2.9.2 Italy Pressure Pumping Market Estimates and Forecasts, By Resource Type (2020-2032) (USD Billion)

10.3.2.9.3 Italy Pressure Pumping Market Estimates and Forecasts, By Well Type (2020-2032) (USD Billion)

10.3.2.10 Spain

10.3.2.10.1 Spain Pressure Pumping Market Estimates and Forecasts, By Service Type (2020-2032) (USD Billion)

10.3.2.10.2 Spain Pressure Pumping Market Estimates and Forecasts, By Resource Type (2020-2032) (USD Billion)

10.3.2.10.3 Spain Pressure Pumping Market Estimates and Forecasts, By Well Type (2020-2032) (USD Billion)

10.3.2.11 Netherlands

10.3.2.11.1 Netherlands Pressure Pumping Market Estimates and Forecasts, By Service Type (2020-2032) (USD Billion)

10.3.2.11.2 Netherlands Pressure Pumping Market Estimates and Forecasts, By Resource Type (2020-2032) (USD Billion)

10.3.2.11.3 Netherlands Pressure Pumping Market Estimates and Forecasts, By Well Type (2020-2032) (USD Billion)

10.3.2.12 Switzerland

10.3.2.12.1 Switzerland Pressure Pumping Market Estimates and Forecasts, By Service Type (2020-2032) (USD Billion)

10.3.2.12.2 Switzerland Pressure Pumping Market Estimates and Forecasts, By Resource Type (2020-2032) (USD Billion)

10.3.2.12.3 Switzerland Pressure Pumping Market Estimates and Forecasts, By Well Type (2020-2032) (USD Billion)

10.3.2.13 Austria

10.3.2.13.1 Austria Pressure Pumping Market Estimates and Forecasts, By Service Type (2020-2032) (USD Billion)

10.3.2.13.2 Austria Pressure Pumping Market Estimates and Forecasts, By Resource Type (2020-2032) (USD Billion)

10.3.2.13.3 Austria Pressure Pumping Market Estimates and Forecasts, By Well Type (2020-2032) (USD Billion)

10.3.2.14 Rest of Western Europe

10.3.2.14.1 Rest of Western Europe Pressure Pumping Market Estimates and Forecasts, By Service Type (2020-2032) (USD Billion)

10.3.2.14.2 Rest of Western Europe Pressure Pumping Market Estimates and Forecasts, By Resource Type (2020-2032) (USD Billion)

10.3.2.14.3 Rest of Western Europe Pressure Pumping Market Estimates and Forecasts, By Well Type (2020-2032) (USD Billion)

10.4 Asia-Pacific

10.4.1 Trends Analysis

10.4.2 Asia-Pacific Pressure Pumping Market Estimates and Forecasts, by Country (2020-2032) (USD Billion)

10.4.3 Asia-Pacific Pressure Pumping Market Estimates and Forecasts, By Service Type (2020-2032) (USD Billion) 

10.4.4 Asia-Pacific Pressure Pumping Market Estimates and Forecasts, By Resource Type (2020-2032) (USD Billion)

10.4.5 Asia-Pacific Pressure Pumping Market Estimates and Forecasts, By Well Type (2020-2032) (USD Billion)

10.4.6 China

10.4.6.1 China Pressure Pumping Market Estimates and Forecasts, By Service Type (2020-2032) (USD Billion)

10.4.6.2 China Pressure Pumping Market Estimates and Forecasts, By Resource Type (2020-2032) (USD Billion)

10.4.6.3 China Pressure Pumping Market Estimates and Forecasts, By Well Type (2020-2032) (USD Billion)

10.4.7 India

10.4.7.1 India Pressure Pumping Market Estimates and Forecasts, By Service Type (2020-2032) (USD Billion)

10.4.7.2 India Pressure Pumping Market Estimates and Forecasts, By Resource Type (2020-2032) (USD Billion)

10.4.7.3 India Pressure Pumping Market Estimates and Forecasts, By Well Type (2020-2032) (USD Billion)

10.4.8 Japan

10.4.8.1 Japan Pressure Pumping Market Estimates and Forecasts, By Service Type (2020-2032) (USD Billion)

10.4.8.2 Japan Pressure Pumping Market Estimates and Forecasts, By Resource Type (2020-2032) (USD Billion)

10.4.8.3 Japan Pressure Pumping Market Estimates and Forecasts, By Well Type (2020-2032) (USD Billion)

10.4.9 South Korea

10.4.9.1 South Korea Pressure Pumping Market Estimates and Forecasts, By Service Type (2020-2032) (USD Billion)

10.4.9.2 South Korea Pressure Pumping Market Estimates and Forecasts, By Resource Type (2020-2032) (USD Billion)

10.4.9.3 South Korea Pressure Pumping Market Estimates and Forecasts, By Well Type (2020-2032) (USD Billion)

10.4.10 Vietnam

10.4.10.1 Vietnam Pressure Pumping Market Estimates and Forecasts, By Service Type (2020-2032) (USD Billion)

10.4.10.2 Vietnam Pressure Pumping Market Estimates and Forecasts, By Resource Type (2020-2032) (USD Billion)

10.4.10.3 Vietnam Pressure Pumping Market Estimates and Forecasts, By Well Type (2020-2032) (USD Billion)

10.4.11 Singapore

10.4.11.1 Singapore Pressure Pumping Market Estimates and Forecasts, By Service Type (2020-2032) (USD Billion)

10.4.11.2 Singapore Pressure Pumping Market Estimates and Forecasts, By Resource Type (2020-2032) (USD Billion)

10.4.11.3 Singapore Pressure Pumping Market Estimates and Forecasts, By Well Type (2020-2032) (USD Billion)

10.4.12 Australia

10.4.12.1 Australia Pressure Pumping Market Estimates and Forecasts, By Service Type (2020-2032) (USD Billion)

10.4.12.2 Australia Pressure Pumping Market Estimates and Forecasts, By Resource Type (2020-2032) (USD Billion)

10.4.12.3 Australia Pressure Pumping Market Estimates and Forecasts, By Well Type (2020-2032) (USD Billion)

10.4.13 Rest of Asia-Pacific

10.4.13.1 Rest of Asia-Pacific Pressure Pumping Market Estimates and Forecasts, By Service Type (2020-2032) (USD Billion)

10.4.13.2 Rest of Asia-Pacific Pressure Pumping Market Estimates and Forecasts, By Resource Type (2020-2032) (USD Billion)

10.4.13.3 Rest of Asia-Pacific Pressure Pumping Market Estimates and Forecasts, By Well Type (2020-2032) (USD Billion)

10.5 Middle East and Africa

10.5.1 Middle East

10.5.1.1 Trends Analysis

10.5.1.2 Middle East Pressure Pumping Market Estimates and Forecasts, by Country (2020-2032) (USD Billion)

10.5.1.3 Middle East Pressure Pumping Market Estimates and Forecasts, By Service Type (2020-2032) (USD Billion) 

10.5.1.4 Middle East Pressure Pumping Market Estimates and Forecasts, By Resource Type (2020-2032) (USD Billion)

10.5.1.5 Middle East Pressure Pumping Market Estimates and Forecasts, By Well Type (2020-2032) (USD Billion)

10.5.1.6 UAE

10.5.1.6.1 UAE Pressure Pumping Market Estimates and Forecasts, By Service Type (2020-2032) (USD Billion)

10.5.1.6.2 UAE Pressure Pumping Market Estimates and Forecasts, By Resource Type (2020-2032) (USD Billion)

10.5.1.6.3 UAE Pressure Pumping Market Estimates and Forecasts, By Well Type (2020-2032) (USD Billion)

10.5.1.7 Egypt

10.5.1.7.1 Egypt Pressure Pumping Market Estimates and Forecasts, By Service Type (2020-2032) (USD Billion)

10.5.1.7.2 Egypt Pressure Pumping Market Estimates and Forecasts, By Resource Type (2020-2032) (USD Billion)

10.5.1.7.3 Egypt Pressure Pumping Market Estimates and Forecasts, By Well Type (2020-2032) (USD Billion)

10.5.1.8 Saudi Arabia

10.5.1.8.1 Saudi Arabia Pressure Pumping Market Estimates and Forecasts, By Service Type (2020-2032) (USD Billion)

10.5.1.8.2 Saudi Arabia Pressure Pumping Market Estimates and Forecasts, By Resource Type (2020-2032) (USD Billion)

10.5.1.8.3 Saudi Arabia Pressure Pumping Market Estimates and Forecasts, By Well Type (2020-2032) (USD Billion)

10.5.1.9 Qatar

10.5.1.9.1 Qatar Pressure Pumping Market Estimates and Forecasts, By Service Type (2020-2032) (USD Billion)

10.5.1.9.2 Qatar Pressure Pumping Market Estimates and Forecasts, By Resource Type (2020-2032) (USD Billion)

10.5.1.9.3 Qatar Pressure Pumping Market Estimates and Forecasts, By Well Type (2020-2032) (USD Billion)

10.5.1.10 Rest of Middle East

10.5.1.10.1 Rest of Middle East Pressure Pumping Market Estimates and Forecasts, By Service Type (2020-2032) (USD Billion)

10.5.1.10.2 Rest of Middle East Pressure Pumping Market Estimates and Forecasts, By Resource Type (2020-2032) (USD Billion)

10.5.1.10.3 Rest of Middle East Pressure Pumping Market Estimates and Forecasts, By Well Type (2020-2032) (USD Billion)

10.5.2 Africa

10.5.2.1 Trends Analysis

10.5.2.2 Africa Pressure Pumping Market Estimates and Forecasts, by Country (2020-2032) (USD Billion)

10.5.2.3 Africa Pressure Pumping Market Estimates and Forecasts, By Service Type (2020-2032) (USD Billion) 

10.5.2.4 Africa Pressure Pumping Market Estimates and Forecasts, By Resource Type (2020-2032) (USD Billion)

10.5.2.5 Africa Pressure Pumping Market Estimates and Forecasts, By Well Type (2020-2032) (USD Billion)

10.5.2.6 South Africa

10.5.2.6.1 South Africa Pressure Pumping Market Estimates and Forecasts, By Service Type (2020-2032) (USD Billion)

10.5.2.6.2 South Africa Pressure Pumping Market Estimates and Forecasts, By Resource Type (2020-2032) (USD Billion)

10.5.2.6.3 South Africa Pressure Pumping Market Estimates and Forecasts, By Well Type (2020-2032) (USD Billion)

10.5.2.7 Nigeria

10.5.2.7.1 Nigeria Pressure Pumping Market Estimates and Forecasts, By Service Type (2020-2032) (USD Billion)

10.5.2.7.2 Nigeria Pressure Pumping Market Estimates and Forecasts, By Resource Type (2020-2032) (USD Billion)

10.5.2.7.3 Nigeria Pressure Pumping Market Estimates and Forecasts, By Well Type (2020-2032) (USD Billion)

10.5.2.8 Rest of Africa

10.5.2.8.1 Rest of Africa Pressure Pumping Market Estimates and Forecasts, By Service Type (2020-2032) (USD Billion)

10.5.2.8.2 Rest of Africa Pressure Pumping Market Estimates and Forecasts, By Resource Type (2020-2032) (USD Billion)

10.5.2.8.3 Rest of Africa Pressure Pumping Market Estimates and Forecasts, By Well Type (2020-2032) (USD Billion)

10.6 Latin America

10.6.1 Trends Analysis

10.6.2 Latin America Pressure Pumping Market Estimates and Forecasts, by Country (2020-2032) (USD Billion)

10.6.3 Latin America Pressure Pumping Market Estimates and Forecasts, By Service Type (2020-2032) (USD Billion) 

10.6.4 Latin America Pressure Pumping Market Estimates and Forecasts, By Resource Type (2020-2032) (USD Billion)

10.6.5 Latin America Pressure Pumping Market Estimates and Forecasts, By Well Type (2020-2032) (USD Billion)

10.6.6 Brazil

10.6.6.1 Brazil Pressure Pumping Market Estimates and Forecasts, By Service Type (2020-2032) (USD Billion)

10.6.6.2 Brazil Pressure Pumping Market Estimates and Forecasts, By Resource Type (2020-2032) (USD Billion)

10.6.6.3 Brazil Pressure Pumping Market Estimates and Forecasts, By Well Type (2020-2032) (USD Billion)

10.6.7 Argentina

10.6.7.1 Argentina Pressure Pumping Market Estimates and Forecasts, By Service Type (2020-2032) (USD Billion)

10.6.7.2 Argentina Pressure Pumping Market Estimates and Forecasts, By Resource Type (2020-2032) (USD Billion)

10.6.7.3 Argentina Pressure Pumping Market Estimates and Forecasts, By Well Type (2020-2032) (USD Billion)

10.6.8 Colombia

10.6.8.1 Colombia Pressure Pumping Market Estimates and Forecasts, By Service Type (2020-2032) (USD Billion)

10.6.8.2 Colombia Pressure Pumping Market Estimates and Forecasts, By Resource Type (2020-2032) (USD Billion)

10.6.8.3 Colombia Pressure Pumping Market Estimates and Forecasts, By Well Type (2020-2032) (USD Billion)

10.6.9 Rest of Latin America

10.6.9.1 Rest of Latin America Pressure Pumping Market Estimates and Forecasts, By Service Type (2020-2032) (USD Billion)

10.6.9.2 Rest of Latin America Pressure Pumping Market Estimates and Forecasts, By Resource Type (2020-2032) (USD Billion)

10.6.9.3 Rest of Latin America Pressure Pumping Market Estimates and Forecasts, By Well Type (2020-2032) (USD Billion)

11. Company Profiles

11.1 Baker Hughes

11.1.1 Company Overview

11.1.2 Financial

11.1.3 Products/ Services Offered

11.1.4 SWOT Analysis

11.2 Schlumberger Limited

             11.2.1 Company Overview

11.2.2 Financial

11.2.3 Products/ Services Offered

11.2.4 SWOT Analysis

11.3 Halliburton

11.3.1 Company Overview

11.3.2 Financial

11.3.3 Products/ Services Offered

11.3.4 SWOT Analysis

11.4 C&J Energy Services, Inc.

11.4.1 Company Overview

11.4.2 Financial

11.4.3 Products/ Services Offered

11.4.4 SWOT Analysis

11.5 Calfrac Energy Services Ltd.

11.5.1 Company Overview

11.5.2 Financial

11.5.3 Products/ Services Offered

11.5.4 SWOT Analysis

11.6 Trican

11.6.1 Company Overview

11.6.2 Financial

11.6.3 Products/ Services Offered

11.6.4 SWOT Analysis

11.7 Weatherford International

             11.7.1 Company Overview

11.7.2 Financial

11.7.3 Products/ Services Offered

11.7.4 SWOT Analysis

11.8 Keane Group

11.8.1 Company Overview

11.8.2 Financial

11.8.3 Products/ Services Offered

11.8.4 SWOT Analysis

11.9 FTS International

             11.9.1 Company Overview

11.9.2 Financial

11.9.3 Products/ Services Offered

11.9.4 SWOT Analysis

11.10 Pro Petro Holding Corp

11.10.1 Company Overview

11.10.2 Financial

11.10.3 Products/ Services Offered

11.10.4 SWOT Analysis

12. Use Cases and Best Practices

13. Conclusion

An accurate research report requires proper strategizing as well as implementation. There are multiple factors involved in the completion of good and accurate research report and selecting the best methodology to compete the research is the toughest part. Since the research reports we provide play a crucial role in any company’s decision-making process, therefore we at SNS Insider always believe that we should choose the best method which gives us results closer to reality. This allows us to reach at a stage wherein we can provide our clients best and accurate investment to output ratio.

Each report that we prepare takes a timeframe of 350-400 business hours for production. Starting from the selection of titles through a couple of in-depth brain storming session to the final QC process before uploading our titles on our website we dedicate around 350 working hours. The titles are selected based on their current market cap and the foreseen CAGR and growth.


The 5 steps process:

Step 1: Secondary Research:

Secondary Research or Desk Research is as the name suggests is a research process wherein, we collect data through the readily available information. In this process we use various paid and unpaid databases which our team has access to and gather data through the same. This includes examining of listed companies’ annual reports, Journals, SEC filling etc. Apart from this our team has access to various associations across the globe across different industries. Lastly, we have exchange relationships with various university as well as individual libraries.

Secondary Research

Step 2: Primary Research

When we talk about primary research, it is a type of study in which the researchers collect relevant data samples directly, rather than relying on previously collected data.  This type of research is focused on gaining content specific facts that can be sued to solve specific problems. Since the collected data is fresh and first hand therefore it makes the study more accurate and genuine.

We at SNS Insider have divided Primary Research into 2 parts.

Part 1 wherein we interview the KOLs of major players as well as the upcoming ones across various geographic regions. This allows us to have their view over the market scenario and acts as an important tool to come closer to the accurate market numbers. As many as 45 paid and unpaid primary interviews are taken from both the demand and supply side of the industry to make sure we land at an accurate judgement and analysis of the market.

This step involves the triangulation of data wherein our team analyses the interview transcripts, online survey responses and observation of on filed participants. The below mentioned chart should give a better understanding of the part 1 of the primary interview.

Primary Research

Part 2: In this part of primary research the data collected via secondary research and the part 1 of the primary research is validated with the interviews from individual consultants and subject matter experts.

Consultants are those set of people who have at least 12 years of experience and expertise within the industry whereas Subject Matter Experts are those with at least 15 years of experience behind their back within the same space. The data with the help of two main processes i.e., FGDs (Focused Group Discussions) and IDs (Individual Discussions). This gives us a 3rd party nonbiased primary view of the market scenario making it a more dependable one while collation of the data pointers.

Step 3: Data Bank Validation

Once all the information is collected via primary and secondary sources, we run that information for data validation. At our intelligence centre our research heads track a lot of information related to the market which includes the quarterly reports, the daily stock prices, and other relevant information. Our data bank server gets updated every fortnight and that is how the information which we collected using our primary and secondary information is revalidated in real time.

Data Bank Validation

Step 4: QA/QC Process

After all the data collection and validation our team does a final level of quality check and quality assurance to get rid of any unwanted or undesired mistakes. This might include but not limited to getting rid of the any typos, duplication of numbers or missing of any important information. The people involved in this process include technical content writers, research heads and graphics people. Once this process is completed the title gets uploader on our platform for our clients to read it.

Step 5: Final QC/QA Process:

This is the last process and comes when the client has ordered the study. In this process a final QA/QC is done before the study is emailed to the client. Since we believe in giving our clients a good experience of our research studies, therefore, to make sure that we do not lack at our end in any way humanly possible we do a final round of quality check and then dispatch the study to the client.

Key Segmentation

By Service Type

  • Hydraulic Fracturing

  • Cementing

  • Others

By Resource Type

  • Conventional

  • Unconventional

By Well Type

  • Horizontal

  • Vertical

  • Directional

Request for Segment Customization as per your Business Requirement: Segment Customization Request

Regional Coverage

North America

  • US

  • Canada

  • Mexico

Europe

  • Eastern Europe

    • Poland

    • Romania

    • Hungary

    • Turkey

    • Rest of Eastern Europe

  • Western Europe

    • Germany

    • France

    • UK

    • Italy

    • Spain

    • Netherlands

    • Switzerland

    • Austria

    • Rest of Western Europe

Asia Pacific

  • China

  • India

  • Japan

  • South Korea

  • Vietnam

  • Singapore

  • Australia

  • Rest of Asia Pacific

Middle East & Africa

  • Middle East

    • UAE

    • Egypt

    • Saudi Arabia

    • Qatar

    • Rest of the Middle East

  • Africa

    • Nigeria

    • South Africa

    • Rest of Africa

Latin America

  • Brazil

  • Argentina

  • Colombia

  • Rest of Latin America

Request for Country Level Research Report: Country Level Customization Request

Available Customization

With the given market data, SNS Insider offers customization as per the company’s specific needs. The following customization options are available for the report:

  • Product Analysis

  • Criss-Cross segment analysis (e.g. Product X Application)

  • Product Matrix which gives a detailed comparison of product portfolio of each company

  • Geographic Analysis

  • Additional countries in any of the regions

  • Company Information

  • Detailed analysis and profiling of additional market players (Up to five)


  •            5000 (33% Discount)


  •            8950 (40% Discount)


  •            3050 (23% Discount)

Start a Conversation

Hi! Click one of our member below to chat on Phone