Rendered Products Market Report Scope & Overview:
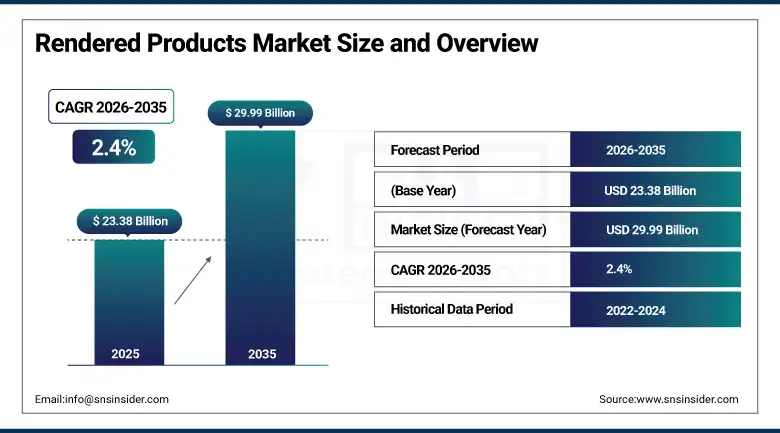
The Rendered Products Market was valued at USD 23.38 Billion in 2025 and is expected to reach USD 29.99 Billion by 2035, growing at a CAGR of 2.4% from 2026–2035.
The global rendered products market is growing steadily. The rendering process transforms raw animal materials from meat processing operations into lard, tallow, and protein meal whose commercial applications span animal feed, biofuel production, pharmaceuticals, and industrial lubricants. The market is primarily driven by rising global meat consumption, the expanding animal feed industry's demand for protein meal and fat as cost-effective feed ingredients, and the growing biofuel sector's adoption of tallow and grease as sustainable feedstocks for biodiesel and renewable diesel production. More than 70% of processed material comprises steel and aluminum metals; in rendering, more than 70% of processed by-products are recovered as tallow and protein meal, helping reduce approximately 60% of carbon emissions.
Tomra Foods deployed advanced optical sorting technology at rendering facilities to improve by-product quality classification and contaminant removal, demonstrating the commercial adoption of automated inspection technology whose sorting accuracy improvement creates higher-grade rendered product output that commands premium pricing in food-grade and pharmaceutical-grade market channels. The technology reflects the rendering industry's progressive investment in digital quality management infrastructure that differentiates premium product quality from commodity-grade rendered by-product alternatives.
Market Size and Forecast
-
Market Size in 2026E: USD 23.94 Billion
-
Market Size by 2035: USD 29.99 Billion
-
CAGR: 2.4% from 2026 to 2035
-
Fastest Growing Region: Asia Pacific
-
Largest Region: North America
To Get more information On Rendered Products Market - Request Free Sample Report
Rendered Products Market Trends
-
Renewable diesel and sustainable aviation fuel production is increasing demand for rendered fats as low-carbon feedstocks.
-
Advanced rendering technologies are improving protein meal quality, enhancing digestibility and competitiveness in animal feed applications.
-
Premium pet food demand is boosting consumption of high-quality rendered proteins and animal fats globally.
-
Circular economy regulations are supporting rendering industry growth through waste-to-resource conversion and emission reduction initiatives.
-
Continuous rendering systems are improving energy efficiency, product consistency, and processing throughput compared with batch operations.
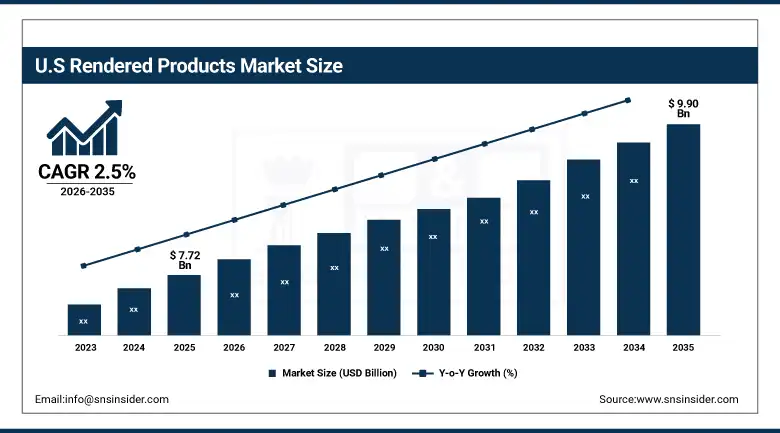
The U.S. Rendered Products Market Outlook
The U.S. rendered products market was valued at approximately USD 7.72 Billion in 2025 and is expected to reach approximately USD 9.90 Billion by 2035, growing at a CAGR of approximately 2.5%.
The U.S. is the world's most commercially significant market within North America's dominant revenue position. Darling Ingredients, Tyson Foods' rendering division, JBS USA's rendering operations, Valley Proteins, and West Coast Reduction collectively define the commercial U.S. rendering landscape. The U.S. renewable fuel standard's biomass-based diesel incentive creates above-average commercial motivation for tallow and animal fat as biodiesel feedstocks whose D4 RIN credit value sustains premium pricing relative to commodity petroleum feedstock alternatives. The extraordinary scale of U.S. meat processing creates the world's most commercially concentrated rendering by-product supply whose consistent quality and volume create institutional supply relationships with animal feed, pet food, and biodiesel industry customers.
In 2023, Darling Ingredients expanded its Diamond Green Diesel renewable fuel joint venture's production capacity to 1.2 billion gallons per year at its Port Arthur, Texas facility, making it the world's largest renewable diesel facility whose tallow and animal fat feedstock procurement creates the most commercially significant demand driver for rendered fat products in the U.S. market. The expansion represents the extraordinary commercial intersection of the rendering industry's traditional animal fat output and the renewable fuel sector's sustainability-driven feedstock demand.
Rendered Products Market Segment Analysis
-
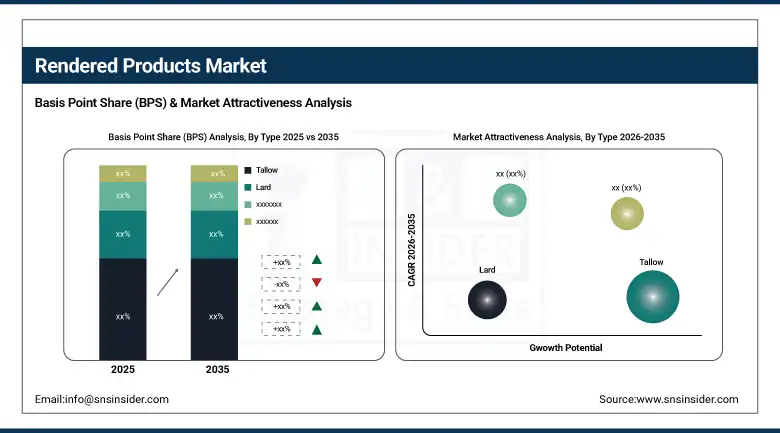
By Type, the tallow segment dominated the rendered products market with approximately 35% share in 2025, while the protein meal segment is the fastest growing.
-
By Source, the cattle/bovine segment dominated the rendered products market with approximately 42% share in 2025, while the poultry segment is the fastest growing.
-
By Grade, the feed grade segment dominated the rendered products market with approximately 52% share in 2025, while the industrial grade segment is the fastest growing.
-
By End Use, the animal feed segment dominated the rendered products market with approximately 38% share in 2025, while the biofuel & biodiesel segment is the fastest growing.
By Type, tallow dominates, protein meal grows fastest
Tallow retained the dominant type position with approximately 35% of the rendered products market in 2025. Its commercial primacy reflects the extraordinary versatility of beef tallow and mutton tallow across food and feed applications, cosmetics and personal care, industrial lubricants, and the rapidly growing biofuel sector whose combined procurement creates the most commercially diversified single rendered product type. Tallow's fatty acid profile, combining saturated and monounsaturated fats at proportions suitable for diverse industrial processing routes, creates commercial application breadth that lard and poultry fat alternatives cannot match.
Protein meal is the fastest-growing rendered product type because the global animal feed industry's systematic adoption of protein meal as a cost-effective, high-digestibility protein source for poultry, swine, cattle, and aquaculture feeds creates structured demand growth whose commercial scale compounds with global meat and seafood production volume expansion. Meat and bone meal, poultry by-product meal, and blood meal collectively provide the animal feed industry with concentrated protein ingredients whose energy density, amino acid profile, and phosphorus content create nutritional complementarity with grain-based feed formulations.
By Source, cattle/bovine dominates, poultry grows fastest
Cattle and bovine sources retained the dominant position with approximately 42% of the rendered products market in 2025. The extraordinary scale of global beef and veal processing creates the most commercially significant single-source rendered product supply whose combined tallow, meat and bone meal, and blood meal output defines the market's largest aggregate by-product volume. North American beef processing concentration in the U.S. Midwest and Great Plains, South American cattle processing in Brazil and Argentina, and Australian pastoral beef processing collectively represent the world's most commercially concentrated cattle rendering supply base.
Poultry is the fastest-growing source because global poultry production's status as the world's most rapidly expanding animal protein category creates above-average rendered by-product generation growth. Each new poultry processing facility and each expansion of existing broiler, turkey, and layer hen processing operations creates incremental poultry fat and protein meal output whose commercial recovery creates rendering procurement. The developing world's poultry consumption growth, driven by affordability advantages over beef and pork, creates the most commercially dynamic source category expansion whose compounding trajectory sustains poultry's fastest-growing rendered source classification.
By Grade, feed grade dominates, industrial grade grows fastest
Feed grade retained the dominant grade position with approximately 52% of the rendered products market in 2025. Feed-grade rendered products’ position as essential livestock feed ingredients whose protein meal and fat content provide cost-effective nutrition for the global animal feed industry creates the most commercially certain and highest-volume procurement of any rendered product grade. Each ton of poultry, livestock, or aquaculture feed that incorporates rendered protein meal and fat creates feed-grade rendered product procurement whose commercial aggregate across the global animal feed industry sustains the grade’s market dominance.
Industrial grade is the fastest-growing grade because the renewable fuel sector's extraordinary capacity expansion for biodiesel, renewable diesel, and sustainable aviation fuel creates above-average industrial-specification rendered fat procurement. Each new renewable diesel facility and each SAF production programme that specifies tallow or animal fat as feedstock creates industrial-grade rendered product demand whose premium RIN and carbon credit value sustains pricing above comparable food-grade alternatives in markets where renewable fuel demand exceeds food industry procurement. Darling Ingredients’ Diamond Green Diesel expansion's creation of 1.2 billion gallons per year renewable diesel capacity at Port Arthur demonstrates the commercial scale of industrial-grade rendered fat demand creation.
By End Use, animal feed dominates, biofuel grows fastest
Animal feed retained the dominant end-use position with approximately 38% of the rendered products market in 2025. The global animal feed industry’s systematic adoption of rendered protein meal and fat as cost-effective, nutritionally dense feed ingredients for poultry, livestock, swine, and aquaculture creates the most commercially concentrated and highest-volume rendered product demand of any application category. Rising global population and rising income in developing countries are expanding the demand for animal proteins whose production requires animal feed inputs, creating structural growth in rendered product demand as a feed ingredient component.
Biofuel and biodiesel is the fastest-growing end use because the renewable fuel sector's mandatory blending targets, the aviation industry's sustainable fuel commitments, and the renewable diesel capacity expansion collectively create the most commercially dynamic demand growth for rendered fats and greases. The EU's Renewable Energy Directive's waste-derived feedstock sustainability bonus, the U.S. renewable fuel standard's D4 RIN value for biomass-based diesel from animal fats, and airline industry SAF commitment programmes collectively create premium procurement channels whose sustainability credential value sustains tallow and animal fat pricing above alternative feedstock equivalents.
Regional Analysis
|
Region |
Major Country |
Share within Region, 2025 (%) |
|---|---|---|
|
North America |
United States |
87.4% |
|
Europe |
Germany |
22.3% |
|
Asia Pacific |
China |
44.8% |
|
Middle East & Africa |
South Africa |
31.2% |
|
Latin America |
Brazil |
44.2% |
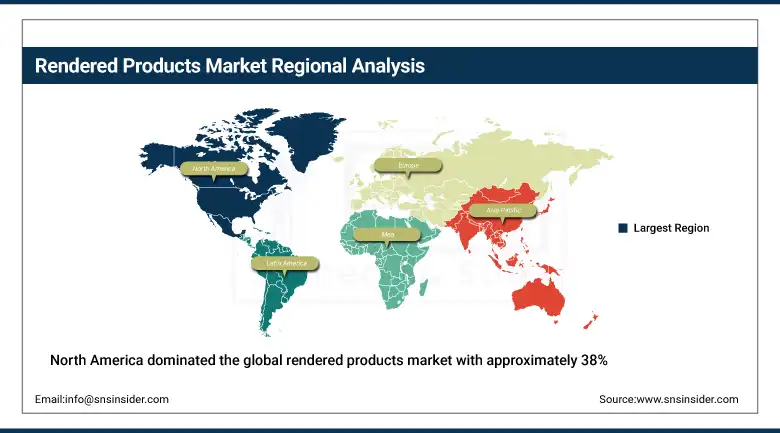
North America Rendered Products Market Insights
North America dominated the global rendered products market with approximately 38% of global revenues in 2025, owing to its large-scale meat processing industry, advanced rendering infrastructure, and the commercial presence of Darling Ingredients, Tyson Foods, JBS USA, Valley Proteins, and West Coast Reduction. The United States accounts for approximately 87.4% of North American revenues through its extraordinary beef, poultry, and pork processing scale that creates the world's most commercially concentrated rendering by-product supply, combined with the renewable fuel sector's above-average tallow and animal fat procurement.
Canada contributes approximately 12.6% of North American revenues through its significant beef processing industry centered in Alberta, the poultry processing sector's by-product generation, and the growing biodiesel industry's animal fat feedstock procurement from West Coast Reduction and Rothsay's Canadian rendering operations.
Get Customized Report as per Your Business Requirement - Enquiry Now
Europe Rendered Products Market Insights
Europe is a technically sophisticated rendered products market where the EU's sustainable biofuel directive creates above-average tallow and animal fat demand for biodiesel blending, and EU Animal By-Products Regulation 1069/2009's strict classification and processing requirements create compliance investment that sustains the industry's regulated commercial structure. Germany accounts for approximately 22.3% of European revenues through its large pork processing industry's lard and protein meal production, the beef sector's tallow output, and the biodiesel sector's animal fat feedstock procurement.
The United Kingdom, France, and the Netherlands are significant secondary markets where established rendering industries including Leo Group, SARIA Group, and NBT serve meat processing sectors whose combined by-product volume creates consistent rendered product commercial supply.
Asia Pacific Rendered Products Market Insights
Asia Pacific is the fastest-growing regional rendered products market, driven by China's rapid expansion of poultry and pork processing, India's growing cattle and poultry rendering sector, Southeast Asia's expanding aquaculture industry requiring rendered protein meal, and Australia's large beef rendering export capability. China accounts for approximately 44.8% of Asia Pacific revenues through its position as the world's largest pork and poultry processor whose rendering by-product volume creates substantial domestic lard, poultry fat, and protein meal supply.
India represents the most commercially dynamic emerging market within Asia Pacific where the expanding meat and poultry processing industry, the growing aquaculture sector's protein meal demand, and the government's biodiesel policy creating industrial-grade rendered fat procurement create above-average market growth that compounds with India's protein consumption expansion.
MEA & Latin America Rendered Products Market Insights
South Africa leads MEA revenues at approximately 31.2% through its well-established meat processing and rendering industry serving both domestic animal feed and export markets. Brazil leads Latin American revenues at approximately 44.2% through its position as the world's largest beef exporter whose cattle rendering operations produce globally traded tallow and protein meal. Argentina's beef processing, Brazil's poultry industry expansion, and the region's growing biodiesel sector collectively sustain Latin American market development. The halal rendering sector across the Gulf states creates growing MEA procurement for compliant rendered ingredients through 2035.
Market Dynamics
Growth Drivers: Rising meat consumption driving by-product generation and renewable fuel sector creating premium fat demand
Rising global meat and poultry consumption is the rendered products market's most commercially certain structural growth driver. The FAO's projection of 14% growth in global meat demand by 2030 creates proportional growth in rendering-eligible by-product generation whose commercial recovery creates structured rendered product supply expansion. Each percentage point increase in global poultry production creates proportional poultry fat and protein meal availability that sustains feed-grade rendered product procurement from the animal feed industry. The developing world's protein consumption transition from plant-based to animal-based diets creates structural demand growth whose demographic basis compounds with rising income per capita in China, India, Southeast Asia, and Sub-Saharan Africa.
The renewable fuel sector's extraordinary demand creation for tallow and animal fat as sustainable feedstocks represents the most commercially transformative recent development in the rendered products market. Darling Ingredients’ Diamond Green Diesel, Neste's renewable diesel, and the aviation industry's SAF commitments collectively create premium procurement channels whose sustainability credential value elevates tallow and animal fat pricing above historical commodity levels, improving rendering industry economics and incentivizing additional processing capacity investment.
Restraints: Regulatory restrictions on rendered product use in certain animal feed applications and feedstock supply competition
Regulatory restrictions on the use of processed animal protein in ruminant feeds in the EU and other markets, implementing precautionary measures following BSE and other transmissible spongiform encephalopathy concerns, create commercial constraints on protein meal's addressable animal feed market. Each feed-grade protein meal use restriction that prevents inclusion in cattle and sheep feeds reduces the addressable market for bovine-derived protein meal and moderates the commercial opportunity in the largest rendered protein source category.
Competition for animal fat and tallow between the renewable fuel sector's premium procurement and the traditional food, feed, and cosmetics applications creates supply allocation tension that moderates availability and elevates pricing for traditional non-fuel markets. Each renewable diesel facility expansion that increases industrial-grade tallow demand creates upward price pressure that impacts food-grade and feed-grade rendered fat application economics in cost-sensitive procurement environments.
Opportunities: Sustainable aviation fuel feedstock adoption and premium pet food ingredient development
Sustainable aviation fuel feedstock adoption represents the most commercially premium near-term market development opportunity for rendered fat producers. Airlines’ commitments to SAF blending mandates create structured long-term tallow and animal fat procurement that differs from conventional commodity markets in its long-term contract structure, premium pricing, and regulatory value. Each new SAF production facility that qualifies rendered fat as an approved feedstock creates commercial relationships whose duration and pricing structure create above-commodity economics that sustain rendering industry investment.
Premium pet food ingredient development represents the most commercially accessible near-term growth opportunity whose premiumization trend creates above-average demand for high-quality rendered protein meal and fat ingredients. The pet food industry's shift toward human-grade ingredient specifications and grain-free formulations creates premium rendering procurement channels whose quality specification and pricing substantially exceed commodity feed-grade market alternatives.
Recent Developments:
-
2026: SARIA Group advanced its circular economy strategy in 2026 by expanding sustainable animal by-product recycling facilities and improving energy-efficient continuous rendering technologies.
-
2025: Darling Ingredients Inc. expanded renewable fuel feedstock production in 2025 by increasing rendered fat processing capacity, supporting growing sustainable aviation fuel and renewable diesel demand globally.
-
2025: JBS S.A. strengthened its rendering operations in 2025 through investments in by-product utilization and higher-value protein meal production for animal nutrition applications.
Rendered Products Market key players are:
-
Darling Ingredients Inc.
-
Tyson Foods Inc.
-
JBS S.A.
-
Cargill Incorporated
-
West Coast Reduction Ltd.
-
Valley Proteins Inc.
-
SARIA Group
-
Rothsay (Maple Leaf Foods)
-
Yorkshire Premier Meat
-
Leo Group Ltd.
-
Nordfeed A/S
-
SRC Companies Inc.
-
Allanasons Pvt. Ltd.
-
Sanimax LLC
-
Baker Commodities Inc.
-
National By-Products LLC
-
FASA Group
-
Griffin Industries Inc.
-
Hess Rendering Inc.
-
NBT (National By-Products & Tallow)
Rendered Products Market Report Scope:
| Report Attributes | Details |
|---|---|
| Market Size in 2025 | USD 23.38 Billion |
| Market Size by 2035 | USD 29.99 Billion |
| CAGR | CAGR of 2.4% From 2026 to 2035 |
| Base Year | 2025 |
| Forecast Period | 2026-2035 |
| Historical Data | 2022-2024 |
| Report Scope & Coverage | Market Size, Segments Analysis, Competitive Landscape, Regional Analysis, DROC & SWOT Analysis, Forecast Outlook |
| Key Segments | • By Type (Tallow, Lard, Poultry Fat, Grease, Protein Meal, Others) • By Source (Cattle/Bovine, Poultry, Porcine/Hog, Sheep, Others) • By Grade (Food Grade, Feed Grade, Industrial Grade) • By End Use (Animal Feed, Biofuel & Biodiesel, Food Industry, Cosmetics & Personal Care, Pharmaceuticals, Industrial Lubricants, Pet Food, Others) |
| Regional Analysis/Coverage | North America (US, Canada), Europe (Germany, UK, France, Italy, Spain, Russia, Poland, Rest of Europe), Asia Pacific (China, India, Japan, South Korea, Australia, ASEAN Countries, Rest of Asia Pacific), Middle East & Africa (UAE, Saudi Arabia, Qatar, South Africa, Rest of Middle East & Africa), Latin America (Brazil, Argentina, Mexico, Colombia, Rest of Latin America). |
| Company Profiles | Darling Ingredients Inc., Tyson Foods Inc., JBS S.A., Cargill Incorporated, West Coast Reduction Ltd., Valley Proteins Inc., SARIA Group, Rothsay (Maple Leaf Foods), Yorkshire Premier Meat, Leo Group Ltd., Nordfeed A/S, SRC Companies Inc., Allanasons Pvt. Ltd., Sanimax LLC, Baker Commodities Inc., National By-Products LLC, FASA Group, Griffin Industries Inc., Hess Rendering Inc., NBT (National By-Products & Tallow) |
Frequently Asked Questions
The Rendered Products Market is expected to grow at a CAGR of 2.4% from 2026 to 2035.
The market was valued at USD 23.38 Billion in 2025.
Rising global meat and poultry consumption creating growing volumes of rendering-eligible by-products.
Tallow dominated the market with approximately 35% share in 2025.
North America dominated the market with approximately 38% of global revenues in 2025.
Get in Touch
