Get More Information on Residential Filters Market - Request Sample Report
The Residential Filters Market size was valued at USD 8.26 Billion in 2023 and is now anticipated to grow to USD 16.78 Billion by 2032, displaying a CAGR of 8.2% during the forecast period of 2024-2032.
The Residential Filters Market is experiencing steady growth due to increasing concerns about indoor air quality and the need for clean water. As consumers become more health-conscious, demand for air and water filtration systems has surged, driving advancements in filter technologies. The market includes various types of filters such as air, water, and HVAC filters, all aimed at improving the quality of life by removing pollutants, allergens, and harmful contaminants from household environments. This has led to a notable rise in product innovations, including the integration of smart technologies that enable monitoring and maintenance of filtration systems in real-time.
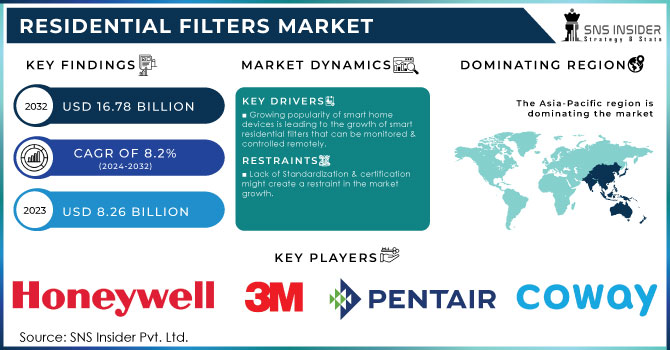
In terms of growth, the market is projected to expand significantly over the next decade. Factors contributing to this growth include the increasing awareness of health risks associated with poor air and water quality, government regulations promoting clean air and water standards, and the rise in urbanization, which contributes to environmental pollution. Additionally, the expansion of residential construction activities, especially in emerging economies, is creating more opportunities for filter manufacturers. These filters are becoming a necessity in urban households, further boosting market demand. Recent trends in the market highlight a shift towards sustainable and energy-efficient products. Many manufacturers are focusing on developing eco-friendly filters made from biodegradable or recyclable materials to cater to environmentally conscious consumers. The adoption of smart filters that are compatible with home automation systems is another trend gaining traction. These smart filters not only enhance convenience by alerting users when replacements are needed but also optimize energy usage. Additionally, the pandemic has heightened consumer focus on indoor hygiene, driving increased sales of advanced air filters capable of removing viruses and bacteria, further boosting market prospects.
DRIVERS
Increasing health awareness is a major driver of growth in the Residential Filters Market, as consumers become more conscious of the health risks posed by poor air and water quality. Pollutants such as dust, pollen, allergens, bacteria, and harmful chemicals are prevalent in both indoor air and household water supplies, contributing to a range of health issues, including respiratory conditions, allergies, and waterborne diseases. This has led to a surge in demand for air and water filtration systems that can effectively remove these contaminants, ensuring a safer living environment.
Many households are now prioritizing filtration systems to improve indoor air quality, especially in urban areas where pollution levels are higher. Indoor air can often be more polluted than outdoor air due to the accumulation of dust, pet dander, and other allergens. This makes air purifiers with HEPA filters, which capture fine particles, highly desirable. Similarly, water contamination from outdated plumbing systems, industrial pollutants, and pesticide runoff has heightened the need for advanced water filtration systems. Consumers are seeking solutions that can provide clean, contaminant-free water to protect against illnesses caused by bacteria, lead, and other toxins. Filtration systems that ensure safe drinking water and clean household environments are now seen as essential, not just luxury items. With increasing education about the long-term health benefits of cleaner air and water, the demand for residential filters continues to rise, making this a significant market growth factor.
Technological advancements play a crucial role in driving growth in the Residential Filters Market, primarily through innovations that enhance filtration efficiency and user convenience. One of the most significant developments is the introduction of HEPA (High-Efficiency Particulate Air) filters, which can capture up to 99.97% of airborne particles as small as 0.3 microns. This capability makes HEPA filters exceptionally effective in removing allergens, dust, pollen, and other harmful pollutants from indoor air, significantly improving air quality in residential spaces. As consumers become more health-conscious, the demand for such high-performance filters continues to rise.
Moreover, the emergence of smart filters has revolutionized the market by integrating technology that enables real-time monitoring of air and water quality. These smart systems can provide users with timely notifications about filter performance, remaining lifespan, and necessary replacements via smartphone apps or smart home systems. This convenience not only helps ensure that filtration systems are maintained optimally but also empowers consumers with valuable information about their indoor environment. Additionally, advancements in materials science have led to the development of filters with longer lifespans and lower maintenance requirements, further enhancing their appeal. For example, newer filters are often designed to withstand more significant stress and operate effectively over extended periods without needing frequent replacements. As a result, these technological innovations contribute to increased consumer satisfaction and market growth, as homeowners seek efficient and convenient solutions for maintaining clean air and water in their living spaces.
RESTRAIN
Maintenance and replacement costs significantly influence consumer decisions in the Residential Filters Market, acting as a barrier for some homeowners. While high-quality filtration systems offer superior performance, they often require regular upkeep to maintain efficiency. This includes periodic cleaning or replacement of filters, which can lead to increased long-term expenses. For many consumers, particularly those on a tight budget, the thought of ongoing costs can make investing in premium filtration systems less appealing. Furthermore, the initial purchase price of advanced filters may be attractive, but the prospect of future maintenance and replacement expenses can deter potential buyers. As a result, homeowners may opt for more basic, cost-effective options that, while less efficient, do not impose the same financial burden over time. Ultimately, the total cost of ownership, including maintenance and replacements, plays a crucial role in shaping consumer attitudes toward residential filtration solutions.
By Product Type
The Water Filter type dominated the market with a share of around 63.2% in 2023. Drive for awareness through consumers on water quality concerns such as hardness, contamination, depletion of fresh water sources and increasing focus towards safe and healthy water consumption is rising. On the other hand, the dominance of water filters also lies in rapid urbanization.
By Application
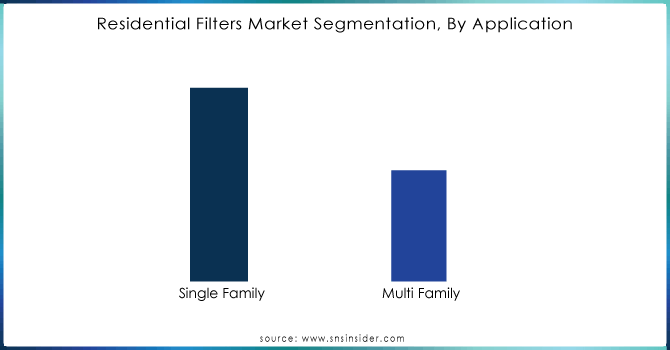
The Single-Family Application is dominating the market with a share of more than 60%in 2023. Rising adoption of air filtration systems in single-family housing sectors such as bungalows and cottages a driving factor for the market. Demand for single-family homes has increased due to the ability to reduce pollutants such as particles, gases, vapors from connecting indoors. Moreover, the increasing consumer expenditure on a healthy lifestyle due to growing global pollution is driving the market.
Need any customization research on Residential Filters Market - Enquiry Now
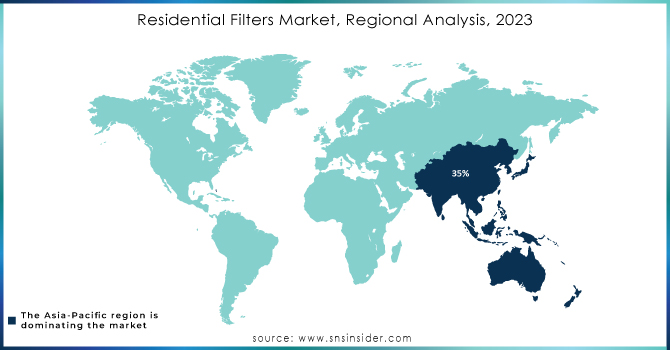
The Asia-Pacific region dominates the Residential Filters Market, holding approximately 35% in 2023. This region's dominance is driven by a variety of factors, including rising awareness about air and water pollution, increasing demand for clean water and air, and the rapid growth of filtration technologies. The continuous industrialization and urbanization in key countries such as China and India have led to a significant surge in pollution levels, increasing the need for residential filters.
North America is the fastest-growing market for residential filters, trailing closely behind Asia-Pacific. The region's growth is primarily attributed to its robust economic development and the implementation of stringent regulatory standards promoting sustainability and clean-living environments. Countries like the United States and Canada are experiencing an uptick in the installation of residential filtration systems due to the growing awareness of health-related concerns associated with poor air and water quality.
Some of the major key players of Residential Filters Market
In February 2023: Honeywell introduced a new line of air purifiers with integrated air quality monitors. These purifiers automatically adjust fan speed and filtration based on real-time indoor air quality readings, optimizing performance for specific needs.
In January 2023: A.O. Smith invested in research for self-cleaning reverse osmosis filters aiming to eliminate the need for manual membrane replacements, reducing maintenance for homeowners.
Report Attributes | Details |
---|---|
Market Size in 2023 | USD 8.26 Billion |
Market Size by 2032 | USD 16.78 Billion |
CAGR | CAGR of 8.2% From 2024 to 2032 |
Base Year | 2023 |
Forecast Period | 2024-2032 |
Historical Data | 2020-2022 |
Report Scope & Coverage | Market Size, Segments Analysis, Competitive Landscape, Regional Analysis, DROC & SWOT Analysis, Forecast Outlook |
Key Segments | • By Product Type (Air Filter, Water Filter) • By Application (Single Family, Multi Family) • By Efficiency (MERV 1-4, MERV 6-10, MERV 10-13, MERV 14-16, MERV 17-20) |
Regional Analysis/Coverage | North America (US, Canada, Mexico), Europe (Eastern Europe [Poland, Romania, Hungary, Turkey, Rest of Eastern Europe] Western Europe] Germany, France, UK, Italy, Spain, Netherlands, Switzerland, Austria, Rest of Western Europe]), Asia Pacific (China, India, Japan, South Korea, Vietnam, Singapore, Australia, Rest of Asia Pacific), Middle East & Africa (Middle East [UAE, Egypt, Saudi Arabia, Qatar, Rest of Middle East], Africa [Nigeria, South Africa, Rest of Africa], Latin America (Brazil, Argentina, Colombia, Rest of Latin America) |
Company Profiles | 3M Company, Honeywell International Inc., Pentair plc, Unilever Group (Pureit), Culligan International Company, Coway Co. Ltd., Amway Corporation, Blueair, Eureka Forbes Ltd., Kent RO Systems Ltd.,Whirlpool Corporation,Samsung Electronics Co. Ltd, LG Electronics Inc, Panasonic Corporation, Daikin Industries, Ltd, Midea Group Co. Ltd, O. Smith Corporati, Philips, TCL Technology Group Corporation, Sharp Corporation |
Key Drivers | • Increasing health awareness is driving demand for residential filters as consumers seek to protect their families from respiratory issues, allergies, and waterborne diseases caused by poor air and water quality. • Technological advancements, including HEPA filters and smart filtration systems with real-time monitoring, are enhancing filtration efficiency and convenience, thereby driving growth in the residential filters market. |
RESTRAINTS | • The maintenance and replacement costs associated with filtration systems can deter homeowners from investing in high-end options, as regular upkeep is necessary to ensure optimal performance and adds to the overall cost of ownership. |
Ans: The Residential Filters Market is expected to grow at a CAGR of 8.2% Over the Forecast Period of 2024-2032.
Ans: Residential Filters Market size was USD 8.26 Billion in 2023 and is expected to Reach USD 16.78 Billion by 2032.
Ans: Water Filter segmentation is the dominating segment By Product Type in the Residential Filters Market.
Ans: Increasing health awareness is driving demand for residential filters as consumers seek to protect their families from respiratory issues, allergies, and waterborne diseases caused by poor air and water quality.
Ans: Asia-Pacific is the dominating region in the Residential Filters Market.
TABLE OF CONTENTS
1. Introduction
1.1 Market Definition
1.2 Scope (Inclusion and Exclusions)
1.3 Research Assumptions
2. Executive Summary
2.1 Market Overview
2.2 Regional Synopsis
2.3 Competitive Summary
3. Research Methodology
3.1 Top-Down Approach
3.2 Bottom-up Approach
3.3. Data Validation
3.4 Primary Interviews
4. Market Dynamics Impact Analysis
4.1 Market Driving Factors Analysis
4.1.1 Drivers
4.1.2 Restraints
4.1.3 Opportunities
4.1.4 Challenges
4.2 PESTLE Analysis
4.3 Porter’s Five Forces Model
5. Statistical Insights and Trends Reporting
5.1 Manufacturing Output, by region, (2020-2023)
5.2 Utilization Rates, by region, (2020-2023)
5.3 Maintenance and Downtime Metrix
5.4 Technological Adoption Rates, by region
5.6 Export/Import Data, by region (2023)
6. Competitive Landscape
6.1 List of Major Companies, By Region
6.2 Market Share Analysis, By Region
6.3 Product Benchmarking
6.3.1 Product specifications and features
6.3.2 Pricing
6.4 Strategic Initiatives
6.4.1 Marketing and promotional activities
6.4.2 Distribution and supply chain strategies
6.4.3 Expansion plans and new product launches
6.4.4 Strategic partnerships and collaborations
6.5 Technological Advancements
6.6 Market Positioning and Branding
7. Residential Filters Market Segmentation, By Product Type
7.1 Chapter Overview
7.2 Air Filter
7.2.1 Air Filter Market Trends Analysis (2020-2032)
7.2.2 Air Filter Market Size Estimates and Forecasts to 2032 (USD Billion)
7.3 Water Filter
7.3.1 Water Filter Market Trends Analysis (2020-2032)
7.3.2 Water Filter Market Size Estimates and Forecasts to 2032 (USD Billion)
8. Residential Filters Market Segmentation, By Application
8.1 Chapter Overview
8.2 Single Family
8.2.1 Single Family Market Trends Analysis (2020-2032)
8.2.2 Single Family Market Size Estimates and Forecasts to 2032 (USD Billion)
8.3 Multi Family
8.3.1 Multi Family Market Trends Analysis (2020-2032)
8.3.2 Multi Family Market Size Estimates and Forecasts to 2032 (USD Billion)
9. Residential Filters Market Segmentation, By Efficiency
9.1 Chapter Overview
9.2 MERV 1-4
9.2.1 MERV 1-4 Market Trends Analysis (2020-2032)
9.2.2 MERV 1-4 Market Size Estimates and Forecasts to 2032 (USD Billion)
9.3 MERV 6-10
9.3.1 MERV 6-10 Market Trends Analysis (2020-2032)
9.3.2 MERV 6-10 Market Size Estimates and Forecasts to 2032 (USD Billion)
9.4 MERV 10-13
9.4.1 MERV 10-13 Market Trends Analysis (2020-2032)
9.4.2 MERV 10-13 Market Size Estimates and Forecasts to 2032 (USD Billion)
9.5 MERV 14-16
9.5.1 MERV 14-16 Market Trends Analysis (2020-2032)
9.5.2 MERV 14-16 Market Size Estimates and Forecasts to 2032 (USD Billion)
9.6 MERV 17-20
9.6.1 MERV 17-20Market Trends Analysis (2020-2032)
9.6.2 MERV 17-20 Market Size Estimates and Forecasts to 2032 (USD Billion)
10. Regional Analysis
10.1 Chapter Overview
10.2 North America
10.2.1 Trends Analysis
10.2.2 North America Residential Filters Market Estimates and Forecasts, by Country (2020-2032) (USD Billion)
10.2.3 North America Residential Filters Market Estimates and Forecasts, By Product Type (2020-2032) (USD Billion)
10.2.4 North America Residential Filters Market Estimates and Forecasts, By Application (2020-2032) (USD Billion)
10.2.5 North America Residential Filters Market Estimates and Forecasts, By Efficiency (2020-2032) (USD Billion)
10.2.6 USA
10.2.6.1 USA Residential Filters Market Estimates and Forecasts, By Product Type (2020-2032) (USD Billion)
10.2.6.2 USA Residential Filters Market Estimates and Forecasts, By Application (2020-2032) (USD Billion)
10.2.6.3 USA Residential Filters Market Estimates and Forecasts, By Efficiency (2020-2032) (USD Billion)
10.2.7 Canada
10.2.7.1 Canada Residential Filters Market Estimates and Forecasts, By Product Type (2020-2032) (USD Billion)
10.2.7.2 Canada Residential Filters Market Estimates and Forecasts, By Application (2020-2032) (USD Billion)
10.2.7.3 Canada Residential Filters Market Estimates and Forecasts, By Efficiency (2020-2032) (USD Billion)
10.2.8 Mexico
10.2.8.1 Mexico Residential Filters Market Estimates and Forecasts, By Product Type (2020-2032) (USD Billion)
10.2.8.2 Mexico Residential Filters Market Estimates and Forecasts, By Application (2020-2032) (USD Billion)
10.2.8.3 Mexico Residential Filters Market Estimates and Forecasts, By Efficiency (2020-2032) (USD Billion)
10.3 Europe
10.3.1 Eastern Europe
10.3.1.1 Trends Analysis
10.3.1.2 Eastern Europe Residential Filters Market Estimates and Forecasts, by Country (2020-2032) (USD Billion)
10.3.1.3 Eastern Europe Residential Filters Market Estimates and Forecasts, By Product Type (2020-2032) (USD Billion)
10.3.1.4 Eastern Europe Residential Filters Market Estimates and Forecasts, By Application (2020-2032) (USD Billion)
10.3.1.5 Eastern Europe Residential Filters Market Estimates and Forecasts, By Efficiency (2020-2032) (USD Billion)
10.3.1.6 Poland
10.3.1.6.1 Poland Residential Filters Market Estimates and Forecasts, By Product Type (2020-2032) (USD Billion)
10.3.1.6.2 Poland Residential Filters Market Estimates and Forecasts, By Application (2020-2032) (USD Billion)
10.3.1.6.3 Poland Residential Filters Market Estimates and Forecasts, By Efficiency (2020-2032) (USD Billion)
10.3.1.7 Romania
10.3.1.7.1 Romania Residential Filters Market Estimates and Forecasts, By Product Type (2020-2032) (USD Billion)
10.3.1.7.2 Romania Residential Filters Market Estimates and Forecasts, By Application (2020-2032) (USD Billion)
10.3.1.7.3 Romania Residential Filters Market Estimates and Forecasts, By Efficiency (2020-2032) (USD Billion)
10.3.1.8 Hungary
10.3.1.8.1 Hungary Residential Filters Market Estimates and Forecasts, By Product Type (2020-2032) (USD Billion)
10.3.1.8.2 Hungary Residential Filters Market Estimates and Forecasts, By Application (2020-2032) (USD Billion)
10.3.1.8.3 Hungary Residential Filters Market Estimates and Forecasts, By Efficiency (2020-2032) (USD Billion)
10.3.1.9 Turkey
10.3.1.9.1 Turkey Residential Filters Market Estimates and Forecasts, By Product Type (2020-2032) (USD Billion)
10.3.1.9.2 Turkey Residential Filters Market Estimates and Forecasts, By Application (2020-2032) (USD Billion)
10.3.1.9.3 Turkey Residential Filters Market Estimates and Forecasts, By Efficiency (2020-2032) (USD Billion)
10.3.1.10 Rest of Eastern Europe
10.3.1.10.1 Rest of Eastern Europe Residential Filters Market Estimates and Forecasts, By Product Type (2020-2032) (USD Billion)
10.3.1.10.2 Rest of Eastern Europe Residential Filters Market Estimates and Forecasts, By Application (2020-2032) (USD Billion)
10.3.1.10.3 Rest of Eastern Europe Residential Filters Market Estimates and Forecasts, By Efficiency (2020-2032) (USD Billion)
10.3.2 Western Europe
10.3.2.1 Trends Analysis
10.3.2.2 Western Europe Residential Filters Market Estimates and Forecasts, by Country (2020-2032) (USD Billion)
10.3.2.3 Western Europe Residential Filters Market Estimates and Forecasts, By Product Type (2020-2032) (USD Billion)
10.3.2.4 Western Europe Residential Filters Market Estimates and Forecasts, By Application (2020-2032) (USD Billion)
10.3.2.5 Western Europe Residential Filters Market Estimates and Forecasts, By Efficiency (2020-2032) (USD Billion)
10.3.2.6 Germany
10.3.2.6.1 Germany Residential Filters Market Estimates and Forecasts, By Product Type (2020-2032) (USD Billion)
10.3.2.6.2 Germany Residential Filters Market Estimates and Forecasts, By Application (2020-2032) (USD Billion)
10.3.2.6.3 Germany Residential Filters Market Estimates and Forecasts, By Efficiency (2020-2032) (USD Billion)
10.3.2.7 France
10.3.2.7.1 France Residential Filters Market Estimates and Forecasts, By Product Type (2020-2032) (USD Billion)
10.3.2.7.2 France Residential Filters Market Estimates and Forecasts, By Application (2020-2032) (USD Billion)
10.3.2.7.3 France Residential Filters Market Estimates and Forecasts, By Efficiency (2020-2032) (USD Billion)
10.3.2.8 UK
10.3.2.8.1 UK Residential Filters Market Estimates and Forecasts, By Product Type (2020-2032) (USD Billion)
10.3.2.8.2 UK Residential Filters Market Estimates and Forecasts, By Application (2020-2032) (USD Billion)
10.3.2.8.3 UK Residential Filters Market Estimates and Forecasts, By Efficiency (2020-2032) (USD Billion)
10.3.2.9 Italy
10.3.2.9.1 Italy Residential Filters Market Estimates and Forecasts, By Product Type (2020-2032) (USD Billion)
10.3.2.9.2 Italy Residential Filters Market Estimates and Forecasts, By Application (2020-2032) (USD Billion)
10.3.2.9.3 Italy Residential Filters Market Estimates and Forecasts, By Efficiency (2020-2032) (USD Billion)
10.3.2.10 Spain
10.3.2.10.1 Spain Residential Filters Market Estimates and Forecasts, By Product Type (2020-2032) (USD Billion)
10.3.2.10.2 Spain Residential Filters Market Estimates and Forecasts, By Application (2020-2032) (USD Billion)
10.3.2.10.3 Spain Residential Filters Market Estimates and Forecasts, By Efficiency (2020-2032) (USD Billion)
10.3.2.11 Netherlands
10.3.2.11.1 Netherlands Residential Filters Market Estimates and Forecasts, By Product Type (2020-2032) (USD Billion)
10.3.2.11.2 Netherlands Residential Filters Market Estimates and Forecasts, By Application (2020-2032) (USD Billion)
10.3.2.11.3 Netherlands Residential Filters Market Estimates and Forecasts, By Efficiency (2020-2032) (USD Billion)
10.3.2.12 Switzerland
10.3.2.12.1 Switzerland Residential Filters Market Estimates and Forecasts, By Product Type (2020-2032) (USD Billion)
10.3.2.12.2 Switzerland Residential Filters Market Estimates and Forecasts, By Application (2020-2032) (USD Billion)
10.3.2.12.3 Switzerland Residential Filters Market Estimates and Forecasts, By Efficiency (2020-2032) (USD Billion)
10.3.2.13 Austria
10.3.2.13.1 Austria Residential Filters Market Estimates and Forecasts, By Product Type (2020-2032) (USD Billion)
10.3.2.13.2 Austria Residential Filters Market Estimates and Forecasts, By Application (2020-2032) (USD Billion)
10.3.2.13.3 Austria Residential Filters Market Estimates and Forecasts, By Efficiency (2020-2032) (USD Billion)
10.3.2.14 Rest of Western Europe
10.3.2.14.1 Rest of Western Europe Residential Filters Market Estimates and Forecasts, By Product Type (2020-2032) (USD Billion)
10.3.2.14.2 Rest of Western Europe Residential Filters Market Estimates and Forecasts, By Application (2020-2032) (USD Billion)
10.3.2.14.3 Rest of Western Europe Residential Filters Market Estimates and Forecasts, By Efficiency (2020-2032) (USD Billion)
10.4 Asia-Pacific
10.4.1 Trends Analysis
10.4.2 Asia-Pacific Residential Filters Market Estimates and Forecasts, by Country (2020-2032) (USD Billion)
10.4.3 Asia-Pacific Residential Filters Market Estimates and Forecasts, By Product Type (2020-2032) (USD Billion)
10.4.4 Asia-Pacific Residential Filters Market Estimates and Forecasts, By Application (2020-2032) (USD Billion)
10.4.5 Asia-Pacific Residential Filters Market Estimates and Forecasts, By Efficiency (2020-2032) (USD Billion)
10.4.6 China
10.4.6.1 China Residential Filters Market Estimates and Forecasts, By Product Type (2020-2032) (USD Billion)
10.4.6.2 China Residential Filters Market Estimates and Forecasts, By Application (2020-2032) (USD Billion)
10.4.6.3 China Residential Filters Market Estimates and Forecasts, By Efficiency (2020-2032) (USD Billion)
10.4.7 India
10.4.7.1 India Residential Filters Market Estimates and Forecasts, By Product Type (2020-2032) (USD Billion)
10.4.7.2 India Residential Filters Market Estimates and Forecasts, By Application (2020-2032) (USD Billion)
10.4.7.3 India Residential Filters Market Estimates and Forecasts, By Efficiency (2020-2032) (USD Billion)
10.4.8 Japan
10.4.8.1 Japan Residential Filters Market Estimates and Forecasts, By Product Type (2020-2032) (USD Billion)
10.4.8.2 Japan Residential Filters Market Estimates and Forecasts, By Application (2020-2032) (USD Billion)
10.4.8.3 Japan Residential Filters Market Estimates and Forecasts, By Efficiency (2020-2032) (USD Billion)
10.4.9 South Korea
10.4.9.1 South Korea Residential Filters Market Estimates and Forecasts, By Product Type (2020-2032) (USD Billion)
10.4.9.2 South Korea Residential Filters Market Estimates and Forecasts, By Application (2020-2032) (USD Billion)
10.4.9.3 South Korea Residential Filters Market Estimates and Forecasts, By Efficiency (2020-2032) (USD Billion)
10.4.10 Vietnam
10.4.10.1 Vietnam Residential Filters Market Estimates and Forecasts, By Product Type (2020-2032) (USD Billion)
10.4.10.2 Vietnam Residential Filters Market Estimates and Forecasts, By Application (2020-2032) (USD Billion)
10.4.10.3 Vietnam Residential Filters Market Estimates and Forecasts, By Efficiency (2020-2032) (USD Billion)
10.4.11 Singapore
10.4.11.1 Singapore Residential Filters Market Estimates and Forecasts, By Product Type (2020-2032) (USD Billion)
10.4.11.2 Singapore Residential Filters Market Estimates and Forecasts, By Application (2020-2032) (USD Billion)
10.4.11.3 Singapore Residential Filters Market Estimates and Forecasts, By Efficiency (2020-2032) (USD Billion)
10.4.12 Australia
10.4.12.1 Australia Residential Filters Market Estimates and Forecasts, By Product Type (2020-2032) (USD Billion)
10.4.12.2 Australia Residential Filters Market Estimates and Forecasts, By Application (2020-2032) (USD Billion)
10.4.12.3 Australia Residential Filters Market Estimates and Forecasts, By Efficiency (2020-2032) (USD Billion)
10.4.13 Rest of Asia-Pacific
10.4.13.1 Rest of Asia-Pacific Residential Filters Market Estimates and Forecasts, By Product Type (2020-2032) (USD Billion)
10.4.13.2 Rest of Asia-Pacific Residential Filters Market Estimates and Forecasts, By Application (2020-2032) (USD Billion)
10.4.13.3 Rest of Asia-Pacific Residential Filters Market Estimates and Forecasts, By Efficiency (2020-2032) (USD Billion)
10.5 Middle East and Africa
10.5.1 Middle East
10.5.1.1 Trends Analysis
10.5.1.2 Middle East Residential Filters Market Estimates and Forecasts, by Country (2020-2032) (USD Billion)
10.5.1.3 Middle East Residential Filters Market Estimates and Forecasts, By Product Type (2020-2032) (USD Billion)
10.5.1.4 Middle East Residential Filters Market Estimates and Forecasts, By Application (2020-2032) (USD Billion)
10.5.1.5 Middle East Residential Filters Market Estimates and Forecasts, By Efficiency (2020-2032) (USD Billion)
10.5.1.6 UAE
10.5.1.6.1 UAE Residential Filters Market Estimates and Forecasts, By Product Type (2020-2032) (USD Billion)
10.5.1.6.2 UAE Residential Filters Market Estimates and Forecasts, By Application (2020-2032) (USD Billion)
10.5.1.6.3 UAE Residential Filters Market Estimates and Forecasts, By Efficiency (2020-2032) (USD Billion)
10.5.1.7 Egypt
10.5.1.7.1 Egypt Residential Filters Market Estimates and Forecasts, By Product Type (2020-2032) (USD Billion)
10.5.1.7.2 Egypt Residential Filters Market Estimates and Forecasts, By Application (2020-2032) (USD Billion)
10.5.1.7.3 Egypt Residential Filters Market Estimates and Forecasts, By Efficiency (2020-2032) (USD Billion)
10.5.1.8 Saudi Arabia
10.5.1.8.1 Saudi Arabia Residential Filters Market Estimates and Forecasts, By Product Type (2020-2032) (USD Billion)
10.5.1.8.2 Saudi Arabia Residential Filters Market Estimates and Forecasts, By Application (2020-2032) (USD Billion)
10.5.1.8.3 Saudi Arabia Residential Filters Market Estimates and Forecasts, By Efficiency (2020-2032) (USD Billion)
10.5.1.9 Qatar
10.5.1.9.1 Qatar Residential Filters Market Estimates and Forecasts, By Product Type (2020-2032) (USD Billion)
10.5.1.9.2 Qatar Residential Filters Market Estimates and Forecasts, By Application (2020-2032) (USD Billion)
10.5.1.9.3 Qatar Residential Filters Market Estimates and Forecasts, By Efficiency (2020-2032) (USD Billion)
10.5.1.10 Rest of Middle East
10.5.1.10.1 Rest of Middle East Residential Filters Market Estimates and Forecasts, By Product Type (2020-2032) (USD Billion)
10.5.1.10.2 Rest of Middle East Residential Filters Market Estimates and Forecasts, By Application (2020-2032) (USD Billion)
10.5.1.10.3 Rest of Middle East Residential Filters Market Estimates and Forecasts, By Efficiency (2020-2032) (USD Billion)
10.5.2 Africa
10.5.2.1 Trends Analysis
10.5.2.2 Africa Residential Filters Market Estimates and Forecasts, by Country (2020-2032) (USD Billion)
10.5.2.3 Africa Residential Filters Market Estimates and Forecasts, By Product Type (2020-2032) (USD Billion)
10.5.2.4 Africa Residential Filters Market Estimates and Forecasts, By Application (2020-2032) (USD Billion)
10.5.2.5 Africa Residential Filters Market Estimates and Forecasts, By Efficiency (2020-2032) (USD Billion)
10.5.2.6 South Africa
10.5.2.6.1 South Africa Residential Filters Market Estimates and Forecasts, By Product Type (2020-2032) (USD Billion)
10.5.2.6.2 South Africa Residential Filters Market Estimates and Forecasts, By Application (2020-2032) (USD Billion)
10.5.2.6.3 South Africa Residential Filters Market Estimates and Forecasts, By Efficiency (2020-2032) (USD Billion)
10.5.2.7 Nigeria
10.5.2.7.1 Nigeria Residential Filters Market Estimates and Forecasts, By Product Type (2020-2032) (USD Billion)
10.5.2.7.2 Nigeria Residential Filters Market Estimates and Forecasts, By Application (2020-2032) (USD Billion)
10.5.2.7.3 Nigeria Residential Filters Market Estimates and Forecasts, By Efficiency (2020-2032) (USD Billion)
10.5.2.8 Rest of Africa
10.5.2.8.1 Rest of Africa Residential Filters Market Estimates and Forecasts, By Product Type (2020-2032) (USD Billion)
10.5.2.8.2 Rest of Africa Residential Filters Market Estimates and Forecasts, By Application (2020-2032) (USD Billion)
10.5.2.8.3 Rest of Africa Residential Filters Market Estimates and Forecasts, By Efficiency (2020-2032) (USD Billion)
10.6 Latin America
10.6.1 Trends Analysis
10.6.2 Latin America Residential Filters Market Estimates and Forecasts, by Country (2020-2032) (USD Billion)
10.6.3 Latin America Residential Filters Market Estimates and Forecasts, By Product Type (2020-2032) (USD Billion)
10.6.4 Latin America Residential Filters Market Estimates and Forecasts, By Application (2020-2032) (USD Billion)
10.6.5 Latin America Residential Filters Market Estimates and Forecasts, By Efficiency (2020-2032) (USD Billion)
10.6.6 Brazil
10.6.6.1 Brazil Residential Filters Market Estimates and Forecasts, By Product Type (2020-2032) (USD Billion)
10.6.6.2 Brazil Residential Filters Market Estimates and Forecasts, By Application (2020-2032) (USD Billion)
10.6.6.3 Brazil Residential Filters Market Estimates and Forecasts, By Efficiency (2020-2032) (USD Billion)
10.6.7 Argentina
10.6.7.1 Argentina Residential Filters Market Estimates and Forecasts, By Product Type (2020-2032) (USD Billion)
10.6.7.2 Argentina Residential Filters Market Estimates and Forecasts, By Application (2020-2032) (USD Billion)
10.6.7.3 Argentina Residential Filters Market Estimates and Forecasts, By Efficiency (2020-2032) (USD Billion)
10.6.8 Colombia
10.6.8.1 Colombia Residential Filters Market Estimates and Forecasts, By Product Type (2020-2032) (USD Billion)
10.6.8.2 Colombia Residential Filters Market Estimates and Forecasts, By Application (2020-2032) (USD Billion)
10.6.8.3 Colombia Residential Filters Market Estimates and Forecasts, By Efficiency (2020-2032) (USD Billion)
10.6.9 Rest of Latin America
10.6.9.1 Rest of Latin America Residential Filters Market Estimates and Forecasts, By Product Type (2020-2032) (USD Billion)
10.6.9.2 Rest of Latin America Residential Filters Market Estimates and Forecasts, By Application (2020-2032) (USD Billion)
10.6.9.3 Rest of Latin America Residential Filters Market Estimates and Forecasts, By Efficiency (2020-2032) (USD Billion)
11. Company Profiles
11.1 3M Company
11.1.1 Company Overview
11.1.2 Financial
11.1.3 Products/ Services Offered
11.1.4 SWOT Analysis
11.2 Honeywell International Inc.
11.2.1 Company Overview
11.2.2 Financial
11.2.3 Products/ Services Offered
11.2.4 SWOT Analysis
11.3 Pentair plc
11.3.1 Company Overview
11.3.2 Financial
11.3.3 Products/ Services Offered
11.3.4 SWOT Analysis
11.4 Unilever Group (Pureit)
11.4.1 Company Overview
11.4.2 Financial
11.4.3 Products/ Services Offered
11.4.4 SWOT Analysis
11.5 Culligan International Company
11.5.1 Company Overview
11.5.2 Financial
11.5.3 Products/ Services Offered
11.5.4 SWOT Analysis
11.6 Coway Co. Ltd.
11.6.1 Company Overview
11.6.2 Financial
11.6.3 Products/ Services Offered
11.6.4 SWOT Analysis
11.7 Amway Corporation
11.7.1 Company Overview
11.7.2 Financial
11.7.3 Products/ Services Offered
11.7.4 SWOT Analysis
11.8 Blueair
11.8.1 Company Overview
11.8.2 Financial
11.8.3 Products/ Services Offered
11.8.4 SWOT Analysis
11.9 Eureka Forbes Ltd.
11.9.1 Company Overview
11.9.2 Financial
11.9.3 Products/ Services Offered
11.9.4 SWOT Analysis
11.10 Kent RO Systems Ltd.
11.10.1 Company Overview
11.10.2 Financial
11.10.3 Products/ Services Offered
11.10.4 SWOT Analysis
12. Use Cases and Best Practices
13. Conclusion
An accurate research report requires proper strategizing as well as implementation. There are multiple factors involved in the completion of good and accurate research report and selecting the best methodology to compete the research is the toughest part. Since the research reports we provide play a crucial role in any company’s decision-making process, therefore we at SNS Insider always believe that we should choose the best method which gives us results closer to reality. This allows us to reach at a stage wherein we can provide our clients best and accurate investment to output ratio.
Each report that we prepare takes a timeframe of 350-400 business hours for production. Starting from the selection of titles through a couple of in-depth brain storming session to the final QC process before uploading our titles on our website we dedicate around 350 working hours. The titles are selected based on their current market cap and the foreseen CAGR and growth.
The 5 steps process:
Step 1: Secondary Research:
Secondary Research or Desk Research is as the name suggests is a research process wherein, we collect data through the readily available information. In this process we use various paid and unpaid databases which our team has access to and gather data through the same. This includes examining of listed companies’ annual reports, Journals, SEC filling etc. Apart from this our team has access to various associations across the globe across different industries. Lastly, we have exchange relationships with various university as well as individual libraries.
Step 2: Primary Research
When we talk about primary research, it is a type of study in which the researchers collect relevant data samples directly, rather than relying on previously collected data. This type of research is focused on gaining content specific facts that can be sued to solve specific problems. Since the collected data is fresh and first hand therefore it makes the study more accurate and genuine.
We at SNS Insider have divided Primary Research into 2 parts.
Part 1 wherein we interview the KOLs of major players as well as the upcoming ones across various geographic regions. This allows us to have their view over the market scenario and acts as an important tool to come closer to the accurate market numbers. As many as 45 paid and unpaid primary interviews are taken from both the demand and supply side of the industry to make sure we land at an accurate judgement and analysis of the market.
This step involves the triangulation of data wherein our team analyses the interview transcripts, online survey responses and observation of on filed participants. The below mentioned chart should give a better understanding of the part 1 of the primary interview.
Part 2: In this part of primary research the data collected via secondary research and the part 1 of the primary research is validated with the interviews from individual consultants and subject matter experts.
Consultants are those set of people who have at least 12 years of experience and expertise within the industry whereas Subject Matter Experts are those with at least 15 years of experience behind their back within the same space. The data with the help of two main processes i.e., FGDs (Focused Group Discussions) and IDs (Individual Discussions). This gives us a 3rd party nonbiased primary view of the market scenario making it a more dependable one while collation of the data pointers.
Step 3: Data Bank Validation
Once all the information is collected via primary and secondary sources, we run that information for data validation. At our intelligence centre our research heads track a lot of information related to the market which includes the quarterly reports, the daily stock prices, and other relevant information. Our data bank server gets updated every fortnight and that is how the information which we collected using our primary and secondary information is revalidated in real time.
Step 4: QA/QC Process
After all the data collection and validation our team does a final level of quality check and quality assurance to get rid of any unwanted or undesired mistakes. This might include but not limited to getting rid of the any typos, duplication of numbers or missing of any important information. The people involved in this process include technical content writers, research heads and graphics people. Once this process is completed the title gets uploader on our platform for our clients to read it.
Step 5: Final QC/QA Process:
This is the last process and comes when the client has ordered the study. In this process a final QA/QC is done before the study is emailed to the client. Since we believe in giving our clients a good experience of our research studies, therefore, to make sure that we do not lack at our end in any way humanly possible we do a final round of quality check and then dispatch the study to the client.
Key Segments
By Product Type
Air Filter
Water Filter
By Application
Single Family
Multi Family
By Efficiency
MERV 1-4
MERV 6-10
MERV 10-13
MERV 14-16
MERV 17-20
Request for Segment Customization as per your Business Requirement: Segment Customization Request
Regional Coverage
North America
US
Canada
Mexico
Europe
Eastern Europe
Poland
Romania
Hungary
Turkey
Rest of Eastern Europe
Western Europe
Germany
France
UK
Italy
Spain
Netherlands
Switzerland
Austria
Rest of Western Europe
Asia Pacific
China
India
Japan
South Korea
Vietnam
Singapore
Australia
Rest of Asia Pacific
Middle East & Africa
Middle East
UAE
Egypt
Saudi Arabia
Qatar
Rest of the Middle East
Africa
Nigeria
South Africa
Rest of Africa
Latin America
Brazil
Argentina
Colombia
Rest of Latin America
Request for Country Level Research Report: Country Level Customization Request
Available Customization
With the given market data, SNS Insider offers customization as per the company’s specific needs. The following customization options are available for the report:
Product Analysis
Criss-Cross segment analysis (e.g. Product X Application)
Product Matrix which gives a detailed comparison of product portfolio of each company
Geographic Analysis
Additional countries in any of the regions
Company Information
Detailed analysis and profiling of additional market players (Up to five)
The Welding Electrodes Market size was estimated at USD 3.4 billion in 2023 and is expected to reach USD 4.47 billion By 2032 at a CAGR of 3.1% during the forecast period of 2024-2032.
The Cordless Power Tools Market Size was valued at USD 19.08 Bn in 2023 and is expected to reach USD 44.77 Bn by 2032 and grow at a CAGR of 9.94 % over the forecast period 2024-2032.
The Induction Furnace Market Size was USD 1.46 billion in 2023 & is supposed to arrive at USD 2.37 billion by 2032 with a growing CAGR of 5.58% by 2024-2032.
The Safety Valves Market size was estimated at USD 4.86 Billion in 2023 and is expected to reach USD 8.50 Billion by 2032 with a growing CAGR of 6.42% during the forecast period of 2024-2032.
The Agricultural Equipment Market size was valued at USD 164.5 Bn in 2023 and is expected to reach USD 261.38 Bn by 2032 and grow at a CAGR of 5.28 % over the forecast period 2024-2032.
The CNC Machine Tools Market size was valued at USD 95.29 Billion in 2023. It is expected to grow to USD 141.61 Billion by 2032 and grow at a CAGR of 4.5% over the forecast period of 2024-2032.
Hi! Click one of our member below to chat on Phone