Resource Circulation Equipment Market Report Scope & Overview:
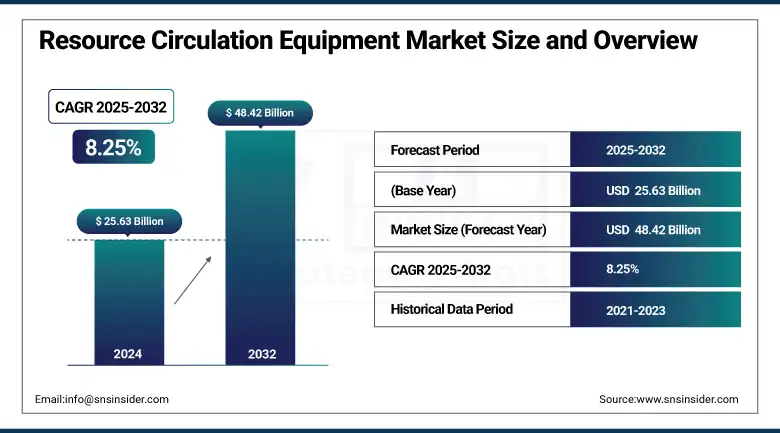
The Resource Circulation Equipment Market size was valued at USD 25.63 billion in 2024 and is expected to reach USD 48.42 billion by 2032, growing at a CAGR of 8.25% over the forecast period of 2025-2032.
The resource circulation equipment market supports the infrastructure and machinery through balers, shredders, separators, and sorting systems that process end-of-life materials to be reused in the circular supply chain. Globally increasing focus on sustainability, along with the incorporation of innovative technologies including AI, IoT, robotics, and data analytics, is driving the industry. This is leading to a trend towards automation and a high level of efficiency in sorting systems for all types of complex waste streams, from e-waste, EV battery materials, while at the same time ensuring low energy consumption and modularity for scaling.
Industrial and electronics recycling have emerged as key focus areas, as frequent upgrades in consumer electronics generate increasing volumes of valuable and hazardous components, boosting demand for specialized separation equipment. In the metals space, tools for recovering metals used in automotive, construction, and electrical applications are picking up steam amid pressure on resources and regulations. According to research, manufacturers are also focusing on circular supply chain equipment so as to be able to have closed-loop production, lower the procurement cost, achieve up to 30% material savings, and also reduce greenhouse gas emissions.
To Get more information On Resource Circulation Equipment Market - Request Free Sample Report
Strategic industry dynamics comprise growing collaboration between technology providers, waste stakeholders, and research organizations, and production of system components to aid in regulatory compliance and strategic raw-material recycling. The global resource circulation equipment Market is witnessing stable expansion, backed by strong market growth trends and innovations within the resource circulation equipment industry.
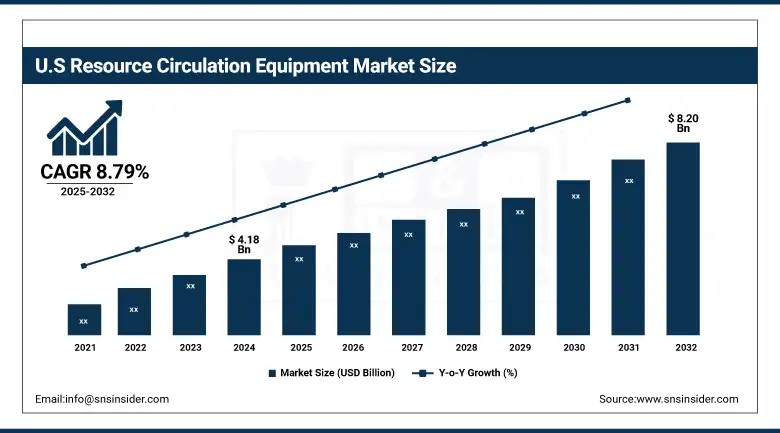
The United States leads the North American resource circulation equipment market, reaching USD 4.18 billion in 2024 and projected to grow to USD 8.20 billion by 2032 at a CAGR of 8.79%. Growth is driven by rising sustainability initiatives, strict environmental regulations, and increasing investments in advanced recycling technologies. Strong industrial infrastructure and technological advancements further support market expansion.
Resource Circulation Equipment Market Dynamics:
Drivers
-
Circular Economy Push Accelerates Demand for Advanced Resource Circulation Equipment
The rising emphasis on sustainability and circular economy practices is a key driver for the resource circulation equipment market. There is a growing investment from governments and industry in technologies for minimising waste, recovering materials, and realizing closed-loop production cycles. For instance, Extended Producer Responsibility (EPR) policies require producers to take responsibility for the end-of-life phase of their products while promoting the implementation of recycling and recovery systems. According to the research, 60% of large-scale manufacturing and industrial firms have sustainability strategies in place, considering it a must-have strategy around resource efficiency and waste removal. In addition, more than 80 national governments now have regulations or roadmaps advancing circular economy principles. Such trends are propelling the roll out of higher complexity machinery for recovery of products for remanufacturing and at the material level across sectors.
Restraint
-
High Capital Investment Slows Adoption of Advanced Recycling Technologies in the Resource Circulation Market
High Capital Expenditure (CapEx), more advanced systems like automated sorters, shredders, and pyrolysis units demand hefty upfront investment not just in machinery, but also in infrastructure upgrades, skilled labor, and training. Such exorbitant cost makes it very difficult for the SMEs and operators in developing parts of the globe to even think of shifting to low carbon, especially when funding and other government incentives are hard to come by. Additionally, over 45% of companies postpone equipment upgrades owing to expensive return on investment costs. This financial pressure stymies the adoption of efficient, sustainable recycling technologies, curtailing progress towards the circular economy.
Resource Circulation Equipment Market Segmentation Analysis:
By Product
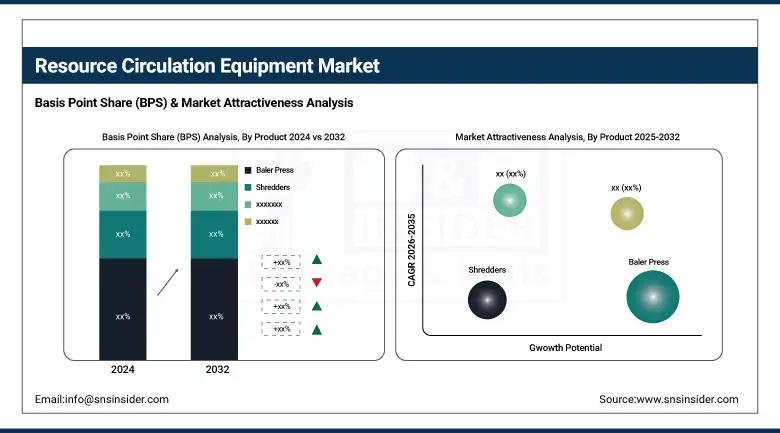
The baler press segment dominated the market and accounted for 25% of the resource circulation equipment market share. The largest share of this dominance is attributable to the high usage of baler presses at recycling facilities, where recyclable materials, including paper, plastic, and metal, are compressed and bundled for better storage and reduced transportation costs. That is why nowadays, more and more industries and municipalities are investing in balers as they do not require skilled labor to operate them, and they can be used in automated waste handling systems. Also, rising circular economy initiatives and government directives about reducing landfills have further supported the market for baler presses as a key part of effective resource circulation infrastructure.
Shredders represent the fastest-growing product segment in the resource circulation equipment market. He adoption of waste shredders is rising owing to increasing demand for efficient size reduction of waste and separation of materials in various industries. For the processing of metals, plastics, electronics, and other hazardous waste, as regulations surrounding the management of electronic waste and industrial scrap become stricter, shredders are more and more often used. Today, modern shredding technologies are both high-throughput and energy-efficient, thus making them an attractive option for not only large-scale recycling firms but also small waste processors too. Additionally, the high rate of growth of this segment is supported by the demand for data destruction during electronics recycling and the secure disposal of sensitive components.
By Application
The Electrical & Electronics segment led the application category with a dominant 34% market share in 2024. This is due to the worldwide increase in e-waste generation resulting from rapid technological evolution, shorter product life cycles, and high consumer turnover rates of electronic products. Recycling e-waste also needs special machines such as balers, shredders, and separators to obtain precious metals such as rare earth, copper, and plastics. The demand for resource circulation equipment for e-waste is increasing, as governmental authorities and environmental agencies around the world, including developed economies, continue implementing stringent regulations regarding e-waste management and promote the establishment of dedicated electronics recycling plants.
The Metal segment is the fastest-growing application in the resource circulation equipment market. Driven by growing emphasis on sustainability, energy savings, and the economic value of scrap metals. For example, recycling metals like aluminum, steel, and copper uses far less energy overall compared to the environmental impact of mining virgin ores, which also makes it a method to reduce carbon emissions as well. Industrial and municipal segments are focusing on shredders, balers, and again separators used for metal. Furthermore, metal waste from the construction, automotive, and manufacturing industries is another reason that is expected to increase the demand for the revision of metal recycling equipment. The growth of this segment is also driven by the advancements in automation as well as sorting technologies.
Resource Circulation Equipment Market Regional Outlook:
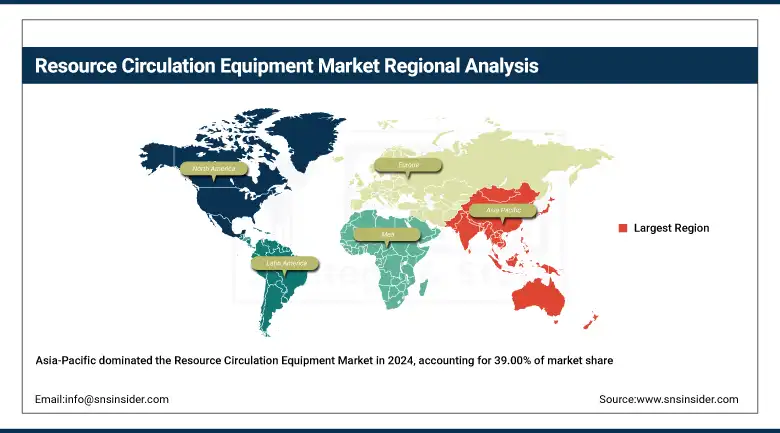
Asia-Pacific holds the dominant position in the resource circulation equipment market, accounting for 39.00% of the global share in 2024. The high proportion of regional leadership is due to rapid industrialization, urbanization, and increasing waste generation in the region, particularly in China, India, and Japan. Increase in adoption due to government initiatives supporting circular economy models and increasing investment in waste management infrastructure and recycling technologies. In addition, simply because of the several prominent gear producers and the growing environmental consciousness among industries, the area has cemented its position. The rising need for effective recycling and waste treatment tools across Asia-Pacific is attributed to each the private and non-private sectors' growing focus on sustainability and compliance with environmental laws.
Get Customized Report as per Your Business Requirement - Enquiry Now
China dominates the resource circulation equipment market due to its vast industrial base and large-scale waste generation. There is a strong drive by the government for sustainability, including the “zero-waste city” initiative, which drives demand for advanced recycling technologies. Infrastructure investments and stringent environmental regulations will drive the growth of the market.
North America is witnessing the fastest growth in the resource circulation equipment market, fueled by stringent environmental regulations, advanced technological adoption, and a strong emphasis on sustainable development. Innovations in recycling in the U.S. and Canada have continued investments in smart recycling systems like AI-enhanced separators and energy-efficient shredders. Besides, wide-ranging circular economy practices are also shaping up due to government funding and corporate ESG (Environmental, Social and Governance) commitments, in high-profile sectors like electronics, automotive, and construction. Initiatives that are leaning towards zero-waste targets combined with increased demand for infrastructure upgrades have made it a profitable market in terms of equipment supply. The rapid acceleration of North America’s growth path is due to a mature industrial base and emphasis on innovation.
Europe holds a substantial share of the global resource circulation equipment market, owing to its early adoption of circular economy principles and rigorous environmental regulations. Driving waste management strategy across the EU has been the establishment of the Green Deal and Waste Framework Directive. Germany, France, and the Netherlands have among the highest recycling rates in the world and a reliable need for advanced sorting, baling, and shredding technologies. Additionally, Europe is further cementing its position with public-private partnerships and investment in funding research and development of new solutions for waste treatment. While perhaps not the fastest growing, the region is still a robust, mature, and highly penetrated sustainable waste processing infrastructure and innovation-driven market.
Key Players in the Resource Circulation Equipment Market are:
Resource Circulation Equipment Companies are Metso, Danieli Centro Recycling, ELDAN Recycling, BHS Sonthofen, LEFORT GROUP, Marathon Equipment, General Kinematics, Kiverco, American Baler, and The CP Group.
Recent Development:
-
In November 2023, Mexico’s Deacero ordered five new shredder plants from Danieli Centro Recycling to enhance its scrap processing capacity. Four plants will feature 2,000 hp shredders, while one will use a 4,000 hp model with up to 100 tph output. These shredders include energy-efficient inverter drives, cutting operational costs by up to 15%. The output will supply Deacero’s Danieli-based meltshops in Mexico.
-
In June 2024, UK-based NWH Group became the first company to install Kiverco’s new KS520 modular recycling plant at its Newcastle site. The plant features enhanced screening and flexibility, allowing higher throughput and improved material recovery. This installation supports NWH's goal of increasing efficiency and landfill diversion.
| Report Attributes | Details |
|---|---|
| Market Size in 2024 | USD 25.63 Billion |
| Market Size by 2032 | USD 48.32 Billion |
| CAGR | CAGR of 8.25% From 2025 to 2032 |
| Base Year | 2024 |
| Forecast Period | 2025-2032 |
| Historical Data | 2021-2023 |
| Report Scope & Coverage | Market Size, Segments Analysis, Competitive Landscape, Regional Analysis, DROC & SWOT Analysis, Forecast Outlook |
| Key Segments | • By Product (Baler, Press, Shredders, Granulators, Agglomerators, Shears, Separators, Extruders, Others) • By Application (Automotive, Construction, Electrical & Electronics, Paper, Plastic & Polymers, Metal, Oil & Gas, Others) |
| Regional Analysis/Coverage | North America (US, Canada, Mexico), Europe (Germany, France, UK, Italy, Spain, Poland, Turkey, Rest of Europe), Asia Pacific (China, India, Japan, South Korea, Singapore, Australia, Rest of Asia Pacific), Middle East & Africa (UAE, Saudi Arabia, Qatar, South Africa, Rest of Middle East & Africa), Latin America (Brazil, Argentina, Rest of Latin America) |
| Company Profiles | Metso, Danieli Centro Recycling, ELDAN Recycling, BHS Sonthofen, LEFORT GROUP, Marathon Equipment, General Kinematics, Kiverco, American Baler, and The CP Group. |
Frequently Asked Questions
The Asia-Pacific region dominated the Resource Circulation Equipment market in 2024.
The “Baler Press” segment dominated the Resource Circulation Equipment market.
Circular Economy Push Accelerates Demand for Advanced Resource Circulation Equipment
The Resource Circulation Equipment market was USD 25.63 billion in 2024 and is expected to reach USD 48.32 billion by 2032.
The Resource Circulation Equipment market is expected to grow at a CAGR of 8.25% from 2025 to 2032.
Get in Touch
