Retail Audience Measurement Solutions Market Report Scope & Overview:

The Retail Audience Measurement Solutions Market size was valued at USD 4.2 billion in 2024 and is expected to reach USD 17.2 billion by 2032, growing at a CAGR of 19.28% during 2025-2032.

Retail Audience Measurement Solutions Market growth is driven by the increasing demand for data-driven insights to enhance customer engagement, optimize in-store experiences, and drive marketing ROI. As physical retail competes with digital platforms, real-time audience analytics—enabled by sensors, cameras, and AI algorithms—are becoming essential for understanding customer behavior. Retailers are increasingly adopting these solutions to measure footfall, dwell time, and demographics, leading to smarter store layouts and targeted promotions. The market also benefits from the growing integration of IoT and smart signage technologies. 

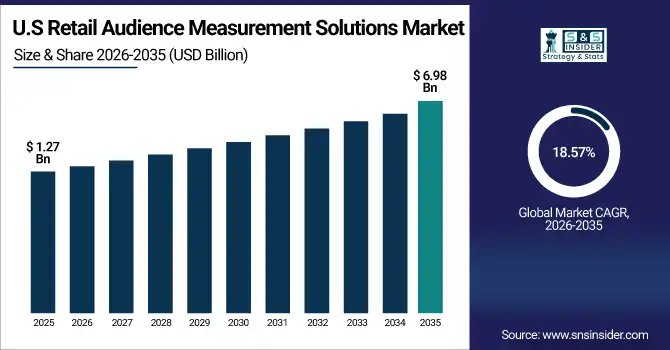
In the U.S. Retail Audience Measurement Solutions Market, growth is fueled by rising demand for in-store analytics, AI-driven consumer insights, and integration of IoT-enabled tracking systems. The market was valued at USD 1.15 billion in 2024 and is projected to reach USD 4.47 billion by 2032, growing at a CAGR of  18.57% during the forecast period. Key Retail Audience Measurement Solutions Market trend includes real-time footfall analytics, demographic profiling, and increased adoption of computer vision for shopper behavior analysis.

Retail Audience Measurement Solutions Market Dynamics:

Drivers:

Growing Need for In-Store Analytics Leads to Higher Adoption of Audience Measurement Solutions

Retailers are increasingly seeking advanced solutions to gain real-time visibility into consumer behavior within physical stores. Audience measurement tools powered by AI, sensors, and computer vision allow businesses to capture key metrics like footfall, dwell time, and engagement levels, which help optimize merchandising, staffing, and store layouts. As brick-and-mortar stores aim to compete with data-rich online channels, the adoption of these technologies has surged. Moreover, retailers are integrating these tools with CRM and marketing platforms for personalized targeting. This data-driven approach is enabling enhanced customer experiences, improved conversion rates, and measurable ROI, positioning audience measurement as a critical investment in retail transformation.

Retailers combining foot traffic data with personalized marketing have seen conversion rates rise by 10–15%, demonstrating how in-store analytics tangibly improve sales performance.

Restraints:

Rising Privacy Concerns Restrict the Deployment of Surveillance-Based Measurement Tools

One of the most significant restraints facing the market is the rising concern over consumer privacy and data security. Retail audience measurement often involves video analytics, facial recognition, and behavioral tracking, which can raise red flags regarding personal data collection. Stringent regulations such as GDPR in Europe and CCPA in California impose strict compliance requirements on how data is gathered, stored, and used. Failure to comply can result in heavy penalties and reputational damage. These legal and ethical issues can slow down technology adoption, especially among privacy-conscious brands or regions with strong regulatory frameworks, limiting the full-scale deployment of audience measurement solutions.

44% of U.S. consumers worry about how AI cameras and surveillance are using their personal data, signaling significant discomfort with in‑store tracking technologies.

Opportunities:

Expansion of IoT and Smart Retail Infrastructure Enables Scalable Audience Insights

The growing proliferation of IoT devices and smart retail infrastructure presents a major opportunity for the market. Audience measurement solutions are increasingly being embedded into digital signage, connected cameras, and interactive kiosks to enable real-time data collection and automated content delivery. Retailers are leveraging this integration to create adaptive in-store environments where promotions, lighting, or displays change based on customer presence and behavior. As 5G enables faster data transfer and edge computing enhances on-site analytics, the market is set to benefit from seamless connectivity and automation. This trend is expected to open new use cases across malls, airports, QSRs, and luxury retail formats.

61% of retailers have adopted IoT technologies—such as smart shelves and in-store sensors—to enhance inventory management and track customer behavior in real-time

Challenges:

High Initial Investment Limits Adoption Among Small and Mid-Sized Retailers

Despite the benefits, the initial setup and maintenance of audience measurement systems can be expensive, particularly for small and mid-sized retailers. These solutions require high-quality hardware—like sensors, beacons, and AI-powered cameras—along with robust software platforms and analytics capabilities. Additionally, integrating these tools with legacy POS or CRM systems can add complexity and cost. Ongoing maintenance, updates, and technical support further strain operational budgets. Without clear short-term ROI, many retailers hesitate to invest. Moreover, the lack of standardization across technologies leads to interoperability issues, making it harder to scale solutions across multiple store locations, which may hamper wider adoption.

Retail Audience Measurement Solutions Market Segmentation Analysis:
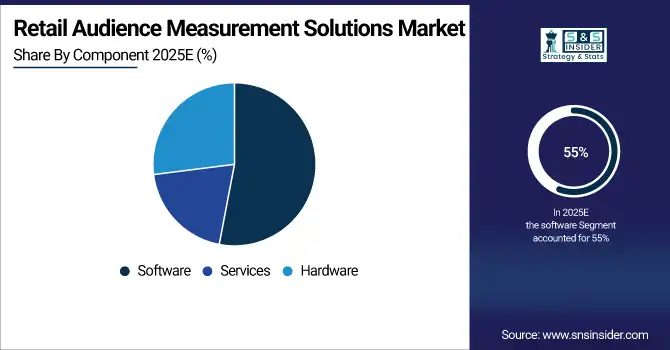
By Component:

In 2024, the software segment dominated the market and accounted for 55% of the retail audience measurement solutions market share. This growth is driven by the rising adoption of AI-based analytics, real-time dashboards, and customer behavior visualization tools. Retailers are investing in scalable software platforms to gain actionable insights, improve in-store strategies, and integrate with CRM and marketing systems for data-driven decision-making.

In August 2025, Nielsen and WPP Media announced a partnership to embed Nielsen ONE’s audience insights into WPP’s Open Media Studio. This software integration enables unified, cross-platform measurement across TV, streaming, audio, and advertising—enhancing data-driven campaign optimization.

The services segment is expected to register the fastest CAGR in the retail audience measurement solutions market. The surge is fueled by growing demand for managed services, system integration, installation, and real-time support. As retailers prioritize seamless deployment, ongoing analytics optimization, and maintenance of advanced measurement systems, service providers are playing a crucial role in enabling scalable, end-to-end solutions across multiple store formats.

By Application:

In 2024, the customer traffic & footfall segment dominated the retail audience measurement solutions market and accounted for a significant revenue share.
The segment’s growth is fueled by retailers’ need to monitor visitor trends, peak hours, and footfall density. These insights enable staffing optimization, marketing effectiveness, and store performance benchmarking—making footfall tracking a core application in physical retail analytics.

Store layout & planogram optimization segment is expected to register the fastest CAGR in the retail audience measurement solutions market.
Growth is driven by rising demand for real-time spatial analytics to enhance product placement and aisle effectiveness. Retailers are leveraging sensor and vision-based tools to analyze traffic flow, dwell zones, and layout efficiency, resulting in better merchandising strategies and increased sales conversions.

By Data Capture Technology:

In 2024, the video analytics segment dominated the retail audience measurement solutions market and accounted for a significant revenue share. Its dominance is driven by the ability to deliver real-time insights on customer movement, engagement, and behavior using AI-powered CCTV and smart camera systems. Retailers favor video analytics for its scalability, integration with existing infrastructure, and precision in tracking multiple in-store KPIs simultaneously.

The mobile device tracking segment is expected to register the fastest CAGR in the retail audience measurement solutions market. This growth is fueled by the widespread use of smartphones and Wi-Fi/Bluetooth-enabled tracking, allowing retailers to anonymously monitor footfall patterns, dwell time, and customer journeys. It provides high accuracy at low cost, making it especially attractive for large retail chains and shopping malls seeking location-based insights.

By End-Use:

In 2024, the supermarkets & hypermarkets segment dominated the retail audience measurement solutions market and accounted for a significant revenue share. This leadership stems from their expansive floor plans, high footfall, and need for real-time analytics to optimize staffing, product placement, and customer flow. These formats heavily invest in audience measurement to boost operational efficiency and improve in-store marketing strategies.

The department stores segment is expected to register the fastest CAGR in the retail audience measurement solutions market. Growth is driven by the segment's focus on enhancing customer experience and tracking multi-zone shopper behavior across diverse product categories. Retailers are adopting advanced measurement tools to optimize layout, personalize promotions, and align merchandising with real-time customer interaction data.

Retail Audience Measurement Solutions Market Regional Outlook:
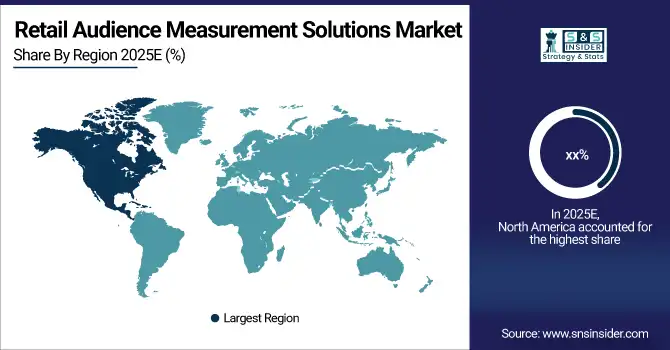
In 2024, the North America region dominated the retail audience measurement solutions market and accounted for a significant revenue share. The dominance is attributed to widespread adoption of AI-powered analytics, strong retail digitization, and the presence of leading solution providers. Retailers in the U.S. and Canada prioritize data-driven strategies, investing in advanced measurement tools to enhance customer engagement, optimize store performance, and drive omnichannel growth.

According to the retail audience measurement solutions market analysis, the Asia Pacific region is expected to register the fastest CAGR in the retail audience measurement solutions market. Rapid urbanization, expanding organized retail, and increasing technology penetration are driving the adoption of smart audience tracking tools across emerging economies like India and Southeast Asia. Retailers are embracing IoT, mobile analytics, and digital signage integration to modernize operations and deliver localized, real-time insights across diverse consumer environments.

The European retail audience measurement solutions market is growing due to increasing adoption of AI-powered in-store analytics, compliance with strict data privacy regulations, and rising investment in retail digitization. Retailers are leveraging real-time consumer behavior tracking to optimize store layouts, marketing strategies, and overall customer engagement.

Germany dominates the European market owing to its mature retail ecosystem, strong demand for automation, and widespread use of video analytics and smart sensors. Retailers are focused on enhancing operational efficiency and personalizing in-store experiences, driving continued investment in advanced audience measurement technologies.

Key Players:

The major generative AI in the chemical market companies are Advertima, Broox Technologies S.L.U., Nielsen, Dor Technologies, Engagis Pty Ltd, Macnica, Inc., AdQuick, Kantar, Quividi, Raydiant (Sightcorp), Convenience StoresNext, V‑Count, Walkbase, Placer.ai, Cuebiq, AdMobilize, AllUnite, Aislelabs, IMS (Retail Measurement), Scandit and others.

Recent Developments:

  • In May 2025, Advertima partnered with Majid Al Futtaim’s Precision Media to deploy AI-powered audience activation solutions across Carrefour stores in the UAE, enabling real-time, privacy-safe in-store media targeting.

  • In June 2025, Quividi integrated its real-time audience analytics technology into BrightSign’s digital signage systems, enhancing personalized content delivery and measurement capabilities in retail environments.

Retail Audience Measurement Solutions Market Report Scope:

Report Attributes

Details

Market Size in 2024

USD 4.2 Billion

Market Size by 2032

USD  17.2 Billion

CAGR

CAGR of 19.28 % From 2025 to 2032

Base Year

2024

Forecast Period

2025-2032

Historical Data

2021-2023

Report Scope & Coverage

Market Size, Segments Analysis, Competitive  Landscape, Regional Analysis, DROC & SWOT Analysis, Forecast Outlook

Key Segments

•  By Component (Hardware [Camera, Wi-Fi/Bluetooth Beacons, Sensors, Media Player, Others], Software, Services),
• By Application (Customer Traffic & Footfall, Queue Management, Store Layout & Planogram Optimization, Demographic & Behavioral Profiling),
• By Data Capture Technology (Facial Recognition, Video Analytics, Infrared Sensors, Mobile Device Tracking, RFID),
• By End-Use (Supermarkets & Hypermarkets, Convenience Stores, Department Stores, Specialty Stores, Others)

Regional Analysis/Coverage

North America (US, Canada), Europe (Germany, France, UK, Italy, Spain, Poland, Rest of Europe), Asia Pacific (China, India, Japan, South Korea, ASEAN Countries, Australia, Rest of Asia Pacific), Middle East & Africa (UAE, Saudi Arabia, Qatar,Egypt, South Africa, Rest of Middle East & Africa), Latin America (Brazil, Argentina, Mexico, Colombia, Rest of Latin America)

Company Profiles

Advertima, Broox Technologies S.L.U., Nielsen, Dor Technologies, Engagis Pty Ltd, Macnica, Inc., AdQuick, Kantar, Quividi, Raydiant (Sightcorp), Convenience StoresNext, V‑Count, Walkbase, Placer.ai, Cuebiq, AdMobilize, AllUnite, Aislelabs, IMS (Retail Measurement), Scandit and others in the report

Table Of Contents

1. Introduction

1.1 Market Definition & Scope

 1.2 Research Assumptions & Abbreviations

 1.3 Research Methodology

2. Executive Summary

2.1 Market Snapshot

 2.2 Market Absolute $ Opportunity Assessment & Y-o-Y Analysis, 2021–2032

 2.3 Market Size & Forecast, By Segmentation, 2021–2032

  2.3.1 Market Size By Component

  2.3.2 Market Size By Application

2.3.3 Market Size By Data Capture Technology

2.3.4 Market Size By End-User

 2.4 Market Share & Bps Analysis By Region, 2024

 2.5 Industry Growth Scenarios – Conservative, Likely & Optimistic

 2.6 Industry CxO’s Perspective

3. Market Overview

3.1 Market Dynamics

  3.1.1 Drivers

  3.1.2 Restraints

  3.1.3 Opportunities

  3.1.4 Key Market Trends

 3.2 Industry PESTLE Analysis

 3.3 Key Industry Forces (Porter’s) Impacting Market Growth

 3.4 Industry Supply Chain Analysis

  3.4.1 Raw Material Suppliers

  3.4.2 Manufacturers

  3.4.3 Distributors/Suppliers

  3.4.4 Customers/End-Userrs

 3.5 Industry Life Cycle Assessment

 3.6 Parent Market Overview

 3.7 Market Risk Assessment

4. Statistical Insights & Trends Reporting

4.1 Adoption & Deployment Metrics

4.1.1 Share of retail stores implementing audience measurement technologies (e.g., footfall counters, Wi-Fi tracking, thermal sensors)

4.1.2 Year-over-year growth in deployment of audience analytics tools (%)

4.1.3 Average number of measurement devices installed per store (by format: flagship, outlet, mall kiosk)

4.1.4 Penetration rate by retailer segment: Apparel, Grocery, Electronics, Home Goods (%)

4.1.5 Global regional deployment spreads (e.g., North America, Europe, APAC, Latin America)

4.2 Customer Behavior & Foot Traffic Insights

4.2.1 Average footfall per store per day, week, or month

4.2.2 Dwell time averages by zone (entrance, aisles, checkout)

4.2.3 Conversion rate: Footfall to purchase (%)

4.2.4 Peak-traffic windows (hourly trends for weekdays vs. weekends)

4.2.5 New vs. repeat visitor ratios per store segment

4.3 Performance & ROI Metrics

4.3.1 Sales uplift attributed to optimized layout or staffing derived from audience insights (%)

4.3.2 Reduction in queue length or wait times driven by analytics (~seconds or minutes)

4.3.3 Average revenue per customer visit post-implementation (USD)

4.3.4 Payback period on audience measurement system investments (months)

4.3.5 Store-level impact on staffing ROI (e.g., optimal scheduling effectiveness)

4.4 Technology Integration & Feature Adoption

4.4.1 Share of solutions integrated with POS, CRM, or inventory management systems (%)

4.4.2 Platforms supporting real-time alerts for crowding, staffing needs, or stockouts (%)

4.4.3 Use of AI-based segmentation (e.g., shopper archetypes, behavior heatmaps)

4.4.4 Sensors supporting omni-channel attribution (physical vs. digital interactions)

4.4.5 Percentage of consolidated dashboards with cross-store comparisons and benchmarking

5. Retail Audience Measurement Solutions Market Segmental Analysis & Forecast, By Component, 2021 – 2032, Value (Usd Billion) & Volume (Unit)

5.1 Introduction

 5.2   Hardware

  5.2.1 Key Trends

  5.2.2 Market Size & Forecast, 2021 – 2032

5.2.3 Camera

  5.2.3.1 Key Trends

  5.2.3.2 Market Size & Forecast, 2021 – 2032

5.2.4 Wi-Fi/Bluetooth Beacons

  5.2.4.1 Key Trends

  5.2.4.2 Market Size & Forecast, 2021 – 2032

5.2.5 Sensors

  5.2.5.1 Key Trends

  5.2.5.2 Market Size & Forecast, 2021 – 2032

5.2.6 Media Player

  5.2.6.1 Key Trends

  5.2.6.2 Market Size & Forecast, 2021 – 2032

5.2.7 Others

  5.2.7.1 Key Trends

  5.2.7.2 Market Size & Forecast, 2021 – 2032

 5.3 Software

  5.3.1 Key Trends

  5.3.2 Market Size & Forecast, 2021 – 2032

 5.4 Services

  5.4.1 Key Trends

  5.4.2 Market Size & Forecast, 2021 – 2032

6. Retail Audience Measurement Solutions Market Segmental Analysis & Forecast, By Application, 2021 – 2032, Value (Usd Billion) & Volume (Unit)

    6.1 Introduction

 6.2 Customer Traffic & Footfall

  6.2.1 Key Trends

  6.2.2 Market Size & Forecast, 2021 – 2032

 6.3 Queue Management

  6.3.1 Key Trends

  6.3.2 Market Size & Forecast, 2021 – 2032

6.4 Store Layout & Planogram Optimization

  6.4.1 Key Trends

  6.4.2 Market Size & Forecast, 2021 – 2032

6.5 Demographic & Behavioral Profiling

  6.5.1 Key Trends

  6.5.2 Market Size & Forecast, 2021 – 2032

7. Retail Audience Measurement Solutions Market Segmental Analysis & Forecast, By Data Capture Technology, 2021 – 2032, Value (Usd Billion) & Volume (Unit)

    7.1 Introduction

 7.2 Facial Recognition

  7.2.1 Key Trends

  7.2.2 Market Size & Forecast, 2021 – 2032

 7.3 Video Analytics

  7.3.1 Key Trends

  7.3.2 Market Size & Forecast, 2021 – 2032

7.4 Infrared Sensors

  7.4.1 Key Trends

  7.4.2 Market Size & Forecast, 2021 – 2032

7.5 Mobile Device Tracking

  7.5.1 Key Trends

  7.5.2 Market Size & Forecast, 2021 – 2032

7.6 RFID

  7.6.1 Key Trends

  7.6.2 Market Size & Forecast, 2021 – 2032

8. Retail Audience Measurement Solutions Market Segmental Analysis & Forecast, By End-User, 2021 – 2032, Value (Usd Billion) & Volume (Unit)

    8.1 Introduction

    8.2 Supermarkets & Hypermarkets

  8.2.1 Key Trends

  8.2.2 Market Size & Forecast, 2021 – 2032

 8.3 Convenience Stores

  8.3.1 Key Trends

  8.3.2 Market Size & Forecast, 2021 – 2032

 8.4 Department Stores

  8.4.1 Key Trends

  8.4.2 Market Size & Forecast, 2021 – 2032

8.5 Specialty Stores

  8.5.1 Key Trends

  8.5.2 Market Size & Forecast, 2021 – 2032

9. Retail Audience Measurement Solutions Market Segmental Analysis & Forecast By Region, 2021 – 2032, Value (Usd Billion) & Volume (Unit)

9.1 Introduction

9.2 North America

 9.2.1 Key Trends

 9.2.2 Retail Audience Measurement Solutions Market Size & Forecast, By Component, 2021 – 2032

 9.2.3 Retail Audience Measurement Solutions Market Size & Forecast, By Application, 2021 – 2032

 9.2.4 Retail Audience Measurement Solutions Market Size & Forecast, By Data Capture Technology, 2021 – 2032

 9.2.5 Retail Audience Measurement Solutions Market Size & Forecast, By End-User, 2021 – 2032

 9.2.6 Retail Audience Measurement Solutions Market Size & Forecast, By Country, 2021 – 2032

  9.2.6.1 USA

   9.2.6.1.1 Retail Audience Measurement Solutions Market Size & Forecast, By Component, 2021 – 2032

   9.2.6.1.2 Retail Audience Measurement Solutions Market Size & Forecast, By Application, 2021 – 2032

   9.2.6.1.3 Retail Audience Measurement Solutions Market Size & Forecast, By Data Capture Technology, 2021 – 2032

   9.2.6.1.4 Retail Audience Measurement Solutions Market Size & Forecast, By End-User, 2021 – 2032

  9.2.6.2 Canada

   9.2.6.2.1 Retail Audience Measurement Solutions Market Size & Forecast, By Component, 2021 – 2032

   9.2.6.2.2 Retail Audience Measurement Solutions Market Size & Forecast, By Application, 2021 – 2032

   9.2.6.2.3 Retail Audience Measurement Solutions Market Size & Forecast, By Data Capture Technology, 2021 – 2032

   9.2.6.2.4 Retail Audience Measurement Solutions Market Size & Forecast, By End-User, 2021 – 2032

9.3 Europe

 9.3.1 Key Trends

 9.3.2 Retail Audience Measurement Solutions Market Size & Forecast, By Component, 2021 – 2032

 9.3.3 Retail Audience Measurement Solutions Market Size & Forecast, By Application, 2021 – 2032

 9.3.4 Retail Audience Measurement Solutions Market Size & Forecast, By Data Capture Technology, 2021 – 2032

 9.3.5 Retail Audience Measurement Solutions Market Size & Forecast, By End-User, 2021 – 2032

 9.3.6 Retail Audience Measurement Solutions Market Size & Forecast, By Country, 2021 – 2032

  9.3.6.1 Germany

   9.3.6.1.1 Retail Audience Measurement Solutions Market Size & Forecast, By Component, 2021 – 2032

   9.3.6.1.2 Retail Audience Measurement Solutions Market Size & Forecast, By Application, 2021 – 2032

   9.3.6.1.3 Retail Audience Measurement Solutions Market Size & Forecast, By Data Capture Technology, 2021 – 2032

   9.3.6.1.4 Retail Audience Measurement Solutions Market Size & Forecast, By End-User, 2021 – 2032

  9.3.6.2 UK

   9.3.6.2.1 Retail Audience Measurement Solutions Market Size & Forecast, By Component, 2021 – 2032

   9.3.6.2.2 Retail Audience Measurement Solutions Market Size & Forecast, By Application, 2021 – 2032

   9.3.6.2.3 Retail Audience Measurement Solutions Market Size & Forecast, By Data Capture Technology, 2021 – 2032

   9.3.6.2.4 Retail Audience Measurement Solutions Market Size & Forecast, By End-User, 2021 – 2032

  9.3.6.3 France

   9.3.6.3.1 Retail Audience Measurement Solutions Market Size & Forecast, By Component, 2021 – 2032

   9.3.6.3.2 Retail Audience Measurement Solutions Market Size & Forecast, By Application, 2021 – 2032

   9.3.6.3.3 Retail Audience Measurement Solutions Market Size & Forecast, By Data Capture Technology, 2021 – 2032

   9.3.6.3.4 Retail Audience Measurement Solutions Market Size & Forecast, By End-User, 2021 – 2032

  9.3.6.4 Italy

   9.3.6.4.1 Retail Audience Measurement Solutions Market Size & Forecast, By Component, 2021 – 2032

   9.3.6.4.2 Retail Audience Measurement Solutions Market Size & Forecast, By Application, 2021 – 2032

   9.3.6.4.3 Retail Audience Measurement Solutions Market Size & Forecast, By Data Capture Technology, 2021 – 2032

   9.3.6.4.4 Retail Audience Measurement Solutions Market Size & Forecast, By End-User, 2021 – 2032

  9.3.6.5 Spain

   9.3.6.5.1 Retail Audience Measurement Solutions Market Size & Forecast, By Component, 2021 – 2032

   9.3.6.5.2 Retail Audience Measurement Solutions Market Size & Forecast, By Application, 2021 – 2032

   9.3.6.5.3 Retail Audience Measurement Solutions Market Size & Forecast, By Data Capture Technology, 2021 – 2032

   9.3.6.5.4 Retail Audience Measurement Solutions Market Size & Forecast, By End-User, 2021 – 2032

  9.3.6.6 Russia

   9.3.6.6.1 Retail Audience Measurement Solutions Market Size & Forecast, By Component, 2021 – 2032

   9.3.6.6.2 Retail Audience Measurement Solutions Market Size & Forecast, By Application, 2021 – 2032

   9.3.6.6.3 Retail Audience Measurement Solutions Market Size & Forecast, By Data Capture Technology, 2021 – 2032

   9.3.6.6.4 Retail Audience Measurement Solutions Market Size & Forecast, By End-User, 2021 – 2032

  9.3.6.7 Poland

   9.3.6.7.1 Retail Audience Measurement Solutions Market Size & Forecast, By Component, 2021 – 2032

   9.3.6.7.2 Retail Audience Measurement Solutions Market Size & Forecast, By Application, 2021 – 2032

   9.3.6.7.3 Retail Audience Measurement Solutions Market Size & Forecast, By Data Capture Technology, 2021 – 2032

   9.3.6.7.4 Retail Audience Measurement Solutions Market Size & Forecast, By End-User, 2021 – 2032

  9.3.6.8 Rest of Europe

   9.3.6.8.1 Retail Audience Measurement Solutions Market Size & Forecast, By Component, 2021 – 2032

   9.3.6.8.2 Retail Audience Measurement Solutions Market Size & Forecast, By Application, 2021 – 2032

   9.3.6.8.3 Retail Audience Measurement Solutions Market Size & Forecast, By Data Capture Technology, 2021 – 2032

   9.3.6.8.4 Retail Audience Measurement Solutions Market Size & Forecast, By End-User, 2021 – 2032   

9.4 Asia-Pacific

 9.4.1 Key Trends

 9.4.2 Retail Audience Measurement Solutions Market Size & Forecast, By Component, 2021 – 2032

 9.4.3 Retail Audience Measurement Solutions Market Size & Forecast, By Application, 2021 – 2032

 9.4.4 Retail Audience Measurement Solutions Market Size & Forecast, By Data Capture Technology, 2021 – 2032

 9.4.5 Retail Audience Measurement Solutions Market Size & Forecast, By End-User, 2021 – 2032

 9.4.6 Retail Audience Measurement Solutions Market Size & Forecast, By Country, 2021 – 2032

  9.4.6.1 China

   9.4.6.1.1 Retail Audience Measurement Solutions Market Size & Forecast, By Component, 2021 – 2032

   9.4.6.1.2 Retail Audience Measurement Solutions Market Size & Forecast, By Application, 2021 – 2032

   9.4.6.1.3 Retail Audience Measurement Solutions Market Size & Forecast, By Data Capture Technology, 2021 – 2032

   9.4.6.1.4 Retail Audience Measurement Solutions Market Size & Forecast, By End-User, 2021 – 2032

  9.4.6.2 India

   9.4.6.2.1 Retail Audience Measurement Solutions Market Size & Forecast, By Component, 2021 – 2032

   9.4.6.2.2 Retail Audience Measurement Solutions Market Size & Forecast, By Application, 2021 – 2032

   9.4.6.2.3 Retail Audience Measurement Solutions Market Size & Forecast, By Data Capture Technology, 2021 – 2032

   9.4.6.2.4 Retail Audience Measurement Solutions Market Size & Forecast, By End-User, 2021 – 2032

  9.4.6.3 Japan

   9.4.6.3.1 Retail Audience Measurement Solutions Market Size & Forecast, By Component, 2021 – 2032

   9.4.6.3.2 Retail Audience Measurement Solutions Market Size & Forecast, By Application, 2021 – 2032

   9.4.6.3.3 Retail Audience Measurement Solutions Market Size & Forecast, By Data Capture Technology, 2021 – 2032

   9.4.6.3.4 Retail Audience Measurement Solutions Market Size & Forecast, By End-User, 2021 – 2032

  9.4.6.4 South Korea

   9.4.6.4.1 Retail Audience Measurement Solutions Market Size & Forecast, By Component, 2021 – 2032

   9.4.6.4.2 Retail Audience Measurement Solutions Market Size & Forecast, By Application, 2021 – 2032

   9.4.6.4.3 Retail Audience Measurement Solutions Market Size & Forecast, By Data Capture Technology, 2021 – 2032

   9.4.6.4.4 Retail Audience Measurement Solutions Market Size & Forecast, By End-User, 2021 – 2032

  9.4.6.5 Australia

   9.4.6.5.1 Retail Audience Measurement Solutions Market Size & Forecast, By Component, 2021 – 2032

   9.4.6.5.2 Retail Audience Measurement Solutions Market Size & Forecast, By Application, 2021 – 2032

   9.4.6.5.3 Retail Audience Measurement Solutions Market Size & Forecast, By Data Capture Technology, 2021 – 2032

   9.4.6.5.4 Retail Audience Measurement Solutions Market Size & Forecast, By End-User, 2021 – 2032

  9.4.6.6 ASEAN Countries

   9.4.6.6.1 Retail Audience Measurement Solutions Market Size & Forecast, By Component, 2021 – 2032

   9.4.6.6.2 Retail Audience Measurement Solutions Market Size & Forecast, By Application, 2021 – 2032

   9.4.6.6.3 Retail Audience Measurement Solutions Market Size & Forecast, By Data Capture Technology, 2021 – 2032

   9.4.6.6.4 Retail Audience Measurement Solutions Market Size & Forecast, By End-User, 2021 – 2032

  9.4.6.7 Rest of Asia-Pacific

   9.4.6.7.1 Retail Audience Measurement Solutions Market Size & Forecast, By Component, 2021 – 2032

   9.4.6.7.2 Retail Audience Measurement Solutions Market Size & Forecast, By Application, 2021 – 2032

   9.4.6.7.3 Retail Audience Measurement Solutions Market Size & Forecast, By Data Capture Technology, 2021 – 2032

   9.4.6.7.4 Retail Audience Measurement Solutions Market Size & Forecast, By End-User, 2021 – 2032

9.5 Latin America

 9.5.1 Key Trends

 9.5.2 Retail Audience Measurement Solutions Market Size & Forecast, By Component, 2021 – 2032

 9.5.3 Retail Audience Measurement Solutions Market Size & Forecast, By Application, 2021 – 2032

 9.5.4 Retail Audience Measurement Solutions Market Size & Forecast, By Data Capture Technology, 2021 – 2032

 9.5.5 Retail Audience Measurement Solutions Market Size & Forecast, By End-User, 2021 – 2032

 9.5.6 Retail Audience Measurement Solutions Market Size & Forecast, By Country, 2021 – 2032

  9.5.6.1 Brazil

   9.5.6.1.1 Retail Audience Measurement Solutions Market Size & Forecast, By Component, 2021 – 2032

   9.5.6.1.2 Retail Audience Measurement Solutions Market Size & Forecast, By Application, 2021 – 2032

   9.5.6.1.3 Retail Audience Measurement Solutions Market Size & Forecast, By Data Capture Technology, 2021 – 2032

   9.5.6.1.4 Retail Audience Measurement Solutions Market Size & Forecast, By End-User, 2021 – 2032

  9.5.6.2 Argentina

   9.5.6.2.1 Retail Audience Measurement Solutions Market Size & Forecast, By Component, 2021 – 2032

   9.5.6.2.2 Retail Audience Measurement Solutions Market Size & Forecast, By Application, 2021 – 2032

   9.5.6.2.3 Retail Audience Measurement Solutions Market Size & Forecast, By Data Capture Technology, 2021 – 2032

   9.5.6.2.4 Retail Audience Measurement Solutions Market Size & Forecast, By End-User, 2021 – 2032

  9.5.6.3 Mexico

   9.5.6.3.1 Retail Audience Measurement Solutions Market Size & Forecast, By Component, 2021 – 2032

   9.5.6.3.2 Retail Audience Measurement Solutions Market Size & Forecast, By Application, 2021 – 2032

   9.5.6.3.3 Retail Audience Measurement Solutions Market Size & Forecast, By Data Capture Technology, 2021 – 2032

   9.5.6.3.4 Retail Audience Measurement Solutions Market Size & Forecast, By End-User, 2021 – 2032

  9.5.6.4 Colombia

   9.5.6.4.1 Retail Audience Measurement Solutions Market Size & Forecast, By Component, 2021 – 2032

   9.5.6.4.2 Retail Audience Measurement Solutions Market Size & Forecast, By Application, 2021 – 2032

   9.5.6.4.3 Retail Audience Measurement Solutions Market Size & Forecast, By Data Capture Technology, 2021 – 2032

   9.5.6.4.4 Retail Audience Measurement Solutions Market Size & Forecast, By End-User, 2021 – 2032

  9.5.6.5 Rest of Latin America

   9.5.6.5.1 Retail Audience Measurement Solutions Market Size & Forecast, By Component, 2021 – 2032

   9.5.6.5.2 Retail Audience Measurement Solutions Market Size & Forecast, By Application, 2021 – 2032

   9.5.6.5.3 Retail Audience Measurement Solutions Market Size & Forecast, By Data Capture Technology, 2021 – 2032

   9.5.6.5.4 Retail Audience Measurement Solutions Market Size & Forecast, By End-User, 2021 – 2032

9.6 Middle East & Africa

 9.6.1 Key Trends

 9.6.2 Retail Audience Measurement Solutions Market Size & Forecast, By Component, 2021 – 2032

 9.6.3 Retail Audience Measurement Solutions Market Size & Forecast, By Application, 2021 – 2032

 9.6.4 Retail Audience Measurement Solutions Market Size & Forecast, By Data Capture Technology, 2021 – 2032

 9.6.5 Retail Audience Measurement Solutions Market Size & Forecast, By End-User, 2021 – 2032

 9.6.6 Retail Audience Measurement Solutions Market Size & Forecast, By Country, 2021 – 2032

  9.6.6.1 UAE

   9.6.6.1.1 Retail Audience Measurement Solutions Market Size & Forecast, By Component, 2021 – 2032

   9.6.6.1.2 Retail Audience Measurement Solutions Market Size & Forecast, By Application, 2021 – 2032

   9.6.6.1.3 Retail Audience Measurement Solutions Market Size & Forecast, By Data Capture Technology, 2021 – 2032

   9.6.6.1.4 Retail Audience Measurement Solutions Market Size & Forecast, By End-User, 2021 – 2032

  9.6.6.2 Saudi Arabia

   9.6.6.2.1 Retail Audience Measurement Solutions Market Size & Forecast, By Component, 2021 – 2032

   9.6.6.2.2 Retail Audience Measurement Solutions Market Size & Forecast, By Application, 2021 – 2032

   9.6.6.2.3 Retail Audience Measurement Solutions Market Size & Forecast, By Data Capture Technology, 2021 – 2032

   9.6.6.2.4 Retail Audience Measurement Solutions Market Size & Forecast, By End-User, 2021 – 2032

  9.6.6.3 Qatar

   9.6.6.3.1 Retail Audience Measurement Solutions Market Size & Forecast, By Component, 2021 – 2032

   9.6.6.3.2 Retail Audience Measurement Solutions Market Size & Forecast, By Application, 2021 – 2032

   9.6.6.3.3 Retail Audience Measurement Solutions Market Size & Forecast, By Data Capture Technology, 2021 – 2032

   9.6.6.3.4 Retail Audience Measurement Solutions Market Size & Forecast, By End-User, 2021 – 2032

  9.6.6.4 Egypt

   9.6.6.4.1 Retail Audience Measurement Solutions Market Size & Forecast, By Component, 2021 – 2032

   9.6.6.4.2 Retail Audience Measurement Solutions Market Size & Forecast, By Application, 2021 – 2032

   9.6.6.4.3 Retail Audience Measurement Solutions Market Size & Forecast, By Data Capture Technology, 2021 – 2032

   9.6.6.4.4 Retail Audience Measurement Solutions Market Size & Forecast, By End-User, 2021 – 2032

  9.6.6.5 South Africa

   9.6.6.5.1 Retail Audience Measurement Solutions Market Size & Forecast, By Component, 2021 – 2032

   9.6.6.5.2 Retail Audience Measurement Solutions Market Size & Forecast, By Application, 2021 – 2032

   9.6.6.5.3 Retail Audience Measurement Solutions Market Size & Forecast, By Data Capture Technology, 2021 – 2032

   9.6.6.5.4 Retail Audience Measurement Solutions Market Size & Forecast, By End-User, 2021 – 2032

  9.6.6.6 Rest of Middle East & Africa

   9.6.6.6.1 Retail Audience Measurement Solutions Market Size & Forecast, By Component, 2021 – 2032

   9.6.6.6.2 Retail Audience Measurement Solutions Market Size & Forecast, By Application, 2021 – 2032

   9.6.6.6.3 Retail Audience Measurement Solutions Market Size & Forecast, By Data Capture Technology, 2021 – 2032

   9.6.6.6.4 Retail Audience Measurement Solutions Market Size & Forecast, By End-User, 2021 – 2032

10. Competitive Landscape

 10.1 Key Players' Positioning

 10.2 Competitive Developments

  10.2.1 Key Strategies Adopted (%), By Key Players, 2024

  10.2.2 Year-Wise Strategies & Development, 2021 – 2025

  10.2.3 Number Of Strategies Adopted By Key Players, 2024

 10.3 Market Share Analysis, 2024

 10.4 Product/Service & Deployment Benchmarking

  10.4.1 Product/Service Specifications & Features By Key Players

  10.4.2 Product/Service Heatmap By Key Players

  10.4.3 Deployment Heatmap By Key Players

 10.5 Industry Start-Up & Innovation Landscape

 10.6 Key Company Profiles

10.6 Key Company Profiles

 10.6.1 Advertima

  10.6.1.1 Company Overview & Snapshot

  10.6.1.2 Product/Service Portfolio

  10.6.1.3 Key Company Financials

  10.6.1.4 SWOT Analysis

 10.6.2 Broox Technologies S.L.U

  10.6.2.1 Company Overview & Snapshot

  10.6.2.2 Product/Service Portfolio

  10.6.2.3 Key Company Financials

  10.6.2.4 SWOT Analysis

 10.6.3 Nielsen

  10.6.3.1 Company Overview & Snapshot

  10.6.3.2 Product/Service Portfolio

  10.6.3.3 Key Company Financials

  10.6.3.4 SWOT Analysis

 10.6.4  Dor Technologies

  10.6.4.1 Company Overview & Snapshot

  10.6.4.2 Product/Service Portfolio

  10.6.4.3 Key Company Financials

  10.6.4.4 SWOT Analysis

 10.6.5 Engagis Pty Ltd

  10.6.5.1 Company Overview & Snapshot

  10.6.5.2 Product/Service Portfolio

  10.6.5.3 Key Company Financials

  10.6.5.4 SWOT Analysis

 10.6.6 Macnica

  10.6.6.1 Company Overview & Snapshot

  10.6.6.2 Product/Service Portfolio

  10.6.6.3 Key Company Financials

  10.6.6.4 SWOT Analysis

 10.6.7 AdQuick

  10.6.7.1 Company Overview & Snapshot

  10.6.7.2 Product/Service Portfolio

  10.6.7.3 Key Company Financials

  10.6.7.4 SWOT Analysis

 10.6.8 Kantar

  10.6.8.1 Company Overview & Snapshot

  10.6.8.2 Product/Service Portfolio

  10.6.8.3 Key Company Financials

  10.6.8.4 SWOT Analysis

 10.6.9 Quividi

  10.6.9.1 Company Overview & Snapshot

  10.6.9.2 Product/Service Portfolio

  10.6.9.3 Key Company Financials

  10.6.9.4 SWOT Analysis

 10.6.10 Raydiant

  10.6.10.1 Company Overview & Snapshot

  10.6.10.2 Product/Service Portfolio

  10.6.10.3 Key Company Financials

  10.6.10.4 SWOT Analysis

 10.6.11 Convenience StoresNext

  10.6.11.1 Company Overview & Snapshot

  10.6.11.2 Product/Service Portfolio

  10.6.11.3 Key Company Financials

  10.6.11.4 SWOT Analysis

 10.6.12 V‑Count

  10.6.12.1 Company Overview & Snapshot

  10.6.12.2 Product/Service Portfolio

  10.6.12.3 Key Company Financials

  10.6.12.4 SWOT Analysis

 10.6.13 Walkbase

  10.6.13.1 Company Overview & Snapshot

  10.6.13.2 Product/Service Portfolio

  10.6.13.3 Key Company Financials

  10.6.13.4 SWOT Analysis

 10.6.14 Placer.ai

  10.6.14.1 Company Overview & Snapshot

  10.6.14.2 Product/Service Portfolio

  10.6.14.3 Key Company Financials

  10.6.14.4 SWOT Analysis

 10.6.15 Cuebiq

  10.6.15.1 Company Overview & Snapshot

  10.6.15.2 Product/Service Portfolio

  10.6.15.3 Key Company Financials

  10.6.15.4 SWOT Analysis

 10.6.16 AdMobilize

  10.6.16.1 Company Overview & Snapshot

  10.6.16.2 Product/Service Portfolio

  10.6.16.3 Key Company Financials

  10.6.16.4 SWOT Analysis

 10.6.17 AllUnite

  10.6.17.1 Company Overview & Snapshot

  10.6.17.2 Product/Service Portfolio

  10.6.17.3 Key Company Financials

  10.6.17.4 SWOT Analysis

 10.6.18 Aislelabs

  10.6.18.1 Company Overview & Snapshot

  10.6.18.2 Product/Service Portfolio

  10.6.18.3 Key Company Financials

  10.6.18.4 SWOT Analysis

 10.6.19 IMS

  10.6.19.1 Company Overview & Snapshot

  10.6.19.2 Product/Service Portfolio

  10.6.19.3 Key Company Financials

  10.6.19.4 SWOT Analysis

 10.6.20 Scandit

  10.6.20.1 Company Overview & Snapshot

  10.6.20.2 Product/Service Portfolio

  10.6.20.3 Key Company Financials

  10.6.20.4 SWOT Analysis

11. Analyst Recommendations

 11.1 SNS Insider Opportunity Map

 11.2 Industry Low-Hanging Fruit Assessment

 11.3 Market Entry & Growth Strategy

 11.4 Analyst Viewpoint & Suggestions On Market Growth

12. Assumptions

13. Disclaimer

14. Appendix

 14.1 List Of Tables

 14.2 List Of Figures

Key Segments:

By Component

  • Hardware

    • Camera

    • Wi-Fi/Bluetooth Beacons

    • Sensors

    • Media Player

    • Others

  • Software

  • Services

By Application

  • Customer Traffic & Footfall

  • Queue Management

  • Store Layout & Planogram Optimization

  • Demographic & Behavioral Profiling

By Data Capture Technology

  • Facial Recognition

  • Video Analytics

  • Infrared Sensors

  • Mobile Device Tracking

  • RFID

By End-Use

  • Supermarkets & Hypermarkets

  • Convenience Stores

  • Department Stores

  • Specialty Stores

  • Others

Request for Segment Customization as per your Business Requirement: Segment Customization Request

Regional Coverage: 

North America

  • US

  • Canada

Europe

  • Germany

  • France

  • UK

  • Italy

  • Spain

  • Poland

  • Russia

  • Rest of Europe

Asia Pacific

  • China

  • India

  • Japan

  • South Korea

  • ASEAN Countries

  • Australia

  • Rest of Asia Pacific

Middle East & Africa

  • UAE

  • Saudi Arabia

  • Qatar

  • Egypt

  • South Africa

  • Rest of Middle East & Africa

Latin America

  • Brazil

  • Argentina

  • Mexico

  • Colombia

  • Rest of Latin America

Request for Country Level Research Report: Country Level Customization Request

Available Customization 

With the given market data, SNS Insider offers customization as per the company’s specific needs. The following customization options are available for the report: 

  • Detailed Volume Analysis 

  • Criss-Cross segment analysis (e.g. Component X Application) 

  • Competitive Component Benchmarking 

  • Geographic Analysis 

  • Additional countries in any of the regions 

  • Customized Data Representation 

  • Detailed analysis and profiling of additional market players

An accurate research report requires proper strategizing as well as implementation. There are multiple factors involved in the completion of good and accurate research report and selecting the best methodology to compete the research is the toughest part. Since the research reports we provide play a crucial role in any company’s decision-making process, therefore we at SNS Insider always believe that we should choose the best method which gives us results closer to reality. This allows us to reach at a stage wherein we can provide our clients best and accurate investment to output ratio.

Each report that we prepare takes a timeframe of 350-400 business hours for production. Starting from the selection of titles through a couple of in-depth brain storming session to the final QC process before uploading our titles on our website we dedicate around 350 working hours. The titles are selected based on their current market cap and the foreseen CAGR and growth.


The 5 steps process:

Step 1: Secondary Research:

Secondary Research or Desk Research is as the name suggests is a research process wherein, we collect data through the readily available information. In this process we use various paid and unpaid databases which our team has access to and gather data through the same. This includes examining of listed companies’ annual reports, Journals, SEC filling etc. Apart from this our team has access to various associations across the globe across different industries. Lastly, we have exchange relationships with various university as well as individual libraries.

Secondary Research

Step 2: Primary Research

When we talk about primary research, it is a type of study in which the researchers collect relevant data samples directly, rather than relying on previously collected data.  This type of research is focused on gaining content specific facts that can be sued to solve specific problems. Since the collected data is fresh and first hand therefore it makes the study more accurate and genuine.

We at SNS Insider have divided Primary Research into 2 parts.

Part 1 wherein we interview the KOLs of major players as well as the upcoming ones across various geographic regions. This allows us to have their view over the market scenario and acts as an important tool to come closer to the accurate market numbers. As many as 45 paid and unpaid primary interviews are taken from both the demand and supply side of the industry to make sure we land at an accurate judgement and analysis of the market.

This step involves the triangulation of data wherein our team analyses the interview transcripts, online survey responses and observation of on filed participants. The below mentioned chart should give a better understanding of the part 1 of the primary interview.

Primary Research

Part 2: In this part of primary research the data collected via secondary research and the part 1 of the primary research is validated with the interviews from individual consultants and subject matter experts.

Consultants are those set of people who have at least 12 years of experience and expertise within the industry whereas Subject Matter Experts are those with at least 15 years of experience behind their back within the same space. The data with the help of two main processes i.e., FGDs (Focused Group Discussions) and IDs (Individual Discussions). This gives us a 3rd party nonbiased primary view of the market scenario making it a more dependable one while collation of the data pointers.

Step 3: Data Bank Validation

Once all the information is collected via primary and secondary sources, we run that information for data validation. At our intelligence centre our research heads track a lot of information related to the market which includes the quarterly reports, the daily stock prices, and other relevant information. Our data bank server gets updated every fortnight and that is how the information which we collected using our primary and secondary information is revalidated in real time.

Data Bank Validation

Step 4: QA/QC Process

After all the data collection and validation our team does a final level of quality check and quality assurance to get rid of any unwanted or undesired mistakes. This might include but not limited to getting rid of the any typos, duplication of numbers or missing of any important information. The people involved in this process include technical content writers, research heads and graphics people. Once this process is completed the title gets uploader on our platform for our clients to read it.

Step 5: Final QC/QA Process:

This is the last process and comes when the client has ordered the study. In this process a final QA/QC is done before the study is emailed to the client. Since we believe in giving our clients a good experience of our research studies, therefore, to make sure that we do not lack at our end in any way humanly possible we do a final round of quality check and then dispatch the study to the client.