RFID Tags Market Report Scope & Overview:
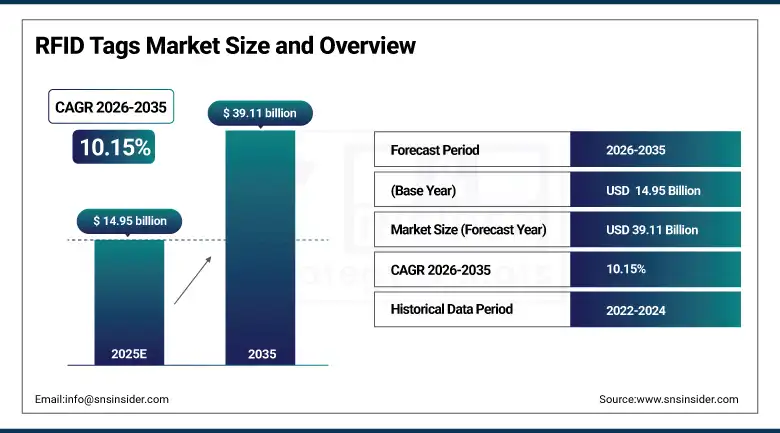
The RFID Tags Market size was valued at USD 14.95 Billion in 2025 and is projected to reach USD 39.11 Billion by 2035, growing at a CAGR of 10.15% during 2026–2035.
The RFID Tags Market is witnessing steady growth driven by increase in the need for real-time tracking, automation, and efficiency of operations. The RFID tags play an important role in the efficient collection of data, reducing human involvement, and maintaining the correct inventory levels. Technological advancements like IoT and Cloud technology are also helping the RFID Tag market to grow. Businesses are increasingly adopting the RFID technology for better management of assets. Additionally, the cost of RFID tags and the need for a digital transformation are also helping the RFID technology to grow and become an essential part of the identification and tracking process.
RFID Tags Market Size and Growth Forecast:
-
Market Size in 2025: USD 14.95 Billion
-
Market Size by 2035: USD 39.11 Billion
-
CAGR: 10.15% during 2026–2035
-
Base Year: 2025
-
Forecast Period: 2026–2035
-
Historical Data: 2022–2024
To Get more information On RFID Tags Market - Request Free Sample Report
RFID Tags Market Key Trends:
-
Increasing integration of RFID with IoT and cloud-based platforms is enhancing real-time data visibility and analytics capabilities.
-
Growing adoption of RFID in smart retail is enabling automated checkout systems and improved inventory accuracy.
-
Advancements in printable and eco-friendly RFID tags are supporting cost reduction and sustainability initiatives.
-
Rising use of RFID in healthcare is improving patient tracking, asset management, and operational efficiency.
-
Development of chipless and low-cost RFID technologies is expanding adoption across price-sensitive industries.
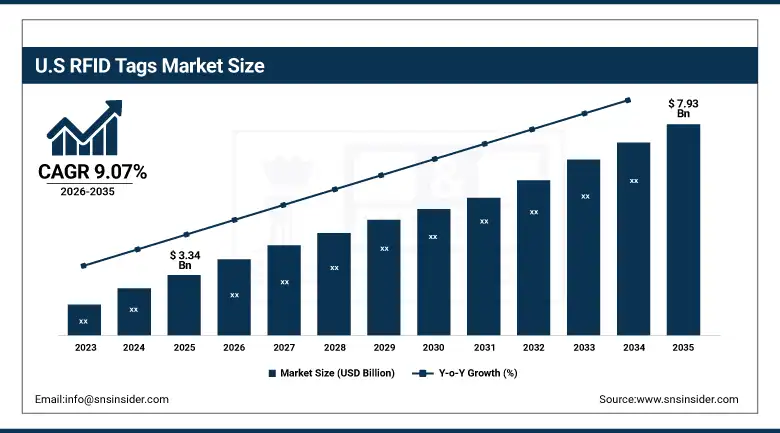
U.S. RFID Tags Market Size Outlook:
The U.S. RFID Tags Market has been valued at USD 3.34 Billion in 2025 and is expected to reach USD 7.93 Billion in 2035, growing at a CAGR of 9.07% from 2026 to 2035. Growth is driven by increase in the use of RFID tags for inventory management in retail and logistics, the need for automation, IoT technology, and the reduction of the cost of RFID tags.
RFID Tags Market Key Drivers:
-
RFID Technology Revolutionizes Inventory Management with Enhanced Accuracy and Efficiency
Global industries increasingly rely on RFID tags for real-time inventory tracking, reducing losses by 30%. RFID in supply chain management has transformed the way inventory tracking and operational efficiency are carried out. In retail, RFID technology enabled brands like Walmart to achieve inventory accuracy rates exceeding 95% in 2023, according to research. Governments worldwide have also promoted RFID usage in food and pharmaceutical sectors for traceability, reducing counterfeit risks.
The report by the U.S. National Library of Medicine states that through RFID implementations in pharmaceuticals, recall efficiency increased by 40%. The demand is furthered due to cost-cutting and increased visibility in logistics ecosystems, ensuring proper delivery and optimizing warehouse operations.
-
IoT Integration with RFID Drives Automation and Expands Applications Across Industries
The integration of IoT with RFID has the potential to enhance the scope of automation. In the context of IoT, RFID technology has emerged as a vital tool, enabling the efficient flow of communication.
Automotive industries use IoT-powered RFID for smart tolling and vehicle tracking. In addition, smart city projects in the Asia-Pacific region use RFID in traffic management and utility monitoring. The synergy between RFID and IoT drives innovation in automation, real-time monitoring, and predictive maintenance and therefore expands its application across various industries.
RFID Tags Market Key Restraints:
-
RFID system installation is expensive, thus restraining its application within small-sized companies.
While it has many benefits, the installation of an RFID system is cost-expensive to many firms, especially SMEs. It incurs a cost up to 20% more than that of traditional tracking. According to the International Trade Administration, a 2023 report indicated that small retailers in developing countries are not adopting RFID due to lack of budget. Furthermore, the cost of maintaining and replacing damaged tags increases the costs. This limitation prevents RFID adoption in areas where profit margins are thin, such as small-scale agriculture or low-cost retail. This barrier will be solved through subsidies, cost-sharing programs, or even cheaper solutions between governments and manufacturers for the widespread diffusion of RFID technology.
RFID Tags Market Key Opportunities:
-
Rising adoption of RFID in e-commerce and smart logistics creates significant growth opportunities.
The rapid expansion of e-commerce and global trade, the need for real-time tracking and inventory management is increasing. RFID tags can help in the automation of the process. According to reports, companies that use RFID technology in the logistics sector have improved their efficiency by over 25%. Also, the increasing rate of automation in warehouses and last-mile delivery is contributing to the growth of this segment. With the focus on faster and more transparent operations, RFID technology is likely to gain traction in the logistics and supply chain management sectors.
RFID Tags Market Segments:
-
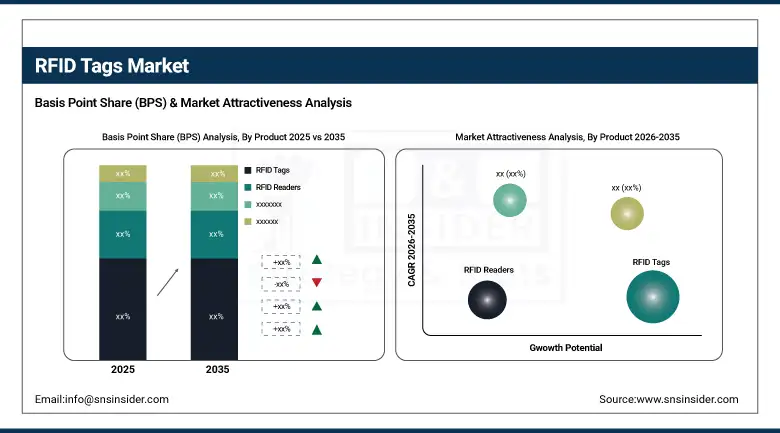
By Product: In 2025, RFID Tags dominated with 55% share; RFID Readers fastest growing segment during 2026-2035
-
By Type: In 2025, Passive RFID Tags dominated with 75% share; Active RFID Tags fastest growing segment during 2026-2035
-
By Frequency: In 2025, Ultra-high Frequency (UHF) dominated with 60% share; UHF fastest growing segment during 2026-2035
-
By Application: In 2025, Retail dominated with 30% share; Transport & Logistics fastest growing segment during 2026-2035
By Product: RFID Tags Dominates, RFID Readers Fastest-Growing
RFID Tags hold the maximum market share in the product segment due to their critical role in identification and tracking in various applications. The low cost and widespread use of RFID tags in inventory and asset management contribute significantly to their adoption, making RFID tags the most critical component in RFID systems.
RFID Readers are the fastest-growing segment in the RFID market due to the development of infrastructure and the need for advanced data capture technology.
By Type: Passive RFID Tags Dominates, Active RFID Tags Fastest-Growing
Passive RFID Tags hold the largest market share in the type segment because of their low cost, compact size, and no need for a battery. Their extensive use in retail and supply chain applications is adding to their market dominance.
Active RFID Tags are the fastest-growing segment in the type segment. Their high-range capabilities and real-time tracking features are contributing to their rapid growth.
By Frequency: Ultra-High Frequency Dominates, Ultra-High Frequency Fastest-Growing
Ultra High Frequency dominates the frequency band as it has more range, speed, and efficiency in bulk scanning. The frequency band has good market demand, especially from the logistics and retail sectors.
Ultra High Frequency has the highest growth potential as a frequency band, as it has more usage in supply chain management and warehouse management systems.
By Application: Retail Dominates, Transport & Logistics Fastest-Growing
The retail sector leads in the application segment due to the high adoption rate of RFID technology for inventory management, theft prevention, and checkout systems. The demand for real-time stock management and customer experience drives this position.
Transport and Logistics segment has the highest growth rate, driven by the increase in the number of e-commerce transactions. The technology assists in the improvement of visibility, accuracy, and efficiency.Top of Form
Bottom of Form
RFID Tags Market Regional Analysis:
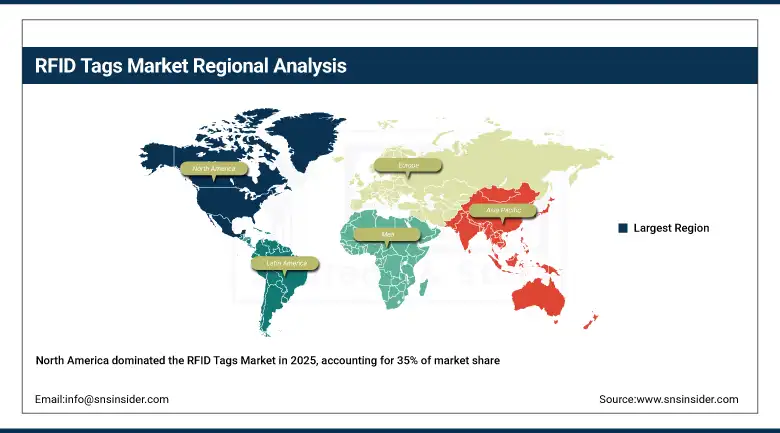
North America RFID Tags Market Insights:
North America is the leader in the RFID Tags Market, contributing around 35% of the total global market share in 2025. The reason behind this is the widespread adoption of RFID technology in the retail, logistics, and healthcare industries, as it is useful in inventory management and tracking. The technological advancements and infrastructure in the region are the added advantages that contribute significantly to the RFID market. Furthermore, the major RFID solution providers and investments in supply chain digitalization are the reasons behind the strong market demand in the North American region, making it the leader in the RFID tags market.
Get Customized Report as per Your Business Requirement - Enquiry Now
Europe RFID Tags Market Insights:
Europe RFID Tags Market is growing steadily due to the increasing adoption of automation and digital technology solutions. The focus on transparency and compliance is a significant factor in the adoption of RFID technology. The retail, manufacturing, and healthcare industries are already experiencing the benefits of the adoption of RFID technology. The focus on sustainability and smart technology is also contributing to the adoption of advanced RFID technology. The ongoing digital transformation initiatives are contributing significantly to the Europe RFID tags market.
Asia-Pacific RFID Tags Market Insights:
Asia-Pacific is the fastest-growing segment in the RFID Tags Market, which is projected to grow at a CAGR of 11.78% between 2026 and 2035. The growth is mainly due to the rapid industrialization and development of e-commerce in the Asia-Pacific region, along with the use of RFID technology in the retail, manufacturing, and logistics sectors. The governments and companies in the Asia-Pacific region are investing heavily in digital infrastructure and smart supply chain management. In addition, the increasing demand for automation and inventory management in emerging economies is driving the use of RFID technology in the Asia-Pacific region.
Latin America RFID Tags Market Insights:
Latin America RFID Tags Market is developing gradually. The retail infrastructure is developing, and the logistics industry is growing. The adoption of RFID technology for inventory management and tracking assets is contributing to efficiency. Businesses are adopting technology to improve supply chain visibility. The awareness and modernization of the industry are contributing to the steady growth of the market.
Middle East & Africa (MEA) RFID Tags Market Insights:
Middle East and Africa (MEA) region’s RFID tags market is registering steady growth owing to rising investments in infrastructure, logistics, and smart cities. The market for RFID technology is also witnessing increased adoption in retail, transportation, and government sectors for identification and security purposes. Furthermore, digitalization and modernization are also driving companies in the region to adopt RFID technology for better efficiency in their operations.
RFID Tags Market Competitive Landscape:
Avery Dennison Corporation, headquartered in Glendale, California, USA, is a leading global materials science and digital identification solutions company and a key player in the RFID tags market, specializing in smart labels, inlays, and RFID-enabled solutions. The company focuses on innovation in intelligent labeling, supply chain visibility, and sustainable packaging, emphasizing digital transformation, product traceability, and strong global presence.
-
In January 2025: Avery Dennison expanded its RFID production capacity and introduced sustainable RFID inlays to support growing demand in retail and logistics sectors.
NXP Semiconductors N.V., headquartered in Eindhoven, Netherlands, is a global semiconductor company and a major player in the RFID tags market, specializing in RFID chips, near-field communication (NFC), and secure connectivity solutions. The company focuses on advanced semiconductor technologies, secure identification, and IoT integration, emphasizing innovation, high-performance chips, and broad industry applications.
-
In February 2025: NXP Semiconductors launched next-generation RFID and NFC chip solutions designed to enhance data security, performance, and scalability for smart applications.
RFID Tags Companies are:
-
NXP Semiconductors N.V.
-
Impinj, Inc.
-
Zebra Technologies Corporation
-
HID Global Corporation
-
Smartrac N.V. (Avery Dennison)
-
Honeywell International Inc.
-
Identiv, Inc.
-
Checkpoint Systems, Inc.
-
GAO RFID Inc.
-
Invengo Information Technology Co., Ltd.
-
Confidex Ltd.
-
Omni-ID Ltd.
-
Xerafy Ltd.
-
Tageos (an Avery Dennison company)
-
Datalogic S.p.A.
-
SATO Holdings Corporation
-
Nedap N.V.
-
Bartronics India Limited
| Report Attributes | Details |
|---|---|
| Market Size in 2025 | USD 14.95 Billion |
| Market Size by 2035 | USD 39.11 Billion |
| CAGR | CAGR of 10.15% From 2026 to 2035 |
| Base Year | 2025 |
| Forecast Period | 2026-2035 |
| Historical Data | 2022-2024 |
| Report Scope & Coverage | Market Size, Segments Analysis, Competitive Landscape, Regional Analysis, DROC & SWOT Analysis, Forecast Outlook |
| Key Segments | • By Product: (RFID Tags, RFID Readers, Middleware) • By Type: (Passive RFID Tags, Active RFID Tags) • By Frequency: (Low Frequency, High Frequency, Ultra-High Frequency) • By Application: (Retail, Financial Services, Healthcare, Industrial, Government, Transport & Logistics, Others) |
| Regional Analysis/Coverage | North America (US, Canada), Europe (Germany, UK, France, Italy, Spain, Russia, Poland, Rest of Europe), Asia Pacific (China, India, Japan, South Korea, Australia, ASEAN Countries, Rest of Asia Pacific), Middle East & Africa (UAE, Saudi Arabia, Qatar, South Africa, Rest of Middle East & Africa), Latin America (Brazil, Argentina, Mexico, Colombia, Rest of Latin America). |
| Company Profiles | Avery Dennison Corporation, NXP Semiconductors N.V., Impinj, Inc., Zebra Technologies Corporation, HID Global Corporation, Alien Technology LLC, Smartrac N.V. (Avery Dennison), Honeywell International Inc., Identiv, Inc., Checkpoint Systems, Inc., GAO RFID Inc., Invengo Information Technology Co., Ltd., Confidex Ltd., Omni-ID Ltd., Xerafy Ltd., Tageos (an Avery Dennison company), Datalogic S.p.A., SATO Holdings Corporation, Nedap N.V., Bartronics India Limited. |
Frequently Asked Questions
Ans: The RFID Tags Market is expected to grow at a CAGR of 10.15% during 2026–2035.
Ans: The market was valued at USD 14.95 Billion in 2025 and is projected to reach USD 39.11 Billion by 2035.
Ans: The key drivers of the RFID Tags Market include increasing demand for real-time tracking, inventory automation, supply chain visibility, IoT integration, cost reduction, and improved operational efficiency across industries.
Ans: The Passive RFID Tags segment dominated during the projected period.
Ans: North America dominated the RFID Tags Market in 2025.
Get in Touch
