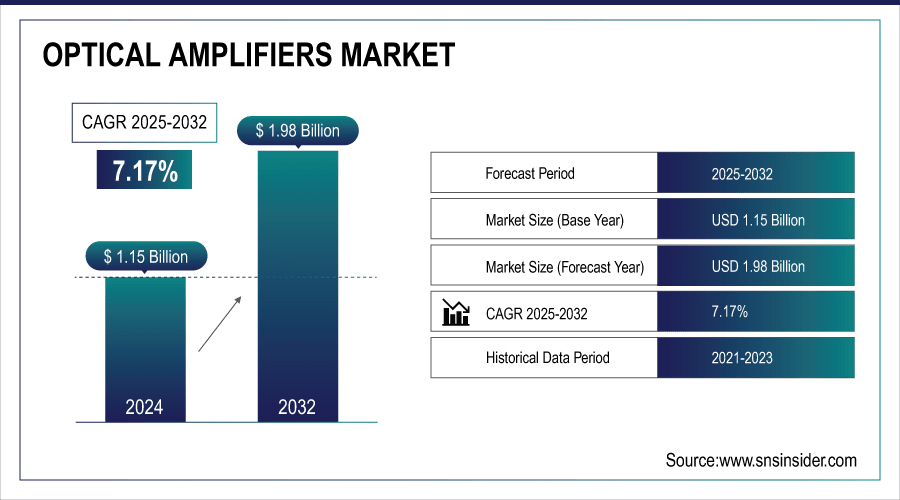
The Optical Amplifiers Market Size was valued at USD 1.15 billion in 2024 and is expected to reach USD 1.98 billion by 2032 and grow at a CAGR of 7.17 % over the forecast period of 2025-2032.
The global optical amplifiers market growth is mainly boosted by increasing global data traffic and the extensive deployment of the fiber optic cable. Expansion of market is supported by increase in the telecom infrastructure and demand for high-speed internet and cloud-based services. Emergence of new technology and growing investment in network capacity continue to create a positive market outlook.
According to research, over 70% of new network infrastructure deployments in 2024 involved fiber optic cables, reflecting the shift toward high-speed broadband.
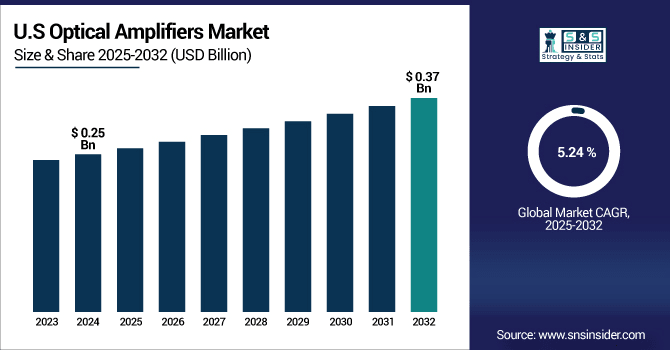
The U.S. Optical Amplifiers Market size was USD 0.25 billion in 2024 and is expected to reach USD 0.37 billion by 2032, growing at a CAGR of 5.24 % over the forecast period of 2025–2032.
The U.S. growth is mainly attributed to increasing investment in advanced telecom infrastructure and 5G deployment. Rising demand for optical amplifiers to increase data transmission capacities due to growing adoption of cloud computing along with expansion in data centers. Further, the government policies toward broadband penetration and fiber optic network deployment are the major factors influencing the expansion of the market in the U.S.
According to research, data centers accounted for approximately 4.4% of total U.S. electricity consumption in 2023, with energy use increasing from 58 TWh in 2014 to 176 TWh, reflecting the growing demand for data processing and storage.
The U.S. broadband providers invested around USD 94.7 billion in communications infrastructure in 2023, marking the second-highest annual capital expenditure in over two decades, underscoring the nation's commitment to expanding its digital and network capabilities.
Key Drivers:
Growing Adoption of 5G and Data Center Upgrades Increases Need for Optical Amplifiers
5G network rollouts along with increasing number of data centers globally are the other factors driving the optical amplifier market. 5G networks rely heavily on high capacity back- and fronthaul networks, and is dominated by optical amplifiers that are used to aid in extending the link distance while preserving the received signal quality. Data centers, critical for cloud services and IoT, require large-scale, reliable, and scalable optical amplifiers, to support data-heavy transmission. These developments combined drive the demand for high performance, energy efficient, optical amplifiers that can be used in next generation high speed and low latency networks.
According to research, by the end of 2023, there were approximately 1.76 billion 5G connections globally, marking a 66% increase from the previous year. North America led this growth, with the U.S. playing a pivotal role in the expansion.
In 2023, 5G home broadband became the preferred choice for 96% of new broadband subscribers in the U.S., covering 94 million households. This surge underscores the critical role of optical amplifiers in enhancing signal quality and extending network reach NTT Corporation achieved a significant breakthrough by developing a multi-core optical amplifier that reduces power consumption by 67% compared to conventional technologies.
Restraints:
Complex Integration and Compatibility Issues Hinder Optical Amplifier Deployment
Integration difficulties, and interface problems with present network technology are inhibiting the market for optical amplifiers. Various amplifier topologies may not present a seamless fit with existing equipment, thereby contributing to added complexity and cost of operation. Operators also struggles with controlling multivendor networks and achieving interoperability. Furthermore, protecting and operating optical amplifiers required specific technical skill, lead to deployment delays, and limited penetration into the markets of small service providers not possessing a skilled workforce.
Opportunities:
Increasing Demand for Energy-Efficient Optical Amplifiers in Green Networking
Increased environmental and regulatory pressure are driving the demand for energy-efficient optical amplifiers. The scope is in amplifiers with low power consumption and better thermal management which makes the telecoms infrastructure greener. Power-saving optical amplifiers not only save operational expenses, but also cater to the green policy of the all-service providers and governments. Further advances in amplifier materials and designs, and overall increasing investments in green networking technologies bring enormous market potential for green optical amplification technologies.
According to research, Energy-efficient optical amplifiers can reduce power consumption by up to 30-40% compared to traditional models, significantly cutting operational costs and carbon footprints.
Challenges:
Supply Chain Disruptions Affect Optical Amplifier Production and Delivery Timelines
Global supply chain risks are creating new challenges for optical amplifier suppliers. Production schedules are affected by the lead-times of the most critical components including specialty fibers and semiconductor materials. Geopolitical rivalries, shortages of raw materials and transport bottlenecks only further complicate the reliability of the supply chain. They create longer lead times, cost overruns, and contract terminations, which impacts customer satisfaction. Concerns of supply chain risk will see solid growth within the optical amplifier market continue and meet the increasing demand globally.
By Type
Fiber Amplifier segment dominated the highest Optical Amplifiers Market share of about 56.97% in 2024, as they have high gain, low noise and wide bandwidth, which are better than the other amplifiers. They are indispensable for long distance optical signal transmission without loss. One of the leading suppliers in this space is Lumentum Holdings Inc., which manufactures high-performance EDFAs used in DWDM systems throughout the world's telecom fiber routes. Leadership in the segment is also buoyed by submarine cable construction, broadband coverage expansion, and larger 5G backhaul network investments requiring robust, high-capacity amplification for data traffic that wants to break free.
Semiconductor Optical Amplifier segment is expected to grow at the fastest CAGR of about 8.11% over 2025–2032, because they can easily be integrated with photonic circuits, are compact and power-efficient. Their flexibility in short-haul situations, such as access networks and metro connections, is driving demand. Halfway through this trend and Cisco Systems, Inc. is leading with the introduction of next-generation SOA services for the data center and software-defined networks. With the explosion of traffic across cloud platforms and hyperscale designs, SOAs offer adaptability, and they are well suited for those who are deploying flexible, agile networks either today or in the future in a wide array of industry segments.
By Function
In-line Amplifier segment dominated the Optical Amplifiers Market with the highest revenue share of about 47.11% in 2024, due to the capability of maintaining high quality optical signal transmission up to tens of thousands of kilometers without regeneration of signals. Their effectiveness help accelerate deployment of fiber in high-traffic avenues. In it, Ciena Corporation offers next-gen in-line amplification systems for next-gen metro and core networks. As broadband penetration and needs for greater bandwidth increases, these amplifiers enable telecom carriers to meet performance requirements while lowering costs and keeping service quality solid across regional and transcontinental transmission lines.
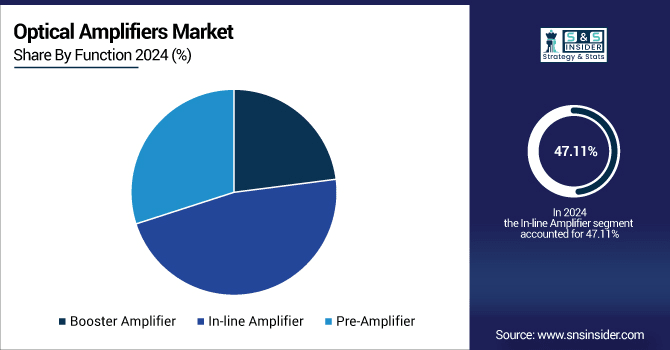
Pre-Amplifier segment is expected to grow at the fastest CAGR of about 8.37% over 2025–2032, due to their role in the improvement of the reception of weak signals before conversion at the optical receivers. The employing of these components is very essential in long-haul coherent transmission systems. Optical amplifiers companies including NeoPhotonics Corporation, which offers pre-amplifier solutions with industry-leading ultra-low noise performance for high-capacity optical links. As higher-order modulations and bit rates increase and with the expansion of cloud data centre interconnects together with rapid deployment of next-generation coherent optical technologies, it means the role of the pre-amplifier is further highlighted to ensure that best system sensitivities and performance are achieved.
By Industry Vertical
The IT and Telecommunication segment dominated the Optical Amplifiers Market with the highest revenue share of about 36.78% in 2024, owing to a surge in data traffic from video streaming, cloud computing, and fast 5G rollouts. Fiber-optic networks need amplification to compensate for fade of the signal in long distance transmission. Central to this market, Huawei Technologies Co., Ltd. delivers strong amplifier offerings driving large-scale telecom infrastructure globally. The increased pace of digital transformation is widening the need for stable and high-capacity networks, contributing to growth of this vertical, backed by government and private investments.
The industrial segment is expected to grow at the fastest CAGR of about 8.76% during 2025–2032, because of smart manufacturing, IIoT, and increasing demand for real-time communication in automation systems. Signal booster maintains a stable connection at high speed in a complicated environment. II-VI Incorporated is the leading player in the provision of ruggedized amplifier solutions for industrial and harsh environments. With the proliferation of intelligent sensing, robotics and predictive analytics in these industries, the market for robust optical communication infrastructure is growing, driving increased adoption throughout factories, transportation networks, energy infrastructure and process automation globally.
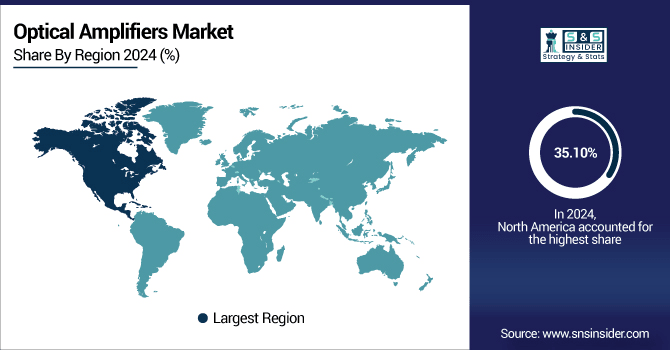
North America dominated the Optical Amplifiers Market with the highest revenue share of about 35.10% in 2024 owing to its well-developed telecommunications and the early introduction of fibre-optics. Leading high-internet-penetration, growing demand for high-speed broadband, and significant investment in data centers and 5G rollouts support market dominance. At the same time, the presence of big industry players and government initiatives focused on digital transformation make the region even more important, especially in the U.S. and Canada where various network capex contributes are ongoing.
The North America Optical Amplifiers Market is dominated by the U.S owing to its strong infrastructure of fiber optic, high consumption of data, the presence of next-generation telecom networks, and the prominent control of major technology firms in the region investing on a large scale on 5G, cloud computing and long haul data transmission services.
Asia Pacific is expected to grow at the fastest CAGR of about 8.46% over 2025–2032 due to the increasing pace of urbanization, digitalization, and telecom network expansion in China, India, and Japan. Growth is propelled by government-supported broadband projects, growing demand for mobile data and a rise in investments in subsea cable projects. The region is also supported by the rapid growth of electronics and semiconductor industry and the popularity of smart devices that contribute to the momentum of reliable and scalable optical communication infrastructure.
China is the leading market in the Asia Pacific Optical Amplifiers Market due to the huge investment made for fibre optic infrastructure, fast deployment of 5G and a strong manufacturing base in this country, China itself is a hub for telecom expansion and high-speed data transfer technologies developed and implemented by the government through digital initiatives.
The Optical Amplifiers market in Europe is getting propelled due to the growth of digitalization in various industries and government initiatives on expanding broadband services. The region's strong emphasis on plans for 5G roll out, cloud and IoT ecosystem integration is resulting in growing demand for high-capacity, dedicated optical network systems. Furthermore, increased investment in “green” data centers and international subsea cable systems help to advance Europe’s status in the global optical connectivity race.
Germany dominates the European optical amplifiers market as it has developed telecom infrastructure, a robust industrial background and large industrial frameworks with an increased demand for high speeds technologies. Heavy government directives and investments in fiber optics and data centers contribute to the country’s leadership in optical network technologies.
The Middle East & Africa Optical Amplifiers Market is led by the UAE on account of its developed telecom infrastructure, the rapid rollout of 5G technology, along with smart city projects, such as the Dubai Smart City. In Latin America, Brazil pulls ahead thanks to large fiber optic deployments, a surge in internet usage, and increasing demand for high-speed data services.
Major Key Players in Optical Amplifiers Market are Coherent Corp., Lumentum Holdings Inc., Accelink Technologies Co., Ltd., Wuxi Taclink Optoelectronics Technology Co., Ltd., Cisco Systems, Inc., Ciena Corporation, Huawei Technologies Co., Ltd., Nokia Corporation, Fujitsu Optical Components Limited, NEC Corporation
In September 2024, Wuxi Taclink introduced its new line of high-power EDFAs at ECOC 2024, designed for long-haul and metro applications, offering improved performance and reliability.
In September 2024, Fujitsu introduced its new line of high-power EDFAs at ECOC 2024, optimized for 400G and 800G coherent transmission systems, supporting long-haul and metro networks with enhanced signal amplification capabilities.
Report Attributes | Details |
---|---|
Market Size in 2024 | USD 1.15 Billion |
Market Size by 2032 | USD 1.98 Billion |
CAGR | CAGR of 7.17% From 2025 to 2032 |
Base Year | 2024 |
Forecast Period | 2025-2032 |
Historical Data | 2021-2023 |
Report Scope & Coverage | Market Size, Segments Analysis, Competitive Landscape, Regional Analysis, DROC & SWOT Analysis, Forecast Outlook |
Key Segments | • By Type (Semiconductor Optical Amplifier, Fiber Amplifier, Others) • By Function (Booster Amplifier, In-line Amplifier, Pre-Amplifier) • By Industry Vertical (IT and Telecommunication, Industrial, Government and Defense, Healthcare and Life Sciences, Others) |
Regional Analysis/Coverage | North America (US, Canada, Mexico), Europe (Germany, France, UK, Italy, Spain, Poland, Turkey, Rest of Europe), Asia Pacific (China, India, Japan, South Korea, Singapore, Australia,Taiwan, Rest of Asia Pacific), Middle East & Africa (UAE, Saudi Arabia, Qatar, South Africa, Rest of Middle East & Africa), Latin America (Brazil, Argentina, Rest of Latin America) |
Company Profiles | Coherent Corp., Lumentum Holdings Inc., Accelink Technologies Co., Ltd., Wuxi Taclink Optoelectronics Technology Co., Ltd., Cisco Systems, Inc., Ciena Corporation, Huawei Technologies Co., Ltd., Nokia Corporation, Fujitsu Optical Components Limited, NEC Corporation |
Ans: The Optical Amplifiers Market is expected to grow at a CAGR of 7.17 % from 2025-2032.
Ans: The Optical Amplifiers Market size was USD 1.15 billion in 2024 and is expected to reach USD 1.98 billion by 2032.
Ans: The major growth factor of the Optical Amplifiers Market is the increasing demand for high-speed data transmission and expanding fiber optic networks.
Ans: Fiber Amplifier segment dominated the Optical Amplifiers Market.
Ans: North America dominated the Optical Amplifiers Market in 2024.
Table of Contents
1. Introduction
1.1 Market Definition
1.2 Scope (Inclusion and Exclusions)
1.3 Research Assumptions
2. Executive Summary
2.1 Market Overview
2.2 Regional Synopsis
2.3 Competitive Summary
3. Research Methodology
3.1 Top-Down Approach
3.2 Bottom-up Approach
3.3. Data Validation
3.4 Primary Interviews
4. Market Dynamics Impact Analysis
4.1 Market Driving Factors Analysis
4.1.1 Drivers
4.1.2 Restraints
4.1.3 Opportunities
4.1.4 Challenges
4.2 PESTLE Analysis
4.3 Porter’s Five Forces Model
5. Statistical Insights and Trends Reporting
5.1 Latency Jitter Reduction Stats
5.2 Thermal Management Efficiency
5.3 Polarization Mode Dispersion (PMD) Mitigation Stats
6. Competitive Landscape
6.1 List of Major Companies, By Region
6.2 Market Share Analysis, By Region
6.3 Product Benchmarking
6.3.1 Product specifications and features
6.3.2 Pricing
6.4 Strategic Initiatives
6.4.1 Marketing and promotional activities
6.4.2 Distribution and Supply Chain Strategies
6.4.3 Expansion plans and new Product launches
6.4.4 Strategic partnerships and collaborations
6.5 Technological Advancements
6.6 Market Positioning and Branding
7. Optical Amplifiers Market Segmentation By Type
7.1 Chapter Overview
7.2 Semiconductor Optical Amplifier
7.2.1 Semiconductor Optical Amplifier Market Trends Analysis (2021-2032)
7.2.2 Semiconductor Optical Amplifier Market Size Estimates and Forecasts to 2032 (USD Billion)
7.3 Fiber Amplifier
7.3.1 Fiber Amplifier Market Trends Analysis (2021-2032)
7.3.2 Fiber Amplifier Market Size Estimates and Forecasts to 2032 (USD Billion)
7.4 Others
7.4.1 Others Market Trends Analysis (2021-2032)
7.4.2 Others Market Size Estimates and Forecasts to 2032 (USD Billion)
8. Optical Amplifiers Market Segmentation By Function
8.1 Chapter Overview
8.2 Booster Amplifier
8.2.1 Booster Amplifier Market Trend Analysis (2021-2032)
8.2.2 Booster Amplifier Market Size Estimates and Forecasts to 2032 (USD Billion)
8.3 In-line Amplifier
8.3.1 In-line Amplifier Market Trend Analysis (2021-2032)
8.3.2 In-line Amplifier Market Size Estimates and Forecasts to 2032 (USD Billion)
8.4 Pre-Amplifier
8.4.1 Pre-Amplifier Market Trend Analysis (2021-2032)
8.4.2 Pre-Amplifier Market Size Estimates and Forecasts to 2032 (USD Billion)
9. Optical Amplifiers Market Segmentation By Industry Vertical
9.1 Chapter Overview
9.2 IT and Telecommunication
9.2.1 IT and Telecommunication Market Trends Analysis (2021-2032)
9.2.2 IT and Telecommunication Market Size Estimates and Forecasts to 2032 (USD Billion)
9.3 Industrial
9.3.1 Industrial Market Trends Analysis (2021-2032)
9.3.2 Industrial Market Size Estimates and Forecasts to 2032 (USD Billion)
9.4 Government and Defense
9.4.1 Government and Defense Market Trends Analysis (2021-2032)
9.4.2 Government and Defense Market Size Estimates and Forecasts to 2032 (USD Billion)
9.5 Healthcare and Life Sciences
9.5.1 Healthcare and Life Sciences Market Trends Analysis (2021-2032)
9.5.2 Healthcare and Life Sciences Market Size Estimates and Forecasts to 2032 (USD Billion)
9.6 Others
9.6.1 Others Market Trends Analysis (2021-2032)
9.6.2 Others Market Size Estimates and Forecasts to 2032 (USD Billion)
10. Regional Analysis
10.1 Chapter Overview
10.2 North America
10.2.1 Trends Analysis
10.2.2 North America Optical Amplifiers Market Estimates and Forecasts, by Country (2021-2032) (USD Billion)
10.2.3 North America Optical Amplifiers Market Estimates and Forecasts, By Type (2021-2032) (USD Billion)
10.2.4 North America Optical Amplifiers Market Estimates and Forecasts, By Function (2021-2032) (USD Billion)
10.2.5 North America Optical Amplifiers Market Estimates and Forecasts, By Industry Vertical (2021-2032) (USD Billion)
10.2.6 USA
10.2.6.1 USA Optical Amplifiers Market Estimates and Forecasts, By Type (2021-2032) (USD Billion)
10.2.6.2 USA Optical Amplifiers Market Estimates and Forecasts, By Function (2021-2032) (USD Billion)
10.2.6.3 USA Optical Amplifiers Market Estimates and Forecasts, By Industry Vertical (2021-2032) (USD Billion)
10.2.7 Canada
10.2.7.1 Canada Optical Amplifiers Market Estimates and Forecasts, By Type (2021-2032) (USD Billion)
10.2.7.2 Canada Optical Amplifiers Market Estimates and Forecasts, By Function (2021-2032) (USD Billion)
10.2.7.3 Canada Optical Amplifiers Market Estimates and Forecasts, By Industry Vertical (2021-2032) (USD Billion)
10.2.8 Mexico
10.2.8.1 Mexico Optical Amplifiers Market Estimates and Forecasts, By Type (2021-2032) (USD Billion)
10.2.8.2 Mexico Optical Amplifiers Market Estimates and Forecasts, By Function (2021-2032) (USD Billion)
10.2.8.3 Mexico Optical Amplifiers Market Estimates and Forecasts, By Industry Vertical (2021-2032) (USD Billion)
10.3 Europe
10.3.1 Trends Analysis
10.3.2 Europe Optical Amplifiers Market Estimates and Forecasts, by Country (2021-2032) (USD Billion)
10.3.3 Europe Optical Amplifiers Market Estimates and Forecasts, By Type (2021-2032) (USD Billion)
10.3.4 Europe Optical Amplifiers Market Estimates and Forecasts, By Function (2021-2032) (USD Billion)
10.3.5 Europe Optical Amplifiers Market Estimates and Forecasts, By Industry Vertical(2021-2032) (USD Billion)
10.3.6 Germany
10.3.1.6.1 Germany Optical Amplifiers Market Estimates and Forecasts, By Type (2021-2032) (USD Billion)
10.3.1.6.2 Germany Optical Amplifiers Market Estimates and Forecasts, By Function (2021-2032) (USD Billion)
10.3.1.6.3 Germany Optical Amplifiers Market Estimates and Forecasts, By Industry Vertical (2021-2032) (USD Billion)
10.3.7 France
10.3.7.1 France Optical Amplifiers Market Estimates and Forecasts, By Type (2021-2032) (USD Billion)
10.3.7.2 France a Optical Amplifiers Market Estimates and Forecasts, By Function (2021-2032) (USD Billion)
10.3.7.3 France Optical Amplifiers Market Estimates and Forecasts, By Industry Vertical (2021-2032) (USD Billion)
10.3.8 UK
10.3.8.1 UK Optical Amplifiers Market Estimates and Forecasts, By Type (2021-2032) (USD Billion)
10.3.8.2 UK Optical Amplifiers Market Estimates and Forecasts, By Function (2021-2032) (USD Billion)
10.3.8.3 UK Optical Amplifiers Market Estimates and Forecasts, By Industry Vertical (2021-2032) (USD Billion)
10.3.9 Italy
10.3.9.1 Italy Optical Amplifiers Market Estimates and Forecasts, By Type (2021-2032) (USD Billion)
10.3.9.2 Italy Optical Amplifiers Market Estimates and Forecasts, By Function (2021-2032) (USD Billion)
10.3.9.3 Italy Optical Amplifiers Market Estimates and Forecasts, By Industry Vertical (2021-2032) (USD Billion)
10.3.10 Spain
10.3.10.1 Spain Optical Amplifiers Market Estimates and Forecasts, By Type (2021-2032) (USD Billion)
10.3.10.2 Spain Optical Amplifiers Market Estimates and Forecasts, By Function (2021-2032) (USD Billion)
10.3.10.3 Spain Optical Amplifiers Market Estimates and Forecasts, By Industry Vertical (2021-2032) (USD Billion)
10.3.12 Poland
10.3.12.1 Poland Optical Amplifiers Market Estimates and Forecasts, by Country (2021-2032) (USD Billion)
10.3.12.1 Poland Optical Amplifiers Market Estimates and Forecasts, By Type (2021-2032) (USD Billion)
10.3.12.3 Poland Optical Amplifiers Market Estimates and Forecasts, By Function (2021-2032) (USD Billion)
10.3.12.3 Poland Optical Amplifiers Market Estimates and Forecasts, By Industry Vertical (2021-2032) (USD Billion)
10.3.13 Turkey
10.3.13.1 Turkey Optical Amplifiers Market Estimates and Forecasts, By Type (2021-2032) (USD Billion)
10.3.13.2 Turkey Optical Amplifiers Market Estimates and Forecasts, By Function (2021-2032) (USD Billion)
10.3.13.3 Turkey Optical Amplifiers Market Estimates and Forecasts, By Industry Vertical (2021-2032) (USD Billion)
10.3.14 Rest of Europe
10.3.14.1 Rest of Europe Optical Amplifiers Market Estimates and Forecasts, By Type (2021-2032) (USD Billion)
10.3.14.2 Rest of Europe Optical Amplifiers Market Estimates and Forecasts, By Function (2021-2032) (USD Billion)
10.3.14.3 Rest of Europe Optical Amplifiers Market Estimates and Forecasts, By Industry Vertical(2021-2032) (USD Billion)
10.4 Asia-Pacific
10.4.1 Trends Analysis
10.4.2 Asia-Pacific Optical Amplifiers Market Estimates and Forecasts, by Country (2021-2032) (USD Billion)
10.4.3 Asia-Pacific Optical Amplifiers Market Estimates and Forecasts, By Type (2021-2032) (USD Billion)
10.4.4 Asia-Pacific Optical Amplifiers Market Estimates and Forecasts, By Function (2021-2032) (USD Billion)
10.4.5 Asia-Pacific Optical Amplifiers Market Estimates and Forecasts, By Industry Vertical (2021-2032) (USD Billion)
10.4.6 China
10.4.6.1 China Optical Amplifiers Market Estimates and Forecasts, By Type (2021-2032) (USD Billion)
10.4.6.2 China Optical Amplifiers Market Estimates and Forecasts, By Function (2021-2032) (USD Billion)
10.4.6.3 China Optical Amplifiers Market Estimates and Forecasts, By Industry Vertical (2021-2032) (USD Billion)
10.4.7 India
10.4.7.1 India Optical Amplifiers Market Estimates and Forecasts, By Type (2021-2032) (USD Billion)
10.4.7.2 India Optical Amplifiers Market Estimates and Forecasts, By Function (2021-2032) (USD Billion)
10.4.7.3 India Optical Amplifiers Market Estimates and Forecasts, By Industry Vertical (2021-2032) (USD Billion)
10.4.8 Japan
10.4.8.1 Japan Optical Amplifiers Market Estimates and Forecasts, By Type (2021-2032) (USD Billion)
10.4.8.2 Japan Optical Amplifiers Market Estimates and Forecasts, By Function (2021-2032) (USD Billion)
10.4.8.3 Japan Optical Amplifiers Market Estimates and Forecasts, By Industry Vertical (2021-2032) (USD Billion)
10.4.9 South Korea
10.4.9.1 South Korea Optical Amplifiers Market Estimates and Forecasts, By Type (2021-2032) (USD Billion)
10.4.9.2 South Korea Optical Amplifiers Market Estimates and Forecasts, By Function (2021-2032) (USD Billion)
10.4.9.3 South Korea Optical Amplifiers Market Estimates and Forecasts, By Industry Vertical (2021-2032) (USD Billion)
10.4.10 Singapore
10.4.10.1 Singapore Optical Amplifiers Market Estimates and Forecasts, By Type (2021-2032) (USD Billion)
10.4.10.2 Singapore Optical Amplifiers Market Estimates and Forecasts, By Function (2021-2032) (USD Billion)
10.4.10.3 Singapore Optical Amplifiers Market Estimates and Forecasts, By Industry Vertical (2021-2032) (USD Billion)
10.4.11 Australia
10.4.11.1 Australia Optical Amplifiers Market Estimates and Forecasts, By Type (2021-2032) (USD Billion)
10.4.11.2 Australia Optical Amplifiers Market Estimates and Forecasts, By Function (2021-2032) (USD Billion)
10.4.11.3 Australia Optical Amplifiers Market Estimates and Forecasts, By Industry Vertical (2021-2032) (USD Billion)
10.4.12 Taiwan
10.4.12.1 Taiwan Optical Amplifiers Market Estimates and Forecasts, By Type (2021-2032) (USD Billion)
10.4.12.2 Taiwan Optical Amplifiers Market Estimates and Forecasts, By Function (2021-2032) (USD Billion)
10.4.12.3 Taiwan Optical Amplifiers Market Estimates and Forecasts, By Industry Vertical (2021-2032) (USD Billion)
10.4.13 Rest of Asia-Pacific
10.4.13.1 Rest of Asia-Pacific Optical Amplifiers Market Estimates and Forecasts, By Type (2021-2032) (USD Billion)
10.4.13.2 Rest of Asia-Pacific Optical Amplifiers Market Estimates and Forecasts, By Function (2021-2032) (USD Billion)
10.4.13.3 Rest of Asia-Pacific Optical Amplifiers Market Estimates and Forecasts, By Industry Vertical (2021-2032) (USD Billion)
10.5 Middle East and Africa
10.5.1 Trends Analysis
10.5.2 Middle East and Africa East Optical Amplifiers Market Estimates and Forecasts, by Country (2021-2032) (USD Billion)
10.5.3Middle East and Africa Optical Amplifiers Market Estimates and Forecasts, By Type (2021-2032) (USD Billion)
10.5.4 Middle East and Africa Optical Amplifiers Market Estimates and Forecasts, By Function (2021-2032) (USD Billion)
10.5.5 Middle East and Africa Optical Amplifiers Market Estimates and Forecasts, By Industry Vertical (2021-2032) (USD Billion)
10.5.6 UAE
10.5.6.1 UAE Optical Amplifiers Market Estimates and Forecasts, By Type (2021-2032) (USD Billion)
10.5.6.2 UAE Optical Amplifiers Market Estimates and Forecasts, By Function (2021-2032) (USD Billion)
10.5.6.3 UAE Optical Amplifiers Market Estimates and Forecasts, By Industry Vertical (2021-2032) (USD Billion)
10.5.7 Saudi Arabia
10.5.7.1 Saudi Arabia Optical Amplifiers Market Estimates and Forecasts, By Type (2021-2032) (USD Billion)
10.5.7.2 Saudi Arabia Optical Amplifiers Market Estimates and Forecasts, By Function (2021-2032) (USD Billion)
10.5.7.3 Saudi Arabia Optical Amplifiers Market Estimates and Forecasts, By Industry Vertical (2021-2032) (USD Billion)
10.5.8 Qatar
10.5.8.1 Qatar Optical Amplifiers Market Estimates and Forecasts, By Type (2021-2032) (USD Billion)
10.5.8.2 Qatar Optical Amplifiers Market Estimates and Forecasts, By Function (2021-2032) (USD Billion)
10.5.8.3 Qatar Optical Amplifiers Market Estimates and Forecasts, By Industry Vertical (2021-2032) (USD Billion)
10.5.9 South Africa
10.5.9 1 South Africa Optical Amplifiers Market Estimates and Forecasts, By Type (2021-2032) (USD Billion)
10.5.9 2 South Africa Optical Amplifiers Market Estimates and Forecasts By Function (2021-2032) (USD Billion)
10.5.9 3 South Africa Optical Amplifiers Market Estimates and Forecasts, By Industry Vertical (2021-2032) (USD Billion)
10.5.10 Rest of Middle East & Africa
10.5.10.1 Rest of Middle East & Africa Optical Amplifiers Market Estimates and Forecasts, By Type (2021-2032) (USD Billion)
10.5.10.2 Rest of Middle East & Africa Optical Amplifiers Market Estimates and Forecasts, By Function (2021-2032) (USD Billion)
10.5.10.3 Rest of Middle East & Africa Optical Amplifiers Market Estimates and Forecasts, By Industry Vertical (2021-2032) (USD Billion)
10.6 Latin America
10.6.1 Trends Analysis
10.6.2 Latin America Optical Amplifiers Market Estimates and Forecasts, by Country (2021-2032) (USD Billion)
10.6.3 Latin America Optical Amplifiers Market Estimates and Forecasts, By Type (2021-2032) (USD Billion)
10.6.4 Latin America Optical Amplifiers Market Estimates and Forecasts, By Function (2021-2032) (USD Billion)
10.6.5 Latin America Optical Amplifiers Market Estimates and Forecasts, By Industry Vertical (2021-2032) (USD Billion)
10.6.6 Brazil
10.6.6.1 Brazil Optical Amplifiers Market Estimates and Forecasts, By Type (2021-2032) (USD Billion)
10.6.6.2 Brazil Optical Amplifiers Market Estimates and Forecasts, By Function (2021-2032) (USD Billion)
10.6.6.3 Brazil Optical Amplifiers Market Estimates and Forecasts, By Industry Vertical (2021-2032) (USD Billion)
10.6.7 Argentina
10.6.7.1 Argentina Optical Amplifiers Market Estimates and Forecasts, By Type (2021-2032) (USD Billion)
10.6.7.2 Argentina Optical Amplifiers Market Estimates and Forecasts, By Function (2021-2032) (USD Billion)
10.6.7.3 Argentina Optical Amplifiers Market Estimates and Forecasts, By Industry Vertical (2021-2032) (USD Billion)
10.6.8 Rest of Latin America
10.6.8.1 Rest of Latin America Optical Amplifiers Market Estimates and Forecasts, By Type (2021-2032) (USD Billion)
10.6.8.2 Rest of Latin America Optical Amplifiers Market Estimates and Forecasts, By Function (2021-2032) (USD Billion)
10.6.8.3 Rest of Latin America Optical Amplifiers Market Estimates and Forecasts, By Industry Vertical (2021-2032) (USD Billion)
12. Company Profiles
12.1 Coherent Corp.
12.1.1 Company Overview
12.1.2 Financial
12.1.3 Products/ Services Offered
12.1.4 SWOT Analysis
12.2 Lumentum Holdings Inc.
12.2.1 Company Overview
12.2.2 Financial
12.2.3 Products/ Services Offered
12.2.4 SWOT Analysis
12.3 Accelink Technologies Co., Ltd.
12.3.1 Company Overview
12.3.2 Financial
12.3.3 Products/ Services Offered
12.3.4 SWOT Analysis
12.4 Wuxi Taclink Optoelectronics Technology Co., Ltd.
12.4.1 Company Overview
12.4.2 Financial
12.4.3 Products/ Services Offered
12.4.4 SWOT Analysis
12.5 Cisco Systems, Inc.
12.5.1 Company Overview
12.5.2 Financial
12.5.3 Products/ Services Offered
12.5.4 SWOT Analysis
12.6 Ciena Corporation
12.6.1 Company Overview
12.6.2 Financial
12.6.3 Products/ Services Offered
12.6.4 SWOT Analysis
12.7 Huawei Technologies Co., Ltd.
12.7.1 Company Overview
12.7.2 Financial
12.7.3 Products/ Services Offered
12.7.4 SWOT Analysis
12.8 Nokia Corporation
12.8.1 Company Overview
12.8.2 Financial
12.8.3 Products/ Services Offered
12.8.4 SWOT Analysis
12.9 Fujitsu Optical Components Limited
12.9.1 Company Overview
12.9.2 Financial
12.9.3 Products/ Services Offered
12.9.4 SWOT Analysis
12.10 NEC Corporation
12.10.1 Company Overview
12.10.2 Financial
12.10.3 Products/ Services Offered
12.10.4 SWOT Analysi
12. Use Cases and Best Practices
13. Conclusion
An accurate research report requires proper strategizing as well as implementation. There are multiple factors involved in the completion of good and accurate research report and selecting the best methodology to compete the research is the toughest part. Since the research reports we provide play a crucial role in any company’s decision-making process, therefore we at SNS Insider always believe that we should choose the best method which gives us results closer to reality. This allows us to reach at a stage wherein we can provide our clients best and accurate investment to output ratio.
Each report that we prepare takes a timeframe of 350-400 business hours for production. Starting from the selection of titles through a couple of in-depth brain storming session to the final QC process before uploading our titles on our website we dedicate around 350 working hours. The titles are selected based on their current market cap and the foreseen CAGR and growth.
The 5 steps process:
Step 1: Secondary Research:
Secondary Research or Desk Research is as the name suggests is a research process wherein, we collect data through the readily available information. In this process we use various paid and unpaid databases which our team has access to and gather data through the same. This includes examining of listed companies’ annual reports, Journals, SEC filling etc. Apart from this our team has access to various associations across the globe across different industries. Lastly, we have exchange relationships with various university as well as individual libraries.
Step 2: Primary Research
When we talk about primary research, it is a type of study in which the researchers collect relevant data samples directly, rather than relying on previously collected data. This type of research is focused on gaining content specific facts that can be sued to solve specific problems. Since the collected data is fresh and first hand therefore it makes the study more accurate and genuine.
We at SNS Insider have divided Primary Research into 2 parts.
Part 1 wherein we interview the KOLs of major players as well as the upcoming ones across various geographic regions. This allows us to have their view over the market scenario and acts as an important tool to come closer to the accurate market numbers. As many as 45 paid and unpaid primary interviews are taken from both the demand and supply side of the industry to make sure we land at an accurate judgement and analysis of the market.
This step involves the triangulation of data wherein our team analyses the interview transcripts, online survey responses and observation of on filed participants. The below mentioned chart should give a better understanding of the part 1 of the primary interview.
Part 2: In this part of primary research the data collected via secondary research and the part 1 of the primary research is validated with the interviews from individual consultants and subject matter experts.
Consultants are those set of people who have at least 12 years of experience and expertise within the industry whereas Subject Matter Experts are those with at least 15 years of experience behind their back within the same space. The data with the help of two main processes i.e., FGDs (Focused Group Discussions) and IDs (Individual Discussions). This gives us a 3rd party nonbiased primary view of the market scenario making it a more dependable one while collation of the data pointers.
Step 3: Data Bank Validation
Once all the information is collected via primary and secondary sources, we run that information for data validation. At our intelligence centre our research heads track a lot of information related to the market which includes the quarterly reports, the daily stock prices, and other relevant information. Our data bank server gets updated every fortnight and that is how the information which we collected using our primary and secondary information is revalidated in real time.
Step 4: QA/QC Process
After all the data collection and validation our team does a final level of quality check and quality assurance to get rid of any unwanted or undesired mistakes. This might include but not limited to getting rid of the any typos, duplication of numbers or missing of any important information. The people involved in this process include technical content writers, research heads and graphics people. Once this process is completed the title gets uploader on our platform for our clients to read it.
Step 5: Final QC/QA Process:
This is the last process and comes when the client has ordered the study. In this process a final QA/QC is done before the study is emailed to the client. Since we believe in giving our clients a good experience of our research studies, therefore, to make sure that we do not lack at our end in any way humanly possible we do a final round of quality check and then dispatch the study to the client.
Key Segments:
By Type
Semiconductor Optical Amplifier
Fiber Amplifier
Others
By Function
Booster Amplifier
In-line Amplifier
Pre-Amplifier
By Industry Vertical
IT and Telecommunication
Industrial
Government and Defense
Healthcare and Life Sciences
Others
Request for Segment Customization as per your Business Requirement: Segment Customization Request
Regional Coverage:
North America
US
Canada
Mexico
Europe
Germany
France
UK
Italy
Spain
Poland
Turkey
Rest of Europe
Asia Pacific
China
India
Japan
South Korea
Singapore
Australia
Taiwan
Rest of Asia Pacific
Middle East & Africa
UAE
Saudi Arabia
Qatar
South Africa
Rest of Middle East & Africa
Latin America
Brazil
Argentina
Rest of Latin America
Request for Country Level Research Report: Country Level Customization Request
Available Customization
With the given market data, SNS Insider offers customization as per the company’s specific needs. The following customization options are available for the report:
Detailed Volume Analysis
Criss-Cross segment analysis (e.g. Product X Application)
Competitive Product Benchmarking
Geographic Analysis
Additional countries in any of the regions
Customized Data Representation
Detailed analysis and profiling of additional market players