The Roll to Roll Printing Market size was valued at USD 14.11 billion in 2024 and is expected to reach USD 65.07 billion by 2032, growing at a CAGR of 21.12% over the forecast period of 2025-2032.
Roll to Roll Printing Market trends are driven by advancements in flexible electronics and printed sensor technologies. Increasing adoption in consumer electronics, healthcare, and energy sectors is accelerating market expansion.
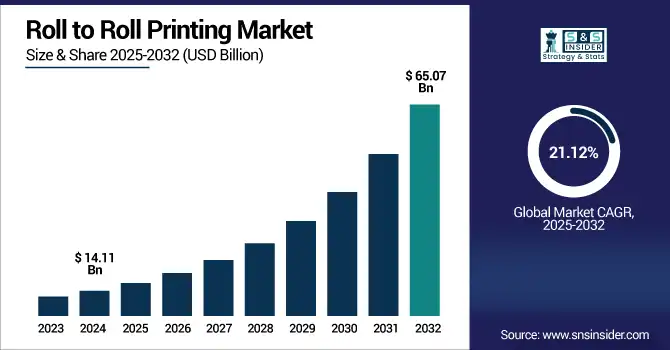
Growth of Roll to Roll Printing Market support a sustainable manufacturing process, advanced operational efficiency of low material waste, and lower energy consumption through their rapid production of flexible electronics by using very few raw materials. Additionally, the growing demand for smart packaging and IoT integrated labeling is pulling several key opportunities for the demand growth. Moreover, improvements in conductive inks and hybrid printing methods are improving the performance and reliability of the printed parts. Supportive government policies for green technologies, changing printing standard, and other factors are further adding to your market figure.
E Ink Holdings reported a 25% increase in adoption of roll-to-roll printed e-paper displays in electronic shelf labels and signage during 2025, supporting energy-efficient applications.
The U.S Roll to Roll Printing Market size was valued at USD 4.25 billion in 2024 and is expected to reach USD 19.19 billion by 2032, growing at a CAGR of 20.80% over the forecast period of 2025-2032. The U.S. Roll to Roll Printing Market is trending because of the increasing demand for flexible electronics, government support for sustainable manufacturing, and growing use of roll to roll printing technology in smart packaging, healthcare wearable, and energy applications.
Drivers:
Rising Demand for Flexible Low Cost Electronics Drives Growth in Roll to Roll Printing Market
Growing demand for lightweight, flexible, and low-cost electronic components in the industrial, consumer electronics, automotive, healthcare, and energy sectors is a key factor driving the global Roll to Roll Printing Market growth. Conventional R2R printing enables high-throughput, roll-to-roll process that can lower the manufacturing cost and material waste in a tremendous way. Such efficiency is pretty great as they are used to create flexible displays, printed sensors, and solar films. The growing trend of wearable devices and miniaturized IoT components also drives the demand for scalable, high-throughput printing methods.
Pilot shipments in 2024 included 850,000 printed glucose-sensing patches, showcasing scalable R2R fabrication of medical wearables.
Restraints:
Printing Defects and Material Limitations Restrict Advanced Applications in Roll to Roll Printing Technology
A Major Restraint in Roll to Roll (R2R) Printing Market is primarily due to inherent printing defects caused by variations in substrate properties, ink formulation, and environmental conditions, which are far more difficult to be detected and corrected in real-time. Moreover, R2R processes are not compatible with some advanced materials or multi-layer components, which limit the application fields of R2R in functional printing for sophisticated electronic modules and components
Opportunities:
Innovations in Conductive Inks and Substrates Unlock Growth in Smart Packaging RFID and Printed Batteries
Key area of opportunity is the innovation of high performing yet long-lasting conductive inks and printable substrates. In addition, it also creates new business opportunities with other applications such as the growth in smart packaging, RFID /NFC labeled goods, and printed batteries.
In 2024, hybrid graphene–silver composite inks delivered sheet resistances as low as 0.08 Ω/sq, enabling highly conductive, inkjet-printed e-textiles
Challenges:
Lack of Testing Standards and Integration Challenges Hinder Mass Production of Printed Electronic Components
The absence of standardized testing protocols and production guidelines specific to printed electronics is another significant obstacle. As a result, it becomes challenging to scale prototypes up to mass production, which is a key goal for high-reliability industries such as healthcare and automotive. In addition, R2R-printed parts typically need expensive customization and hybrid assembly processes for their integration into conventional electronics.
By Printing Technology
The segment of gravure printing held the largest share, accounting for 27.4% of the overall share 2024, due to its high-resolution printing capabilities with consistent quality prints, particularly for large scale runs. Flexible packaging and printed electronics and decorative films utilize the speed, reached and versatility of the substrates of this technology. Gravure is widely used in industry and can incorporate inks with a good conductive response, which makes it a popular solution for high-throughput R2R processing.
Inkjet printing is predicted to grow at the highest rate from 2025 to 2032 due to its versatility, low setup cost, and non-contact printing process. Inkjet technology is gaining traction in various emerging industries, thanks to an increase in customized electronics, smart labels, and on-demand manufacturing.
By Material Type
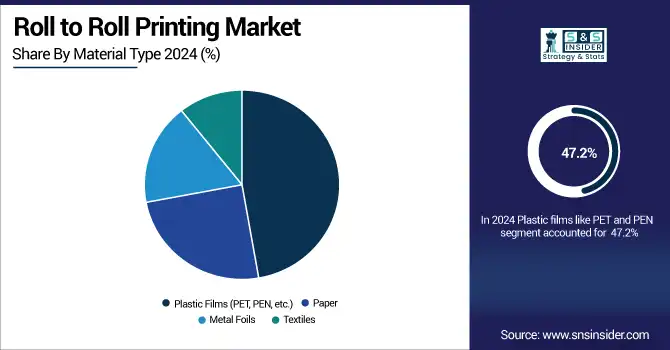
Plastic films like PET and PEN take a dominating lead in the Roll to Roll Printing Market with a 47.2% share in 2024, owing to their light weight, flexibility, chemical stability and compatibility to diverse conductive inks available in the market. Such substrates are also getting common in applications such as flexible displays, printed sensors, and wearable electronics, which demand a high level of transparency coupled with durability. Due to their ease of processing and scalability, they are one of the preferred candidates for high-volume R2R manufacturing.
Metal foil is projected to have the fastest growth from 2025 to 2032 due to their superior electrical electrical conductivity, thermal stability, and mechanical strength. Metal foils are capable of opening new challenging, energy-consuming applications and thus meet the increasing demand for printed batteries, power circuits, and advanced electronic components.
By Application
Flexible electronics led the Roll to Roll Printing Market and accounted for 34.5% in 2024, due to their widespread deployment in consumer electronics, medical wearables, and automotive displays. Printable circuit, display, and power source R2R printing allows us to massively, economically produce thin, lightweight and bendable as needed for next generation electronic devices. It can be printed on flexible substrates, such as PET and PEN allowing scalable manufacturing, which makes it an ideal fabrication technology for most, if not all, flexible electronics components.
In the 2024–2032 forecast period, the printed sensors segment is expected to be the fastest sector to grow because of the rise in applications in smart packaging, environmental monitoring, healthcare diagnostics, and industrial IoT. They can be fabricated from R2R printing with the merits of miniaturization, disposability, and integration with wireless systems, thus being more applicable in many sectors.
By End Use Industry
The consumer electronics segment holds the highest 35.5% in the Roll to Roll Printing Market share in 2024 owing to the rising need of lightweight, flexible, and compact devices like smartphone, tablets, foldable displays, and wearable gadgets. R2R printing allows the production of flexible circuits, antennas, and displays that balance both the performance needs of modern electronics and the miniaturization challenges of ever smaller handheld devices at high speeds and low costs.
The healthcare application segment is anticipated to witness the highest CAGR during 2025 to 2032 due to the increasing adoption of R2R printed biosensors, smart patches, and diagnostic wearables. Such versatile medical devices enable real-time health monitoring, point-of-care testing and remote patient care, and they play a key role in the evolution of digital health.
Regional Analysis:
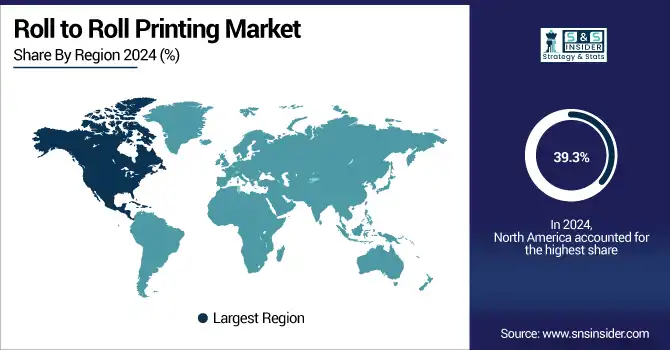
North America led the Roll to Roll (R2R) Printing Market with 39.3% in 2024, owing to wide technological infrastructure, strategic investments in flexible electronics and the presence of key market players. Its advanced R&D facilities and substantial public and private sector funding supports innovation in printed sensors, smart packaging and wearable devices in the region. Trends towards energy efficiency and sustainable manufacturing practices have also enabled the adoption of R2R printing technologies. Government initiatives to promote green electronics as well as IoT adoption in healthcare and automotive sectors have also boosted the marketplace in the region.
The U.S. holds a strong position in North America due, to its developed manufacturing eco-system, significant investment in printed and flexible electronics, and a well-established base of R2R printing tech providers.
The Roll to Roll (R2R) Printing Market in Asia Pacific is anticipated to register the highest growth rate during the forecast period, at a CAGR of 21.5% from 2025 to 2032, owing to rapid industrialization, rising manufacturing of electronics, and higher adoption of flexible and printed electronics. The region is characterized by robust government support, low production costs, along with increasing demand for high-end technologies, particularly in automotive, consumer electronics and healthcare markets. Increasing proliferation of smart packaging, IoT and wearable devices, coupled with a well-established semiconductor ecosystem, and these trends are further propelling the market growth.
Asia Pacific was led by China, owing to large electronics manufacturing base, supportive government initiatives, increasing demand of flexible electronics for healthcare, energy and consumer devices applications.
The European Roll to Roll printing market is growing steadily, encouraged by substantial research activities, sustainability objectives and printed electronics developments. With sustainable materials, energy-efficient production methods, and innovation in smart packaging and automotive electronics, the region is set to promote sustainable growth. Flexible devices are being commercialised at accelerated rate in part due to close collaboration between research institutions and industry players.
The growing configurations of investment in flexible electronics infrastructure and renewable energy technologies can play a major driving role in the growth of the Middle East& Africa (MEA) Roll to Roll Printing Market. Countries such as the UAE and South Africa are pioneering pilot programmes in printing Sensors, Solar films and Smart packaging. Environmental regulations and the diversification of energy provision have put an increasing focus on sustainable manufacturing in the region, driving interest in eco‑friendly R2R processes.
Key Players:
The Roll to Roll Printing companies are LG Display, Samsung, DuPont, 3M, BASF, Konica Minolta, Xerox, Sumitomo, Toppan, Fujifilm, Nitto Denko, Kodak, E Ink, Heraeus, Molex, Thin Film, NovaCentrix, Ceradrop, SIJ Technology, and Ynvisible.
In November 2024, LG unveiled the industry’s first stretchable display capable of 50% elongation (12″ to 18″), maintaining full color and 100 ppi resolution, and demonstrating durability over 10,000 stretch cycles.
In February 2025, Samsung Electronics introduced its ultra‑low‑power Color E‑Paper display, a slim, lightweight panel ideal for continuous R2R-like processing and energy-efficient digital signage.
Report Attributes | Details |
Market Size in 2024 | USD 14.11 Billion |
Market Size by 2032 | USD 65.07 Billon |
CAGR | CAGR of 21.12 % From 2025 to 2032 |
Base Year | 2024 |
Forecast Period | 2025-2032 |
Historical Data | 2021-2023 |
Report Scope & Coverage | Market Size, Segments Analysis, Competitive Landscape, Regional Analysis, DROC & SWOT Analysis, Forecast Outlook |
Key Segments | • By Printing Technology (Gravure, Flexographic, Inkjet, Screen Printing and Offset) • By Material Type (Plastic Films (PET, PEN, etc.), Paper, Metal Foils and Textiles) • By Application (Flexible Electronics, Printed Sensors, RFID Tags, Solar Panels and OLED Displays) • By End Use Industry (Consumer Electronics, Automotive, Healthcare, Energy and Packaging) |
Regional Analysis/Coverage | North America (US, Canada), Europe (Germany, UK, France, Italy, Spain, Russia, Poland, Rest of Europe), Asia Pacific (China, India, Japan, South Korea, Australia, ASEAN Countries, Rest of Asia Pacific), Middle East & Africa (UAE, Saudi Arabia, Qatar, South Africa, Rest of Middle East & Africa), Latin America (Brazil, Argentina, Mexico, Colombia, Rest of Latin America). |
Company Profiles | LG Display, Samsung, DuPont, 3M, BASF, Konica Minolta, Xerox, Sumitomo, Toppan, Fujifilm, Nitto Denko, Kodak, E Ink, Heraeus, Molex, Thin Film, NovaCentrix, Ceradrop, SIJ Technology, and Ynvisible. |
Ans: The Roll to Roll Printing Market is expected to grow at a CAGR of 21.12% from 2025-2032.
Ans: The Roll to Roll Printing Market size was USD 14.11 Billion in 2024 and is expected to reach USD 65.07 Billion by 2032.
Ans: The major growth factor of the Roll-to-Roll Printing Market is the rising demand for low-cost, large-scale production of flexible and wearable electronics.
Ans: The Flexible Electronics segment dominated the Roll to Roll Printing Market in 2024.
Ans: North America dominated the Roll to Roll Printing Market in 2024.
Table Of Contents
1. Introduction
1.1 Market Definition & Scope
1.2 Research Assumptions & Abbreviations
1.3 Research Methodology
2. Executive Summary
2.1 Market Snapshot
2.2 Market Absolute $ Opportunity Assessment & Y-o-Y Analysis, 2021–2032
2.3 Market Size & Forecast, By Segmentation, 2021–2032
2.3.1 Market Size By Printing Technology
2.3.2 Market Size By Material Type
2.4 Market Share & Bps Analysis By Region, 2024
2.5 Industry Growth Scenarios – Conservative, Likely & Optimistic
2.6 Industry CxO’s Perspective
3. Market Overview
3.1 Market Dynamics
3.1.1 Drivers
3.1.2 Restraints
3.1.3 Opportunities
3.1.4 Key Market Trends
3.2 Industry PESTLE Analysis
3.3 Key Industry Forces (Porter’s) Impacting Market Growth
3.4 Industry Supply Chain Analysis
3.4.1 Raw Material Suppliers
3.4.2 Manufacturers
3.4.3 Distributors/Suppliers
3.4.4 Customers/End-Users
3.5 Industry Life Cycle Assessment
3.6 Parent Market Overview
3.7 Market Risk Assessment
4. Statistical Insights & Trends Reporting
4.1 Workflow Efficiency Metrics
4.1.1 Average Setup Time per Print Job (in minutes) across industries
4.1.2 Print Job Changeover Frequency per Month
4.1.3 Operator-to-Machine Ratio in R2R Facilities
4.1.4 Automation Level Score by Application (score 1–10 scale)
4.1.5 Workflow Downtime Causes: % Split (Maintenance, Calibration, Material Shortage)
4.2 Material Innovation Indicators
4.2.1 Share of New-Gen Substrates (e.g., Graphene, Nanocellulose) in Total Usage
4.2.2 Material Compatibility Index by Printer Type
4.2.3 Material Shrinkage or Warping Rate during R2R Process
4.2.4 Ink Absorption Time by Substrate (Milliseconds)
4.2.5 Multi-layer Printing Adoption Rate (% of total output)
4.3 Economic Impact Metrics
4.3.1 Local Job Creation per $10M Invested in R2R Printing
4.3.2 Export-to-Domestic Ratio of R2R-Printed Products
4.3.3 Contribution to Regional Manufacturing GDP (%)
4.3.4 CapEx vs. OpEx Ratio in R2R Facility Investments
4.3.5 Estimated Value of Waste Reduction (USD/Year)
4.4 Process Quality Control Statistics
4.4.1 Defect Rate per 10,000 Printed Meters
4.4.2 Real-Time Monitoring Usage Rate (% of Facilities)
4.4.3 Color Consistency Index across Runs (Delta E Values)
4.4.4 Average Calibration Frequency per Month
4.4.5 In-Line Inspection System Penetration Rate (% of installations)
4.5 Market Penetration by Device Form Factor
4.5.1 Share of R2R Tech Used in Wearables vs. Large Format Displays
4.5.2 Flexible Sensor Integration Rate per 1,000 Devices
4.5.3 Adoption Rate of R2R in Microfluidic and Bio-MEMS Sectors
4.5.4 Hybrid R2R-Etching Line Deployment Frequency by Country
4.5.5 % of Consumer Electronics Using R2R Components
5. Roll to Roll Printing Market Segmental Analysis & Forecast, By Printing Technology, 2021 – 2032, Value (USD Billion)
5.1 Introduction
5.2 Gravure
5.2.1 Key Trends
5.2.2 Market Size & Forecast, 2021 – 2032
5.3 Flexographic
5.3.1 Key Trends
5.3.2 Market Size & Forecast, 2021 – 2032
5.4 Inkjet
5.4.1 Key Trends
5.4.2 Market Size & Forecast, 2021 – 2032
5.5 Screen Printing
5.5.1 Key Trends
5.5.2 Market Size & Forecast, 2021 – 2032
5.6 Offset
5.6.1 Key Trends
5.6.2 Market Size & Forecast, 2021 – 2032
6. Roll to Roll Printing Market Segmental Analysis & Forecast, By Material Type, 2021 – 2032, Value (USD Billion)
6.1 Introduction
6.2 Plastic Films (PET, PEN, etc.)
6.2.1 Key Trends
6.2.2 Market Size & Forecast, 2021 – 2032
6.3 Paper
6.3.1 Key Trends
6.3.2 Market Size & Forecast, 2021 – 2032
6.4 Metal Foils
6.4.1 Key Trends
6.4.2 Market Size & Forecast, 2021 – 2032
6.5 Textiles
6.5.1 Key Trends
6.5.2 Market Size & Forecast, 2021 – 2032
7. Roll to Roll Printing Market Segmental Analysis & Forecast, By Application, 2021 – 2032, Value (USD Billion)
7.1 Introduction
7.2 Flexible Electronics
7.2.1 Key Trends
7.2.2 Market Size & Forecast, 2021 – 2032
7.3 Printed Sensors
7.3.1 Key Trends
7.3.2 Market Size & Forecast, 2021 – 2032
7.4 RFID Tags
7.4.1 Key Trends
7.4.2 Market Size & Forecast, 2021 – 2032
7.5 Solar Panels
7.5.1 Key Trends
7.5.2 Market Size & Forecast, 2021 – 2032
7.6 OLED Displays
7.6.1 Key Trends
7.6.2 Market Size & Forecast, 2021 – 2032
8. Roll to Roll Printing Market Segmental Analysis & Forecast, By End Use Industry, 2021 – 2032, Value (USD Billion)
8.1 Introduction
8.2 Consumer Electronics
8.2.1 Key Trends
8.2.2 Market Size & Forecast, 2021 – 2032
8.3 Automotive
8.3.1 Key Trends
8.3.2 Market Size & Forecast, 2021 – 2032
8.4 Healthcare
8.4.1 Key Trends
8.4.2 Market Size & Forecast, 2021 – 2032
8.5 Energy
8.5.1 Key Trends
8.5.2 Market Size & Forecast, 2021 – 2032
8.6 Packaging
8.6.1 Key Trends
8.6.2 Market Size & Forecast, 2021 – 2032
9. Roll to Roll Printing Market Segmental Analysis & Forecast By Region, 2021 – 2025, Value (USD Billion)
9.1 Introduction
9.2 North America
9.2.1 Key Trends
9.2.2 Roll to Roll Printing Market Size & Forecast, By Printing Technology, 2021 – 2032
9.2.3 Roll to Roll Printing Market Size & Forecast, By Material Type, 2021 – 2032
9.2.4 Roll to Roll Printing Market Size & Forecast, By Application, 2021 – 2032
9.2.5 Roll to Roll Printing Market Size & Forecast, By End Use Industry, 2021 – 2032
9.2.6 Roll to Roll Printing Market Size & Forecast, By Country, 2021 – 2032
9.2.6.1 USA
9.2.6.1.1 Roll to Roll Printing Market Size & Forecast, By Printing Technology, 2021 – 2032
9.2.6.1.2 Roll to Roll Printing Market Size & Forecast, By Material Type, 2021 – 2032
9.2.6.1.3 Roll to Roll Printing Market Size & Forecast, By Application, 2021 – 2032
9.2.6.1.4 Roll to Roll Printing Market Size & Forecast, By End Use Industry, 2021 – 2032
9.2.6.2 Canada
9.2.6.2.1 Roll to Roll Printing Market Size & Forecast, By Printing Technology, 2021 – 2032
9.2.6.2.2 Roll to Roll Printing Market Size & Forecast, By Material Type, 2021 – 2032
9.2.6.2.3 Roll to Roll Printing Market Size & Forecast, By Application, 2021 – 2032
9.2.6.2.4 Roll to Roll Printing Market Size & Forecast, By End Use Industry, 2021 – 2032
9.3 Europe
9.3.1 Key Trends
9.3.2 Roll to Roll Printing Market Size & Forecast, By Printing Technology, 2021 – 2032
9.3.3 Roll to Roll Printing Market Size & Forecast, By Material Type, 2021 – 2032
9.3.4 Roll to Roll Printing Market Size & Forecast, By Application, 2021 – 2032
9.3.5 Roll to Roll Printing Market Size & Forecast, By End Use Industry, 2021 – 2032
9.3.6 Roll to Roll Printing Market Size & Forecast, By Country, 2021 – 2032
9.3.6.1 Germany
9.3.6.1.1 Roll to Roll Printing Market Size & Forecast, By Printing Technology, 2021 – 2032
9.3.6.1.2 Roll to Roll Printing Market Size & Forecast, By Material Type, 2021 – 2032
9.3.6.1.3 Roll to Roll Printing Market Size & Forecast, By Application, 2021 – 2032
9.3.6.1.4 Roll to Roll Printing Market Size & Forecast, By End Use Industry, 2021 – 2032
9.3.6.2 UK
9.3.6.2.1 Roll to Roll Printing Market Size & Forecast, By Printing Technology, 2021 – 2032
9.3.6.2.2 Roll to Roll Printing Market Size & Forecast, By Material Type, 2021 – 2032
9.3.6.2.3 Roll to Roll Printing Market Size & Forecast, By Application, 2021 – 2032
9.3.6.2.4 Roll to Roll Printing Market Size & Forecast, By End Use Industry, 2021 – 2032
9.3.6.3 France
9.3.6.3.1 Roll to Roll Printing Market Size & Forecast, By Printing Technology, 2021 – 2032
9.3.6.3.2 Roll to Roll Printing Market Size & Forecast, By Material Type, 2021 – 2032
9.3.6.3.3 Roll to Roll Printing Market Size & Forecast, By Application, 2021 – 2032
9.3.6.3.4 Roll to Roll Printing Market Size & Forecast, By End Use Industry, 2021 – 2032
9.3.6.4 Italy
9.3.6.4.1 Roll to Roll Printing Market Size & Forecast, By Printing Technology, 2021 – 2032
9.3.6.4.2 Roll to Roll Printing Market Size & Forecast, By Material Type, 2021 – 2032
9.3.6.4.3 Roll to Roll Printing Market Size & Forecast, By Application, 2021 – 2032
9.3.6.4.4 Roll to Roll Printing Market Size & Forecast, By End Use Industry, 2021 – 2032
9.3.6.5 Spain
9.3.6.5.1 Roll to Roll Printing Market Size & Forecast, By Printing Technology, 2021 – 2032
9.3.6.5.2 Roll to Roll Printing Market Size & Forecast, By Material Type, 2021 – 2032
9.3.6.5.3 Roll to Roll Printing Market Size & Forecast, By Application, 2021 – 2032
9.3.6.5.4 Roll to Roll Printing Market Size & Forecast, By End Use Industry, 2021 – 2032
9.3.6.6 Russia
9.3.6.6.1 Roll to Roll Printing Market Size & Forecast, By Printing Technology, 2021 – 2032
9.3.6.6.2 Roll to Roll Printing Market Size & Forecast, By Material Type, 2021 – 2032
9.3.6.6.3 Roll to Roll Printing Market Size & Forecast, By Application, 2021 – 2032
9.3.6.6.4 Roll to Roll Printing Market Size & Forecast, By End Use Industry, 2021 – 2032
9.3.6.7 Poland
9.3.6.7.1 Roll to Roll Printing Market Size & Forecast, By Printing Technology, 2021 – 2032
9.3.6.7.2 Roll to Roll Printing Market Size & Forecast, By Material Type, 2021 – 2032
9.3.6.7.3 Roll to Roll Printing Market Size & Forecast, By Application, 2021 – 2032
9.3.6.7.4 Roll to Roll Printing Market Size & Forecast, By End Use Industry, 2021 – 2032
9.3.6.8 Rest of Europe
9.3.6.8.1 Roll to Roll Printing Market Size & Forecast, By Printing Technology, 2021 – 2032
9.3.6.8.2 Roll to Roll Printing Market Size & Forecast, By Material Type, 2021 – 2032
9.3.6.8.3 Roll to Roll Printing Market Size & Forecast, By Application, 2021 – 2032
9.3.6.8.4 Roll to Roll Printing Market Size & Forecast, By End Use Industry, 2021 – 2032
9.4 Asia-Pacific
9.4.1 Key Trends
9.4.2 Roll to Roll Printing Market Size & Forecast, By Printing Technology, 2021 – 2032
9.4.3 Roll to Roll Printing Market Size & Forecast, By Material Type, 2021 – 2032
9.4.4 Roll to Roll Printing Market Size & Forecast, By Application, 2021 – 2032
9.4.5 Roll to Roll Printing Market Size & Forecast, By End Use Industry, 2021 – 2032
9.4.6 Roll to Roll Printing Market Size & Forecast, By Country, 2021 – 2032
9.4.6.1 China
9.4.6.1.1 Roll to Roll Printing Market Size & Forecast, By Printing Technology, 2021 – 2032
9.4.6.1.2 Roll to Roll Printing Market Size & Forecast, By Material Type, 2021 – 2032
9.4.6.1.3 Roll to Roll Printing Market Size & Forecast, By Application, 2021 – 2032
9.4.6.1.4 Roll to Roll Printing Market Size & Forecast, By End Use Industry, 2021 – 2032
9.4.6.2 India
9.4.6.2.1 Roll to Roll Printing Market Size & Forecast, By Printing Technology, 2021 – 2032
9.4.6.2.2 Roll to Roll Printing Market Size & Forecast, By Material Type, 2021 – 2032
9.4.6.2.3 Roll to Roll Printing Market Size & Forecast, By Application, 2021 – 2032
9.4.6.2.4 Roll to Roll Printing Market Size & Forecast, By End Use Industry, 2021 – 2032
9.4.6.3 Japan
9.4.6.3.1 Roll to Roll Printing Market Size & Forecast, By Printing Technology, 2021 – 2032
9.4.6.3.2 Roll to Roll Printing Market Size & Forecast, By Material Type, 2021 – 2032
9.4.6.3.3 Roll to Roll Printing Market Size & Forecast, By Application, 2021 – 2032
9.4.6.3.4 Roll to Roll Printing Market Size & Forecast, By End Use Industry, 2021 – 2032
9.4.6.4 South Korea
9.4.6.4.1 Roll to Roll Printing Market Size & Forecast, By Printing Technology, 2021 – 2032
9.4.6.4.2 Roll to Roll Printing Market Size & Forecast, By Material Type, 2021 – 2032
9.4.6.4.3 Roll to Roll Printing Market Size & Forecast, By Application, 2021 – 2032
9.4.6.4.4 Roll to Roll Printing Market Size & Forecast, By End Use Industry, 2021 – 2032
9.4.6.5 Australia
9.4.6.5.1 Roll to Roll Printing Market Size & Forecast, By Printing Technology, 2021 – 2032
9.4.6.5.2 Roll to Roll Printing Market Size & Forecast, By Material Type, 2021 – 2032
9.4.6.5.3 Roll to Roll Printing Market Size & Forecast, By Application, 2021 – 2032
9.4.6.5.4 Roll to Roll Printing Market Size & Forecast, By End Use Industry, 2021 – 2032
9.4.6.6 ASEAN Countries
9.4.6.6.1 Roll to Roll Printing Market Size & Forecast, By Printing Technology, 2021 – 2032
9.4.6.6.2 Roll to Roll Printing Market Size & Forecast, By Material Type, 2021 – 2032
9.4.6.6.3 Roll to Roll Printing Market Size & Forecast, By Application, 2021 – 2032
9.4.6.6.4 Roll to Roll Printing Market Size & Forecast, By End Use Industry, 2021 – 2032
9.4.6.7 Rest of Asia-Pacific
9.4.6.7.1 Roll to Roll Printing Market Size & Forecast, By Printing Technology, 2021 – 2032
9.4.6.7.2 Roll to Roll Printing Market Size & Forecast, By Material Type, 2021 – 2032
9.4.6.7.3 Roll to Roll Printing Market Size & Forecast, By Application, 2021 – 2032
9.4.6.7.4 Roll to Roll Printing Market Size & Forecast, By End Use Industry, 2021 – 2032
9.5 Latin America
9.5.1 Key Trends
9.5.2 Roll to Roll Printing Market Size & Forecast, By Printing Technology, 2021 – 2032
9.5.3 Roll to Roll Printing Market Size & Forecast, By Material Type, 2021 – 2032
9.5.4 Roll to Roll Printing Market Size & Forecast, By Application, 2021 – 2032
9.5.5 Roll to Roll Printing Market Size & Forecast, By End Use Industry, 2021 – 2032
9.5.6 Roll to Roll Printing Market Size & Forecast, By Country, 2021 – 2032
9.5.6.1 Brazil
9.5.6.1.1 Roll to Roll Printing Market Size & Forecast, By Printing Technology, 2021 – 2032
9.5.6.1.2 Roll to Roll Printing Market Size & Forecast, By Material Type, 2021 – 2032
9.5.6.1.3 Roll to Roll Printing Market Size & Forecast, By Application, 2021 – 2032
9.5.6.1.4 Roll to Roll Printing Market Size & Forecast, By End Use Industry, 2021 – 2032
9.5.6.2 Argentina
9.5.6.2.1 Roll to Roll Printing Market Size & Forecast, By Printing Technology, 2021 – 2032
9.5.6.2.2 Roll to Roll Printing Market Size & Forecast, By Material Type, 2021 – 2032
9.5.6.2.3 Roll to Roll Printing Market Size & Forecast, By Application, 2021 – 2032
9.5.6.2.4 Roll to Roll Printing Market Size & Forecast, By End Use Industry, 2021 – 2032
9.5.6.3 Mexico
9.5.6.3.1 Roll to Roll Printing Market Size & Forecast, By Printing Technology, 2021 – 2032
9.5.6.3.2 Roll to Roll Printing Market Size & Forecast, By Material Type, 2021 – 2032
9.5.6.3.3 Roll to Roll Printing Market Size & Forecast, By Application, 2021 – 2032
9.5.6.3.4 Roll to Roll Printing Market Size & Forecast, By End Use Industry, 2021 – 2032
9.5.6.4 Colombia
9.5.6.4.1 Roll to Roll Printing Market Size & Forecast, By Printing Technology, 2021 – 2032
9.5.6.4.2 Roll to Roll Printing Market Size & Forecast, By Material Type, 2021 – 2032
9.5.6.4.3 Roll to Roll Printing Market Size & Forecast, By Application, 2021 – 2032
9.5.6.4.4 Roll to Roll Printing Market Size & Forecast, By End Use Industry, 2021 – 2032
9.5.6.5 Rest of Latin America
9.5.6.5.1 Roll to Roll Printing Market Size & Forecast, By Printing Technology, 2021 – 2032
9.5.6.5.2 Roll to Roll Printing Market Size & Forecast, By Material Type, 2021 – 2032
9.5.6.5.3 Roll to Roll Printing Market Size & Forecast, By Application, 2021 – 2032
9.5.6.5.4 Roll to Roll Printing Market Size & Forecast, By End Use Industry, 2021 – 2032
9.6 Middle East & Africa
9.6.1 Key Trends
9.6.2 Roll to Roll Printing Market Size & Forecast, By Printing Technology, 2021 – 2032
9.6.3 Roll to Roll Printing Market Size & Forecast, By Material Type, 2021 – 2032
9.6.4 Roll to Roll Printing Market Size & Forecast, By Application, 2021 – 2032
9.6.5 Roll to Roll Printing Market Size & Forecast, By End Use Industry, 2021 – 2032
9.6.6 Roll to Roll Printing Market Size & Forecast, By Country, 2021 – 2032
9.6.6.1 UAE
9.6.6.1.1 Roll to Roll Printing Market Size & Forecast, By Printing Technology, 2021 – 2032
9.6.6.1.2 Roll to Roll Printing Market Size & Forecast, By Material Type, 2021 – 2032
9.6.6.1.3 Roll to Roll Printing Market Size & Forecast, By Application, 2021 – 2032
9.6.6.1.4 Roll to Roll Printing Market Size & Forecast, By End Use Industry, 2021 – 2032
9.6.6.2 Saudi Arabia
9.6.6.2.1 Roll to Roll Printing Market Size & Forecast, By Printing Technology, 2021 – 2032
9.6.6.2.2 Roll to Roll Printing Market Size & Forecast, By Material Type, 2021 – 2032
9.6.6.2.3 Roll to Roll Printing Market Size & Forecast, By Application, 2021 – 2032
9.6.6.2.4 Roll to Roll Printing Market Size & Forecast, By End Use Industry, 2021 – 2032
9.6.6.3 Qatar
9.6.6.3.1 Roll to Roll Printing Market Size & Forecast, By Printing Technology, 2021 – 2032
9.6.6.3.2 Roll to Roll Printing Market Size & Forecast, By Material Type, 2021 – 2032
9.6.6.3.3 Roll to Roll Printing Market Size & Forecast, By Application, 2021 – 2032
9.6.6.3.4 Roll to Roll Printing Market Size & Forecast, By End Use Industry, 2021 – 2032
9.6.6.4 Egypt
9.6.6.4.1 Roll to Roll Printing Market Size & Forecast, By Printing Technology, 2021 – 2032
9.6.6.4.2 Roll to Roll Printing Market Size & Forecast, By Material Type, 2021 – 2032
9.6.6.4.3 Roll to Roll Printing Market Size & Forecast, By Application, 2021 – 2032
9.6.6.4.4 Roll to Roll Printing Market Size & Forecast, By End Use Industry, 2021 – 2032
9.6.6.5 South Africa
9.6.6.5.1 Roll to Roll Printing Market Size & Forecast, By Printing Technology, 2021 – 2032
9.6.6.5.2 Roll to Roll Printing Market Size & Forecast, By Material Type, 2021 – 2032
9.6.6.5.3 Roll to Roll Printing Market Size & Forecast, By Application, 2021 – 2032
9.6.6.5.4 Roll to Roll Printing Market Size & Forecast, By End Use Industry, 2021 – 2032
9.6.6.6 Rest of Middle East & Africa
9.6.6.6.1 Roll to Roll Printing Market Size & Forecast, By Printing Technology, 2021 – 2032
9.6.6.6.2 Roll to Roll Printing Market Size & Forecast, By Material Type, 2021 – 2032
9.6.6.6.3 Roll to Roll Printing Market Size & Forecast, By Application, 2021 – 2032
9.6.6.6.4 Roll to Roll Printing Market Size & Forecast, By End Use Industry, 2021 – 2032
10. Competitive Landscape
10.1 Key Players' Positioning
10.2 Competitive Developments
10.2.1 Key Strategies Adopted (%), By Key Players, 2024
10.2.2 Year-Wise Strategies & Development, 2021 – 2025
10.2.3 Number Of Strategies Adopted By Key Players, 2024
10.3 Market Share Analysis, 2024
10.4 Product/Service & Application Benchmarking
10.4.1 Product/Service Specifications & Features By Key Players
10.4.2 Product/Service Heatmap By Key Players
10.4.3 Application Heatmap By Key Players
10.5 Industry Start-Up & Innovation Landscape
10.6 Key Company Profiles
10.6.1 LG Display.
10.6.1.1 Company Overview & Snapshot
10.6.1.2 Product/Service Portfolio
10.6.1.3 Key Company Financials
10.6.1.4 SWOT Analysis
10.6.2 Samsung Electronics.
10.6.2.1 Company Overview & Snapshot
10.6.2.2 Product/Service Portfolio
10.6.2.3 Key Company Financials
10.6.2.4 SWOT Analysis
10.6.3 DuPont.
10.6.3.1 Company Overview & Snapshot
10.6.3.2 Product/Service Portfolio
10.6.3.3 Key Company Financials
10.6.3.4 SWOT Analysis
10.6.4 3M.
10.6.4.1 Company Overview & Snapshot
10.6.4.2 Product/Service Portfolio
10.6.4.3 Key Company Financials
10.6.4.4 SWOT Analysis
10.6.5 BASF.
10.6.5.1 Company Overview & Snapshot
10.6.5.2 Product/Service Portfolio
10.6.5.3 Key Company Financials
10.6.5.4 SWOT Analysis
10.6.6 Konica Minolta
10.6.6.1 Company Overview & Snapshot
10.6.6.2 Product/Service Portfolio
10.6.6.3 Key Company Financials
10.6.6.4 SWOT Analysis
10.6.7 Xerox Corporation.
10.6.7.1 Company Overview & Snapshot
10.6.7.2 Product/Service Portfolio
10.6.7.3 Key Company Financials
10.6.7.4 SWOT Analysis
10.6.8 Sumitomo Electric Industries
10.6.8.1 Company Overview & Snapshot
10.6.8.2 Product/Service Portfolio
10.6.8.3 Key Company Financials
10.6.8.4 SWOT Analysis
10.6.9 Toppan Printing Co., Ltd
10.6.9.1 Company Overview & Snapshot
10.6.9.2 Product/Service Portfolio
10.6.9.3 Key Company Financials
10.6.9.4 SWOT Analysis
10.6.10 Fujifilm Dimatix
10.6.10.1 Company Overview & Snapshot
10.6.10.2 Product/Service Portfolio
10.6.10.3 Key Company Financials
10.6.10.4 SWOT Analysis
10.6.11 Nitto Denko Corporation
10.6.11.1 Company Overview & Snapshot
10.6.11.2 Product/Service Portfolio
10.6.11.3 Key Company Financials
10.6.11.4 SWOT Analysis
10.6.12 Kodak
10.6.12.1 Company Overview & Snapshot
10.6.12.2 Product/Service Portfolio
10.6.12.3 Key Company Financials
10.6.12.4 SWOT Analysis
10.6.13 E Ink Holdings
10.6.13.1 Company Overview & Snapshot
10.6.13.2 Product/Service Portfolio
10.6.13.3 Key Company Financials
10.6.13.4 SWOT Analysis
10.6.14 Heraeus
10.6.14.1 Company Overview & Snapshot
10.6.14.2 Product/Service Portfolio
10.6.14.3 Key Company Financials
10.6.14.4 SWOT Analysis
10.6.15 Molex
10.6.15.1 Company Overview & Snapshot
10.6.15.2 Product/Service Portfolio
10.6.15.3 Key Company Financials
10.6.15.4 SWOT Analysis
10.6.16 Thin Film Electronics ASA
10.6.16.1 Company Overview & Snapshot
10.6.16.2 Product/Service Portfolio
10.6.16.3 Key Company Financials
10.6.16.4 SWOT Analysis
10.6.17 NovaCentrix.
10.6.17.1 Company Overview & Snapshot
10.6.17.2 Product/Service Portfolio
10.6.17.3 Key Company Financials
10.6.17.4 SWOT Analysis
10.6.18 Ceradrop.
10.6.18.1 Company Overview & Snapshot
10.6.18.2 Product/Service Portfolio
10.6.18.3 Key Company Financials
10.6.18.4 SWOT Analysis
10.6.19 SIJ Technology, Inc
10.6.19.1 Company Overview & Snapshot
10.6.19.2 Product/Service Portfolio
10.6.19.3 Key Company Financials
10.6.19.4 SWOT Analysis
10.6.20 Ynvisible Interactive Inc.
10.6.20.1 Company Overview & Snapshot
10.6.20.2 Product/Service Portfolio
10.6.20.3 Key Company Financials
10.6.20.4 SWOT Analysis
11. Analyst Recommendations
11.1 SNS Insider Opportunity Map
11.2 Industry Low-Hanging Fruit Assessment
11.3 Market Entry & Growth Strategy
11.4 Analyst Viewpoint & Suggestions On Market Growth
12. Assumptions
13. Disclaimer
14. Appendix
14.1 List Of Tables
14.2 List Of Figures
An accurate research report requires proper strategizing as well as implementation. There are multiple factors involved in the completion of good and accurate research report and selecting the best methodology to compete the research is the toughest part. Since the research reports we provide play a crucial role in any company’s decision-making process, therefore we at SNS Insider always believe that we should choose the best method which gives us results closer to reality. This allows us to reach at a stage wherein we can provide our clients best and accurate investment to output ratio.
Each report that we prepare takes a timeframe of 350-400 business hours for production. Starting from the selection of titles through a couple of in-depth brain storming session to the final QC process before uploading our titles on our website we dedicate around 350 working hours. The titles are selected based on their current market cap and the foreseen CAGR and growth.
The 5 steps process:
Step 1: Secondary Research:
Secondary Research or Desk Research is as the name suggests is a research process wherein, we collect data through the readily available information. In this process we use various paid and unpaid databases which our team has access to and gather data through the same. This includes examining of listed companies’ annual reports, Journals, SEC filling etc. Apart from this our team has access to various associations across the globe across different industries. Lastly, we have exchange relationships with various university as well as individual libraries.
Step 2: Primary Research
When we talk about primary research, it is a type of study in which the researchers collect relevant data samples directly, rather than relying on previously collected data. This type of research is focused on gaining content specific facts that can be sued to solve specific problems. Since the collected data is fresh and first hand therefore it makes the study more accurate and genuine.
We at SNS Insider have divided Primary Research into 2 parts.
Part 1 wherein we interview the KOLs of major players as well as the upcoming ones across various geographic regions. This allows us to have their view over the market scenario and acts as an important tool to come closer to the accurate market numbers. As many as 45 paid and unpaid primary interviews are taken from both the demand and supply side of the industry to make sure we land at an accurate judgement and analysis of the market.
This step involves the triangulation of data wherein our team analyses the interview transcripts, online survey responses and observation of on filed participants. The below mentioned chart should give a better understanding of the part 1 of the primary interview.
Part 2: In this part of primary research the data collected via secondary research and the part 1 of the primary research is validated with the interviews from individual consultants and subject matter experts.
Consultants are those set of people who have at least 12 years of experience and expertise within the industry whereas Subject Matter Experts are those with at least 15 years of experience behind their back within the same space. The data with the help of two main processes i.e., FGDs (Focused Group Discussions) and IDs (Individual Discussions). This gives us a 3rd party nonbiased primary view of the market scenario making it a more dependable one while collation of the data pointers.
Step 3: Data Bank Validation
Once all the information is collected via primary and secondary sources, we run that information for data validation. At our intelligence centre our research heads track a lot of information related to the market which includes the quarterly reports, the daily stock prices, and other relevant information. Our data bank server gets updated every fortnight and that is how the information which we collected using our primary and secondary information is revalidated in real time.
Step 4: QA/QC Process
After all the data collection and validation our team does a final level of quality check and quality assurance to get rid of any unwanted or undesired mistakes. This might include but not limited to getting rid of the any typos, duplication of numbers or missing of any important information. The people involved in this process include technical content writers, research heads and graphics people. Once this process is completed the title gets uploader on our platform for our clients to read it.
Step 5: Final QC/QA Process:
This is the last process and comes when the client has ordered the study. In this process a final QA/QC is done before the study is emailed to the client. Since we believe in giving our clients a good experience of our research studies, therefore, to make sure that we do not lack at our end in any way humanly possible we do a final round of quality check and then dispatch the study to the client.
Key Segments:
By Printing Technology
Gravure
Flexographic
Inkjet
Screen Printing
Offset
By Material Type
Plastic Films (PET, PEN, etc.)
Paper
Metal Foils
Textiles
By Application
Flexible Electronics
Printed Sensors
RFID Tags
Solar Panels
OLED Displays
By End-Use Industry
Consumer Electronics
Automotive
Healthcare
Energy
Packaging
Request for Segment Customization as per your Business Requirement: Segment Customization Request
Regional Coverage:
North America
US
Canada
Mexico
Europe
Germany
France
UK
Italy
Spain
Poland
Turkey
Rest of Europe
Asia Pacific
China
India
Japan
South Korea
Singapore
Australia
Taiwan
Rest of Asia Pacific
Middle East & Africa
UAE
Saudi Arabia
Qatar
South Africa
Rest of Middle East & Africa
Latin America
Brazil
Argentina
Rest of Latin America
Request for Country Level Research Report: Country Level Customization Request
Available Customization
With the given market data, SNS Insider offers customization as per the company’s specific needs. The following customization options are available for the report:
Detailed Volume Analysis
Criss-Cross segment analysis (e.g. Product X Application)
Competitive Product Benchmarking
Geographic Analysis
Additional countries in any of the regions
Customized Data Representation
Detailed analysis and profiling of additional market players