Smart Railways Market Report Scope & Overview
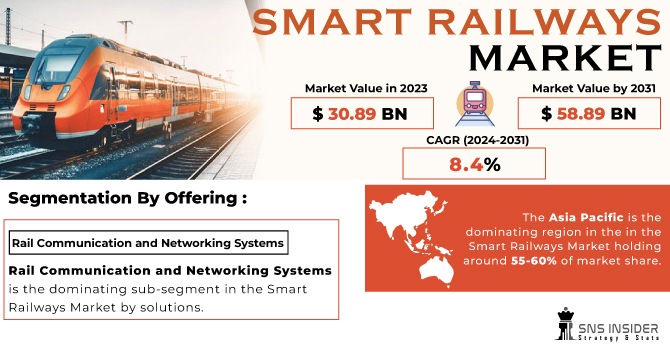
The Smart Railways Market size was valued at USD 30.89 billion in 2023 and is expected to reach USD 58.89 billion by 2031, and grow at a CAGR of 8.4% over the forecast period 2024-2031.
Sensors are strategically placed throughout railways as smart railways use the Internet of Things to remotely monitor train health, track conditions, and infrastructure for real-time data and predictive maintenance. Advanced signalling systems like automatic train control optimize train movements and safety.
Get more information on Smart Railways Market - Request Sample Report
Big data analytics from these sensors helps railways identify patterns, optimize operations, and make better decisions. They can even predict maintenance needs to reduce downtime and improve reliability. Smart railways also aim to be sustainable by optimizing train schedules, using regenerative braking, and employing energy-efficient infrastructure. Passengers benefit from real-time information on schedules, delays, and seating through apps and displays, reducing stress. Smart railways often offer digital ticketing, contactless payments, and even Wi-Fi for a seamless and entertaining travel experience, while advanced security systems ensure passenger safety.
MARKET DYNAMICS:
KEY DRIVERS:
- Smart railways with real-time data monitoring and electric locomotives are driving growth in rail logistics as global trade expands.
The rising global trade is fueling the growth in railway logistics. Operators are using smart technology like CBTC systems and real-time sensors to improve efficiency and monitor operations. As the key link between sea and land logistics, freight trains rely on real-time data for seamless cross-border movement. 4G LTE or 5G advancements allow access to tracking data from trains, enabling better communication. The industry is shifting towards sustainable electric locomotives, and governments are utilizing Build-Operate-Transfer contracts to reduce project costs.
RESTRAINTS:
- Data Security and High Costs Threaten Smart Railways Growth
Massive databases holding railway information, passenger details, and sensor data are vulnerable to hacking through phishing attacks or malware. The third-party service providers managing passenger information systems could manipulate or expose user data. These breaches could damage a railway operator's reputation and hinder overall market growth. The high upfront costs required to upgrade tracks and implement smart technologies, along with ongoing maintenance expenses, pose a significant financial hurdle. Limited infrastructure and a lack of financial support from governments further restrict market expansion.
OPPORTUNITIES:
- Real-time information on schedules, delays, and seating via apps and displays reduces passenger stress and improves travel experience.
- Digital ticketing, contactless payments, and Wi-Fi connectivity enhance passenger convenience and satisfaction.
CHALLENGES:
- Data security breaches can expose sensitive railway information and passenger data.
- Ongoing operational and maintenance costs are significantly higher than conventional railways.
IMPACT OF RUSSIA-UKRAINE WAR
The war in Russia-Ukraine has disrupted the Smart Railways Market in several ways, impacting both existing projects and future growth. The sanctions imposed on Russia have restricted access to crucial technology and components needed for smart railway systems. These components, often produced by western companies, are vital for functionalities like CBTC systems and high-speed sensors. This disrupts ongoing smart railway projects in Russia and neighbouring countries relying on Russian suppliers. The war has caused a global rise in material and energy prices. This significantly increases the already high upfront costs associated with smart railway infrastructure upgrades and technology implementation. This financial strain discourages potential investors and railway operators in the region. The overall impact on the global Smart Railways Market is likely around 2-3% as it creates logistical challenges and delays for ongoing smart railway projects.
IMPACT OF ECONOMIC SLOWDOWN
Economic slowdowns can significantly disrupt the smart railways market. Government budget cuts investments in these projects, which require high upfront costs for upgrades and technology. Decreased investor confidence during slowdowns also discourages private funding, especially for public-private partnership (PPP) initiatives. The economic downturn often led to decline in international trade and freight transport, reducing the urgency for efficiency gains offered by smart railways. Due to limited budget during slowdowns, can make railway operators delay implementing smart technology. Economic downturns can also lead to project completion delays due to budget constraints and supply chain disruptions, pushing back the timeline for realizing the benefits of smart railways and impacting market growth.
KEY MARKET SEGMENTS:
By Offering
- Solutions
-
- Passenger Information System
- Multimedia Information and Entertainment
- Network Connectivity
- Passenger Information System
-
- Freight Management System
- Freight Operation Management
- Freight Tracking
- Security and Safety Solutions
- Video Surveillance and Analytics
- Intrusion Detection
- Access control
- Fire alarm and voice evacuation
- Others (imaging and scanning solutions and security information management solutions)
- Rail Communication and Networking System
- Ground-To-Train Communication
- Train-To-Train Communication
- Smart Ticketing System
- Rail Analytics System
- Rail Asset Management and Maintenance Solutions
- Asset Planning and Scheduling
- Workforce Management and Optimization
- Condition-based monitoring
- Predictive maintenance
- Others (incident management, warranty management, and material management)
- Rail Operation and Control Solutions
- Freight Management System
- Services
- Professional Services
- Consulting
- System Integration and Deployment
- Training, Support, and Maintenance
- Managed Services
- Professional Services
Rail Communication and Networking Systems is the dominating sub-segment in the Smart Railways Market by solutions. This segment is crucial for efficient train operations and real-time data exchange. Ground-to-train and train-to-train communication solutions enable smooth traffic management, improved safety, and better operational visibility. The increasing adoption of technologies like CBTC (Communication-Based Train Control) is fueling growth in this segment.
Managed Services is the dominating sub-segment in the Smart Railways Market by services. This segment offers a cost-effective way for railway operators to manage their smart railway infrastructure. Managed service providers handle system operations, maintenance, and updates, allowing railway operators to focus on core competencies.
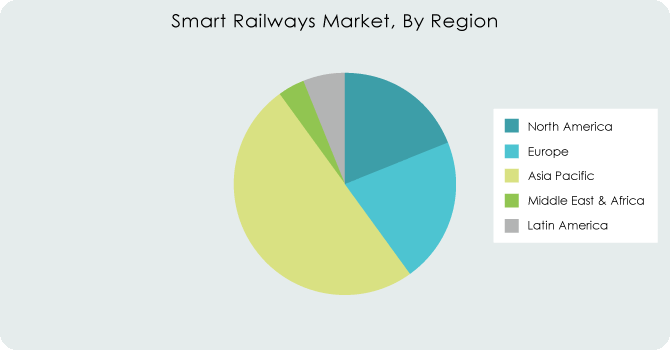
REGIONAL ANALYSES
The Asia Pacific is the dominating region in the in the Smart Railways Market holding around 55-60% of market share. This dominance stems from the factors like rising car production necessitating efficient railways, growing infrastructure development, and government initiatives like high-speed rail investments. Existing railways are also undergoing modernization to improve efficiency and safety.
North America is the second highest region in this market. Established railway players with a focus on innovation, coupled with stringent safety regulations and a strong technological infrastructure, drive this region's significance.
Europe is the fastest growing region in this market. This rapid growth is driven by significant investments in upgrading aging infrastructure across Europe. The focus on sustainable transportation solutions perfectly aligns with smart railways' energy efficiency benefits. Public-private partnerships (PPPs) are also on the rise, facilitating the financing of smart railway projects and accelerating growth in this region.
Get Customized Report as per Your Business Requirement - Request For Customized Report
Regional Coverage
North America
-
US
-
Canada
-
Mexico
Europe
-
Eastern Europe
-
Poland
-
Romania
-
Hungary
-
Turkey
-
Rest of Eastern Europe
-
-
Western Europe
-
Germany
-
France
-
UK
-
Italy
-
Spain
-
Netherlands
-
Switzerland
-
Austria
-
Rest of Western Europe
-
Asia Pacific
-
China
-
India
-
Japan
-
South Korea
-
Vietnam
-
Singapore
-
Australia
-
Rest of Asia Pacific
Middle East & Africa
-
Middle East
-
UAE
-
Egypt
-
Saudi Arabia
-
Qatar
-
Rest of Middle East
-
-
Africa
-
Nigeria
-
South Africa
-
Rest of Africa
-
Latin America
-
Brazil
-
Argentina
-
Colombia
-
Rest of Latin America
KEY PLAYERS
The major key players are Alstom, Cisco, Wabtec, ABB, Hitachi, Huawei, IBM, Siemens, Advantech, Toshiba and other key players.
Cisco-Company Financial Analysis
RECENT DEVELOPMENT
-
In Oct. 2023: Huawei has launched a new base station designed for the next-generation railway communication standard. They also released a white paper outlining their future railway mobile communication system (FRMCS) to aid global transportation companies in their digital transformation efforts.
-
In Sept. 2023: Alcatel-Lucent Enterprise and Nokia teamed up to deliver the network for the Grand Paris Express, a massive metro expansion in Paris. This project adds 200km of new rail lines and extends an existing line, all powered by Nokia's high-speed network technology.
| Report Attributes | Details |
| Market Size in 2023 | US$ 30.89 Bn |
| Market Size by 2031 | US$ 58.89 Bn |
| CAGR | CAGR of 8.4% From 2024 to 2031 |
| Base Year | 2023 |
| Forecast Period | 2024-2031 |
| Historical Data | 2020-2022 |
| Report Scope & Coverage | Market Size, Segments Analysis, Competitive Landscape, Regional Analysis, DROC & SWOT Analysis, Forecast Outlook |
| Key Segments | • By Offering (Rail Asset Management and Maintenance, Operation and Control, Communication and Networking, security and Safety, Rail Analytics) • By Services (Professional and Managed) |
| Regional Analysis/Coverage | North America (US, Canada, Mexico), Europe (Eastern Europe [Poland, Romania, Hungary, Turkey, Rest of Eastern Europe] Western Europe] Germany, France, UK, Italy, Spain, Netherlands, Switzerland, Austria, Rest of Western Europe]). Asia Pacific (China, India, Japan, South Korea, Vietnam, Singapore, Australia, Rest of Asia Pacific), Middle East & Africa (Middle East [UAE, Egypt, Saudi Arabia, Qatar, Rest of Middle East], Africa [Nigeria, South Africa, Rest of Africa], Latin America (Brazil, Argentina, Colombia Rest of Latin America) |
| Company Profiles | Alstom, Cisco, Wabtec, ABB, Hitachi, Huawei, IBM, Siemens, Advantech, Toshiba |
| Key Drivers | • The rising demand for the smart railways. |
| Market Restraints | • The requirement of the high initial investments. |
Frequently Asked Questions
The rising technological advancement and the continuous government support.
North America is the fastest growing region of the Smart Railways Market.
The major key players are Alstom, Cisco, Wabtec, ABB, Hitachi, Huawei, IBM, Siemens, Advantech, Toshiba, and others
The Compound Annual Growth rate for Smart Railways Market over the forecast period is 8.4%.
The smart railways market is estimated to reach USD 58.89 Bn by 2031 and was valued at USD 30.89 Bn in 2023 and is expected to grow at a CAGR of 8.4% over the forecast period of 2024-2031.
Get in Touch
